Methods for analysis of spectral data and their applications

a spectral data and analysis method technology, applied in the field of methods and chemometric methods, can solve the problems of large range of desired effects and unwanted side effects in patients, high operational cost of genomic methods, and high complexity of biological consequences of gene expression or gene expression alteration following perturbation

Inactive Publication Date: 2005-06-16
METABOMETRIX
View PDF12 Cites 126 Cited by
  • Summary
  • Abstract
  • Description
  • Claims
  • Application Information

AI Technical Summary

Benefits of technology

[0087] One aspect of the present invention pertains to a method of classification which employs or relies upon one or more diagnostic species identified by a method as described herein
[0088] One aspect of the present invention pertains to use of one or more diagnostic species identified by a method of classification as described herein.
[0089] One aspect of the presen

Problems solved by technology

In a similar manner, the treatment of disease through the administration of drugs can result in a wide range of desired effects and unwanted side effects in a patient.
However, the biological consequences of gene expression, or altered gene expression following perturbation, are extremely complex.
At present, genomic methods have a high associated operational cost and proteomic methods require investment in expensive capital cost equipment and are labour intensive, but both have the potential to be powerful tools for studying biological response.
The choice of method is still uncertain since careful studies have sometimes shown a low correlation between the pattern of gene expression and the pattern of protein expression, probably due to sampling for the two technologies at inappropriate time points.
Even in combination, genomic and proteomic methods still do not provide the range of information needed for understanding integrated cellular function in a living system, since they do not take account of the dynamic metabolic status of the whole organism.
Conversely, sampling tissue for genomic and proteomic studies at inappropriate time points may result in a relevant gene or protein being overlooked.
Gene-based prognosis has yet to become a clinical reality for any major prevalent disease, almost all of which have multi-gene modes of inheritance and significant environmental impact making it difficult to identify the gene panels responsible for susceptibility.
While genomic and proteomic methods may be useful aids, for example, in drug development, they do suffer from substantial limitations.
For example, while genomic and proteomic methods may ultimately give profound insights into toxicological mechanisms and provide new surrogate biomarkers of disease, at present it is very difficult to relate genomic and proteomic findings to classical cellular or biochemical indices or endpoints.
One simple reason for this is that with current technology and approach, the correlation of the time-response to drug exposure is difficult.
Further difficulties arise with in vitro cell-based studies.
For example, exposure to ethanol in vivo may cause many changes in gene expression but none of these events explains drunkenness.
In cases such as these, genomic and proteomic methods are likely to be ineffective.
However, all disease or drug-induced pathophysiological perturbations result in disturbances in the ratios and concentrations, binding or fluxes of endogenous biochemicals, either by direct chemical reaction or by binding to key enzymes or nucleic acids that control metabolism.
If these disturbances are of sufficient magnitude, effects will result which will affect the efficient functioning of the whole organism.
Secondly, many of the risk factors already identified (e.g., levels of various lipids in blood) are small molecule metabolites which will contribute to the metabonomic dataset.
A similar limitation also applies to proteomic studies.
The multivariate nature of the NMR data means that classification of samples is possible using a combination of descriptors even when one descriptor is not sufficient, because of the inherently low analytical variation in the data.
If a substantial amount of D2O has been added, then it is possible that certain 1H NMR resonances will be lost by H/D exchange.
Freeze-drying of biofluid samples also causes the loss of volatile components such as acetone.
Biofluids are also v

Method used


Image

  • Methods for analysis of spectral data and their applications
  • Methods for analysis of spectral data and their applications
  • Methods for analysis of spectral data and their applications

Examples


example 1

Identical Versus Non-Identical Twins

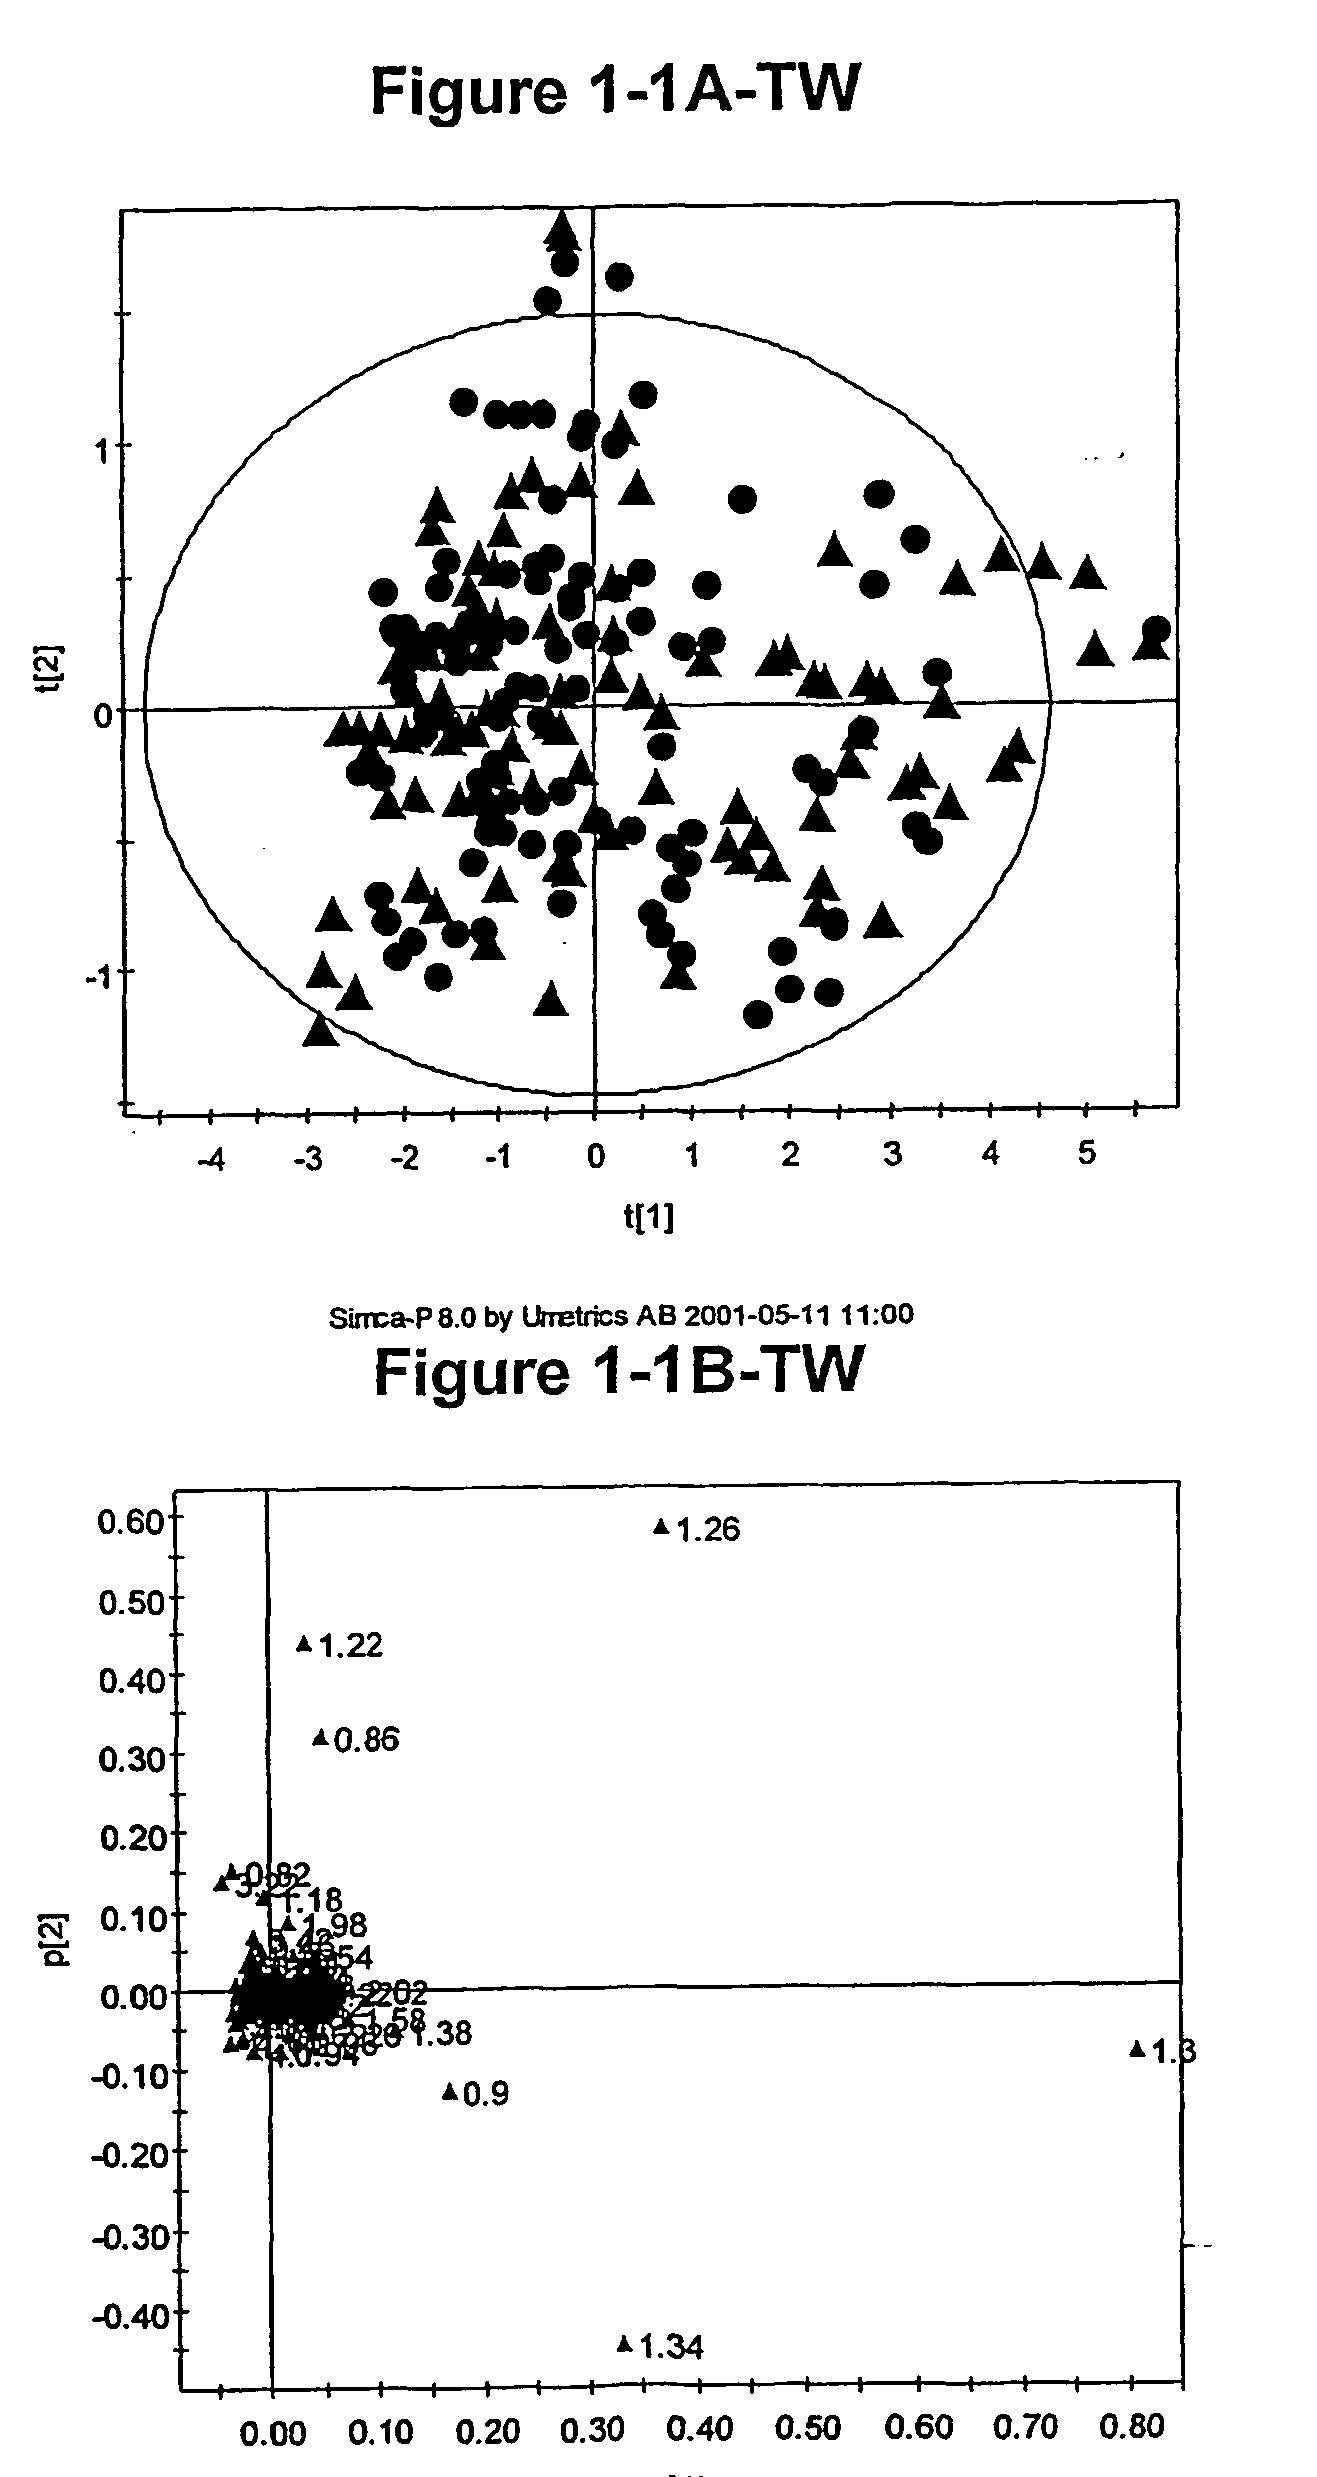
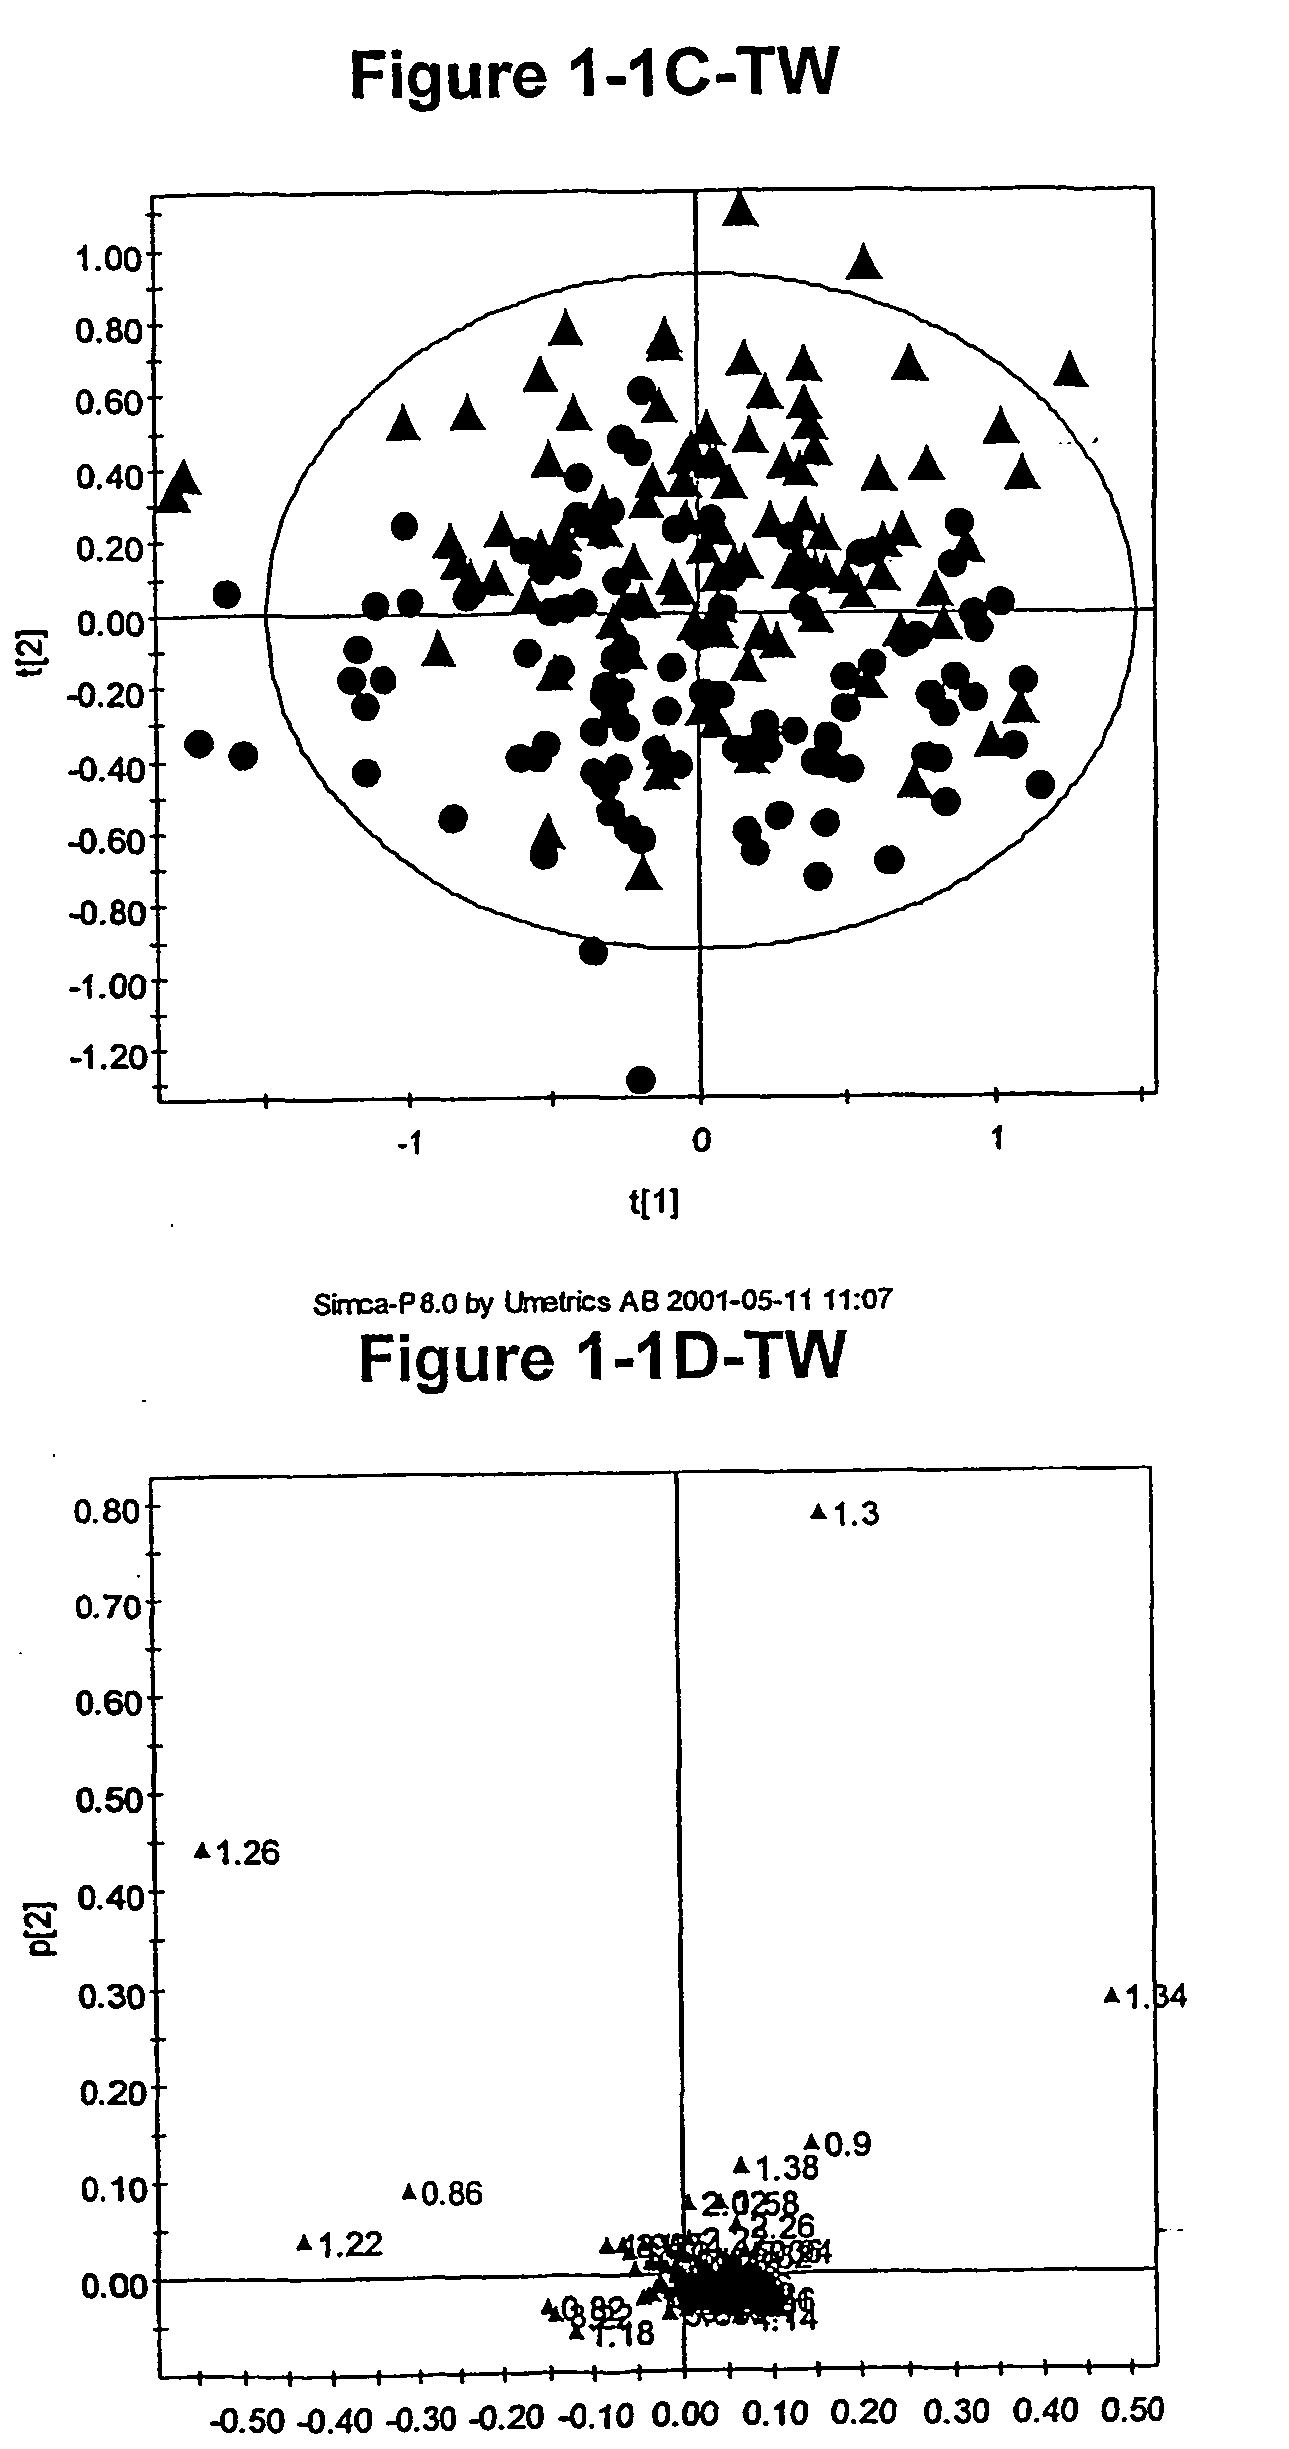
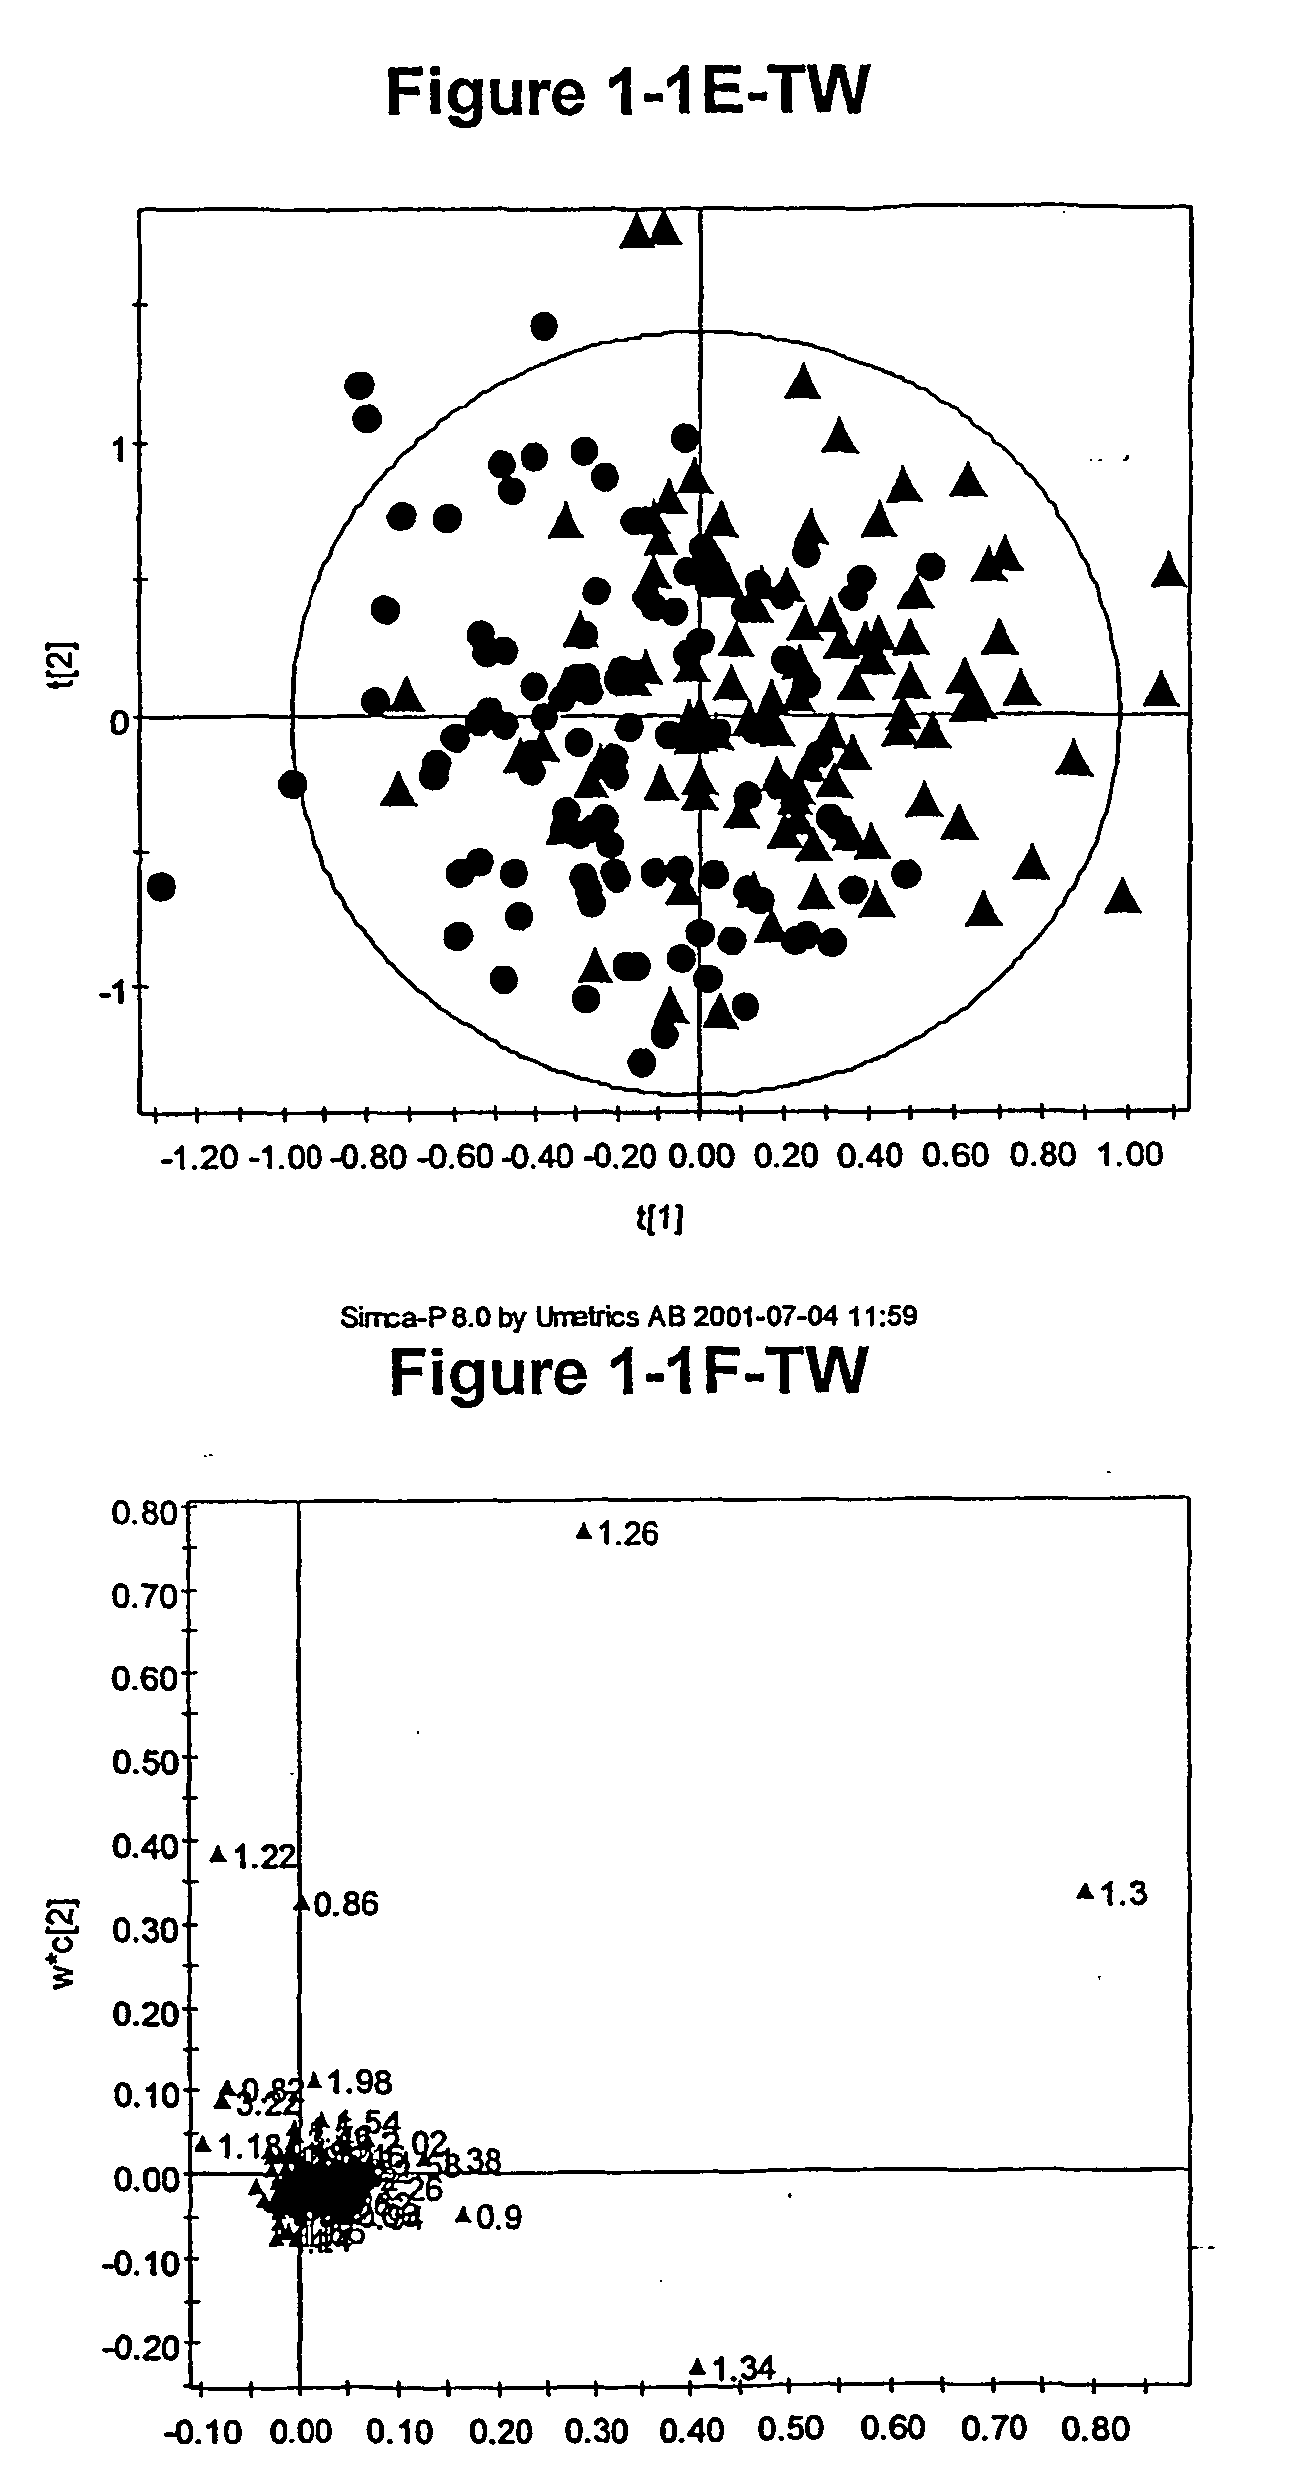
[0967] As discussed above, the inventors have developed novel methods (which employ multivariate statistical analysis and pattern recognition (PR) techniques, and optionally data filtering techniques) of analysing data (e.g., NMR spectra) from a test population which yield accurate mathematical models which may subsequently be used to classify a test sample or subject, and / or in diagnosis.

[0968] These techniques have been applied to the analysis of blood serum in the context of identifying identical and non-identical twins. The metabonomic analysis can distinguish between identical and non-identical twins. Novel diagnostic biomarkers for identical and non-identical twins have been identified, and methods for associated classification have been developed.

[0969] This example describes how lifelong differences in metabolism between identical monozygotic (MZ) and non-identical dizygotic (DZ) twins are revealed by 1H NMR based metabonomics, specific...

example 2

Hypertension

[1045] As discussed above, the inventors have developed novel methods (which employ multivariate statistical analysis and pattern recognition (PR) techniques, and optionally data filtering techniques) of analysing data (e.g., NMR spectra) from a test population which yield accurate mathematical models which may subsequently be used to classify a test sample or subject, and / or in diagnosis.

[1046] These techniques have been applied to the analysis of blood serum in the context of hypertension. The metabonomic analysis can distinguish between individuals with and without hypertension. Novel diagnostic biomarkers for hypertension have been identified, and methods for associated diagnosis have been developed.

Obtaining NMR Spectra

[1047] Analysis was performed on serum samples collected as part of the coronary heart disease (CHD) NCA / TVD study described herein.

[1048] The data were classified according to systolic blood pressure (SBP), as follows: [1049] low SBP (≦130 mmHg...

example 3

Diagnosis of Coronary Heart Disease (CHD)

[1105] As discussed above, the inventors have developed novel methods (which employ multivariate statistical analysis and pattern recognition (PR) techniques, and optionally data filtering techniques) of analysing data (e.g., NMR spectra) from a test population which yield accurate mathematical models which may subsequently be used to classify a test sample or subject, and / or in diagnosis.

[1106] In the context of atherosclerosis / CHD, the inventors have applied these techniques to the analysis of either serum or plasma taken from individuals who have been extensively characterized, both for the presence of atherosclerosis / CHD by the gold-standard angiographic technique and also for a wide range of conventional risk factors. The metabonomic analysis can distinguish between individuals with and without atherosclerosis / CHD; and / or the degree of atherosclerosis / CHD. Novel diagnostic biomarkers for atherosclerosis / CHD have been identified, and me...


PUM


Abstract

This invention pertains to chemometric methods for the analysis of chemical, biochemical, and biological data, for example, spectral data, for example, nuclear magnetic resonance (NMR) spectra, and their applications, including, e.g., classification, diagnosis, prognosis.

Description

RELATED APPLICATIONS [0001] This application is related to (and where permitted by law, claims priority to): [0002] (a) United Kingdom patent application GB 0109930.8 filed 23 Apr. 2001; [0003] (b) United Kingdom patent application GB 0117428.3 filed 17 Jul. 2001; [0004] (c) United States Provisional patent application U.S. Ser. No. 60 / 307,015 filed 20 Jul. 2001; the contents of each of which are incorporated herein by reference in their entirety. [0005] This application is one of five applications filed on even date naming the same applicant: [0006] (1) attorney reference number WJW / LP5995600 (PCT / GB02 / ______); [0007] (2) attorney reference number WJW / LP5995618 (PCT / GB02 / ______); [0008] (3) attorney reference number WJW / LP5995626 (PCT / GB02 / ______); [0009] (4) attorney reference number WJW / LP5995634 (PCT / GB02 / ______); [0010] (5) attorney reference number WJW / LP5995642 (PCT / GB02 / ______); the contents of each of which are incorporated herein by reference in their entirety.TECHNICAL ...

Claims


Application Information

Patent Timeline
IPC IPC(8): A61B5/055G01R33/46G01R33/465
CPCA61B5/055A61B5/412A61B5/7203A61B5/7232A61B5/7267G01R33/4625G01R33/465A61B5/7264A61P19/08G16H50/20Y02A90/10
Inventor NICHOLSON, JEREMY K.HOLMES, ELAINELINDON, JOHN CHRISTOPHERBRINDLE, JOANNE TRACEYGRAIGER, DAVID JOHN
Owner METABOMETRIX
Why Eureka
Try Eureka