Systems and methods to compensate for sources of error during electrochemical testing

a technology of electrochemical testing and sources of error, applied in the field of statistics and electrochemistry, can solve problems such as inaccurateness, inability to compensate for errors during electrochemical testing, and inability to use hands, feet, etc., to improve the accuracy of blood samples, improve the level of oxygen insensitivity, and improve the measurement sequence

Active Publication Date: 2013-10-24
ROCHE DIABETES CARE INC
View PDF4 Cites 12 Cited by
  • Summary
  • Abstract
  • Description
  • Claims
  • Application Information

AI Technical Summary

Benefits of technology

[0033]Other embodiments include an improved measurement sequence for detecting glucose in a blood sample with a glucose-specific enzyme with improved levels of oxygen insensitivity.
[0034]Other embodiments include a maltose-insensitive system and / or method for testing fluid, such as blood, for an analyte with improved accuracy for blood samples with various oxygenation levels, such as capillary, venous, arterial and neonatal blood.

Problems solved by technology

Failure to do so can produce extreme complications, including blindness and loss of circulation in the extremities, which can ultimately deprive a diabetic of use of his or her fingers, hands, feet, etc.
There are, however, a number of error sources that can create inaccurate results when measuring analyte levels in body fluid.
For example, one issue with amperometric sensors is that the rate of reaction will affect the current response to a direct current (DC) potential measured at a predetermined time.
Conversely, the reaction for a given amperometric test is typically considered slow when it takes longer to reach peak current in comparison to other tests.
If the reaction rate is variable, then the current response at a given time will not be representative of an accurate measurement.
Under certain operating conditions, such as when the test is performed with an ambient temperature of 6° C., the reaction is not substantially complete until 10 or more seconds, which renders a fixed test time format of 5 seconds highly inaccurate.
Sometimes harsh conditions to which the biosensor sensor is exposed worsen its accuracy.
Occasionally, the biosensor test strip can experience harmful conditions, often termed “strip rotting” or “vial abuse,” which refers to when the sensors are abused and exposed to detrimental conditions, such as excessive heat and / or moisture, during storage.
This exposure to excessive heat and / or moisture also can result in slowing of the reaction times due to loss of enzyme activity leading to an inaccurate result using the fixed test time referred to above.
However, as a practical matter, some otherwise useful or desirable enzymes cannot be incorporated with high enough amounts into the biosensor without causing a significant loss in its performance.
In addition, enzymes of high specific activities are not always desirable for all analytes.
For example, many such systems are susceptible to adverse effects from various interfering substances (also referred to as non-analyte reacting compounds), such as maltose, galactose, xylose and the like, which can create inaccurate readings.
Individuals undergoing peritoneal dialysis or Immunoglobulin G (IGG) therapy can experience high levels of maltose in their blood, which can interfere with accurate blood glucose readings.
Therefore, interference from maltose can be a significant problem.
However, in addition to coulometry having a number of drawbacks making it impractical for many applications, such a system is still clinically unacceptable due to interference from maltose.
In addition to slowing enzyme activity, vial abuse also can result in an increase of background current, sometimes referred to as “blank current,” when readings are taken.
Over time, heat and / or humidity from vial abuse will tend to reduce the mediator.
The resulting background or blank current will tend to bias the signal, which in turn can lead to inaccurate results.
Impurities in the reagent also can increase background or blank current problems.
Yet another source of error is blank current derived from other interfering compounds present in the blood as opposed to originating in the reagent.
These and other compounds present in the fluid sample can contribute to a so-called blank current measured by the electrode that is not related to glucose concentration, and therefore provides a source of error.
When the reagent used for the electrochemical testing includes GDH, the presence of one of these interfering sugars can adversely affect the measured glucose concentration.
It also can be difficult to determine the concentrations of these interfering sugars prior to testing, and users who may have abnormal levels of such interfering sugars are frequently cautioned against using test strips with GDH.
However, some enzymes exhibiting this independence suffer from slow reactivity, which is a problem set forth and discussed above.
For example, the temperature of a fluid sample, or the concentration of red blood cells (hematocrit), uric acid, bilirubin or oxygen in body fluid can adversely influence the accuracy of blood glucose measurements.
Although this burn-off technique reduces the effect of blank or background current, it does so at the expense of partially oxidizing (or reducing) the analyte to be measured, thereby reducing the signal-to-noise ratio of the sensor.
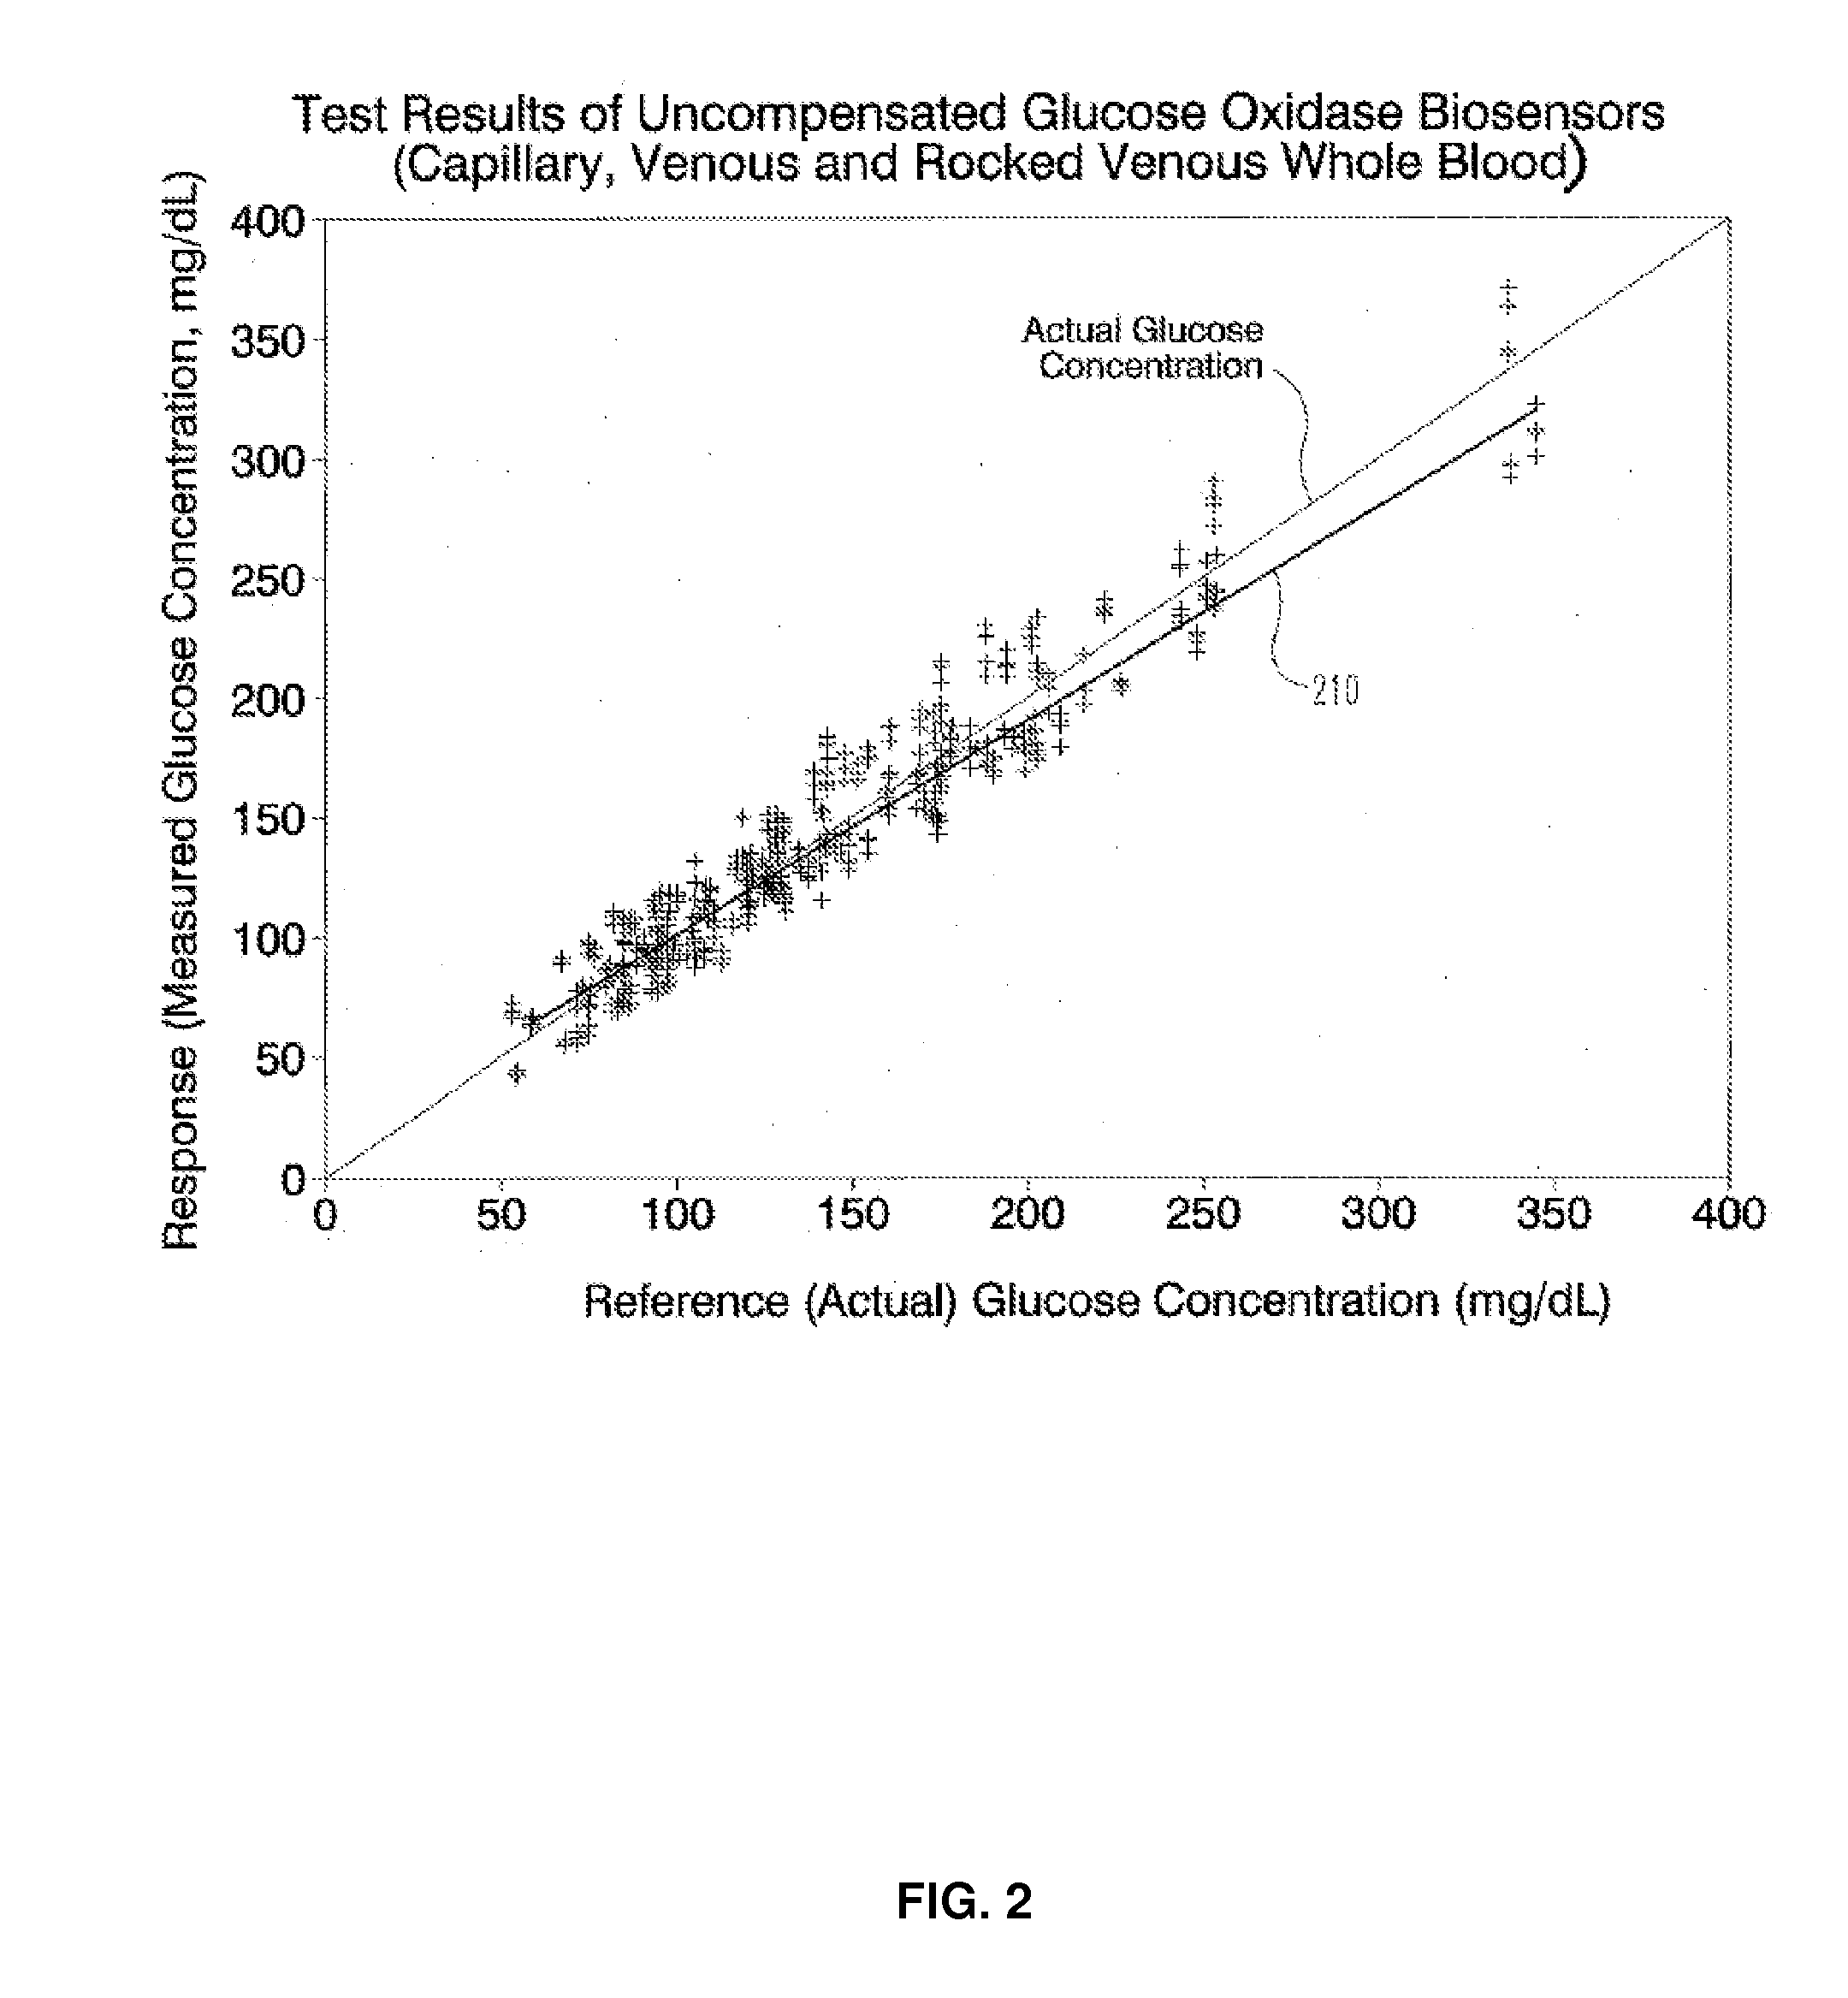
Nevertheless, such techniques have failed to compensate for variations in reaction time caused by factors such as enzymes with slow / variable reaction velocities.
In addition, some enzymes used in such sensors, such as GDH, tend to be susceptible to maltose interference.
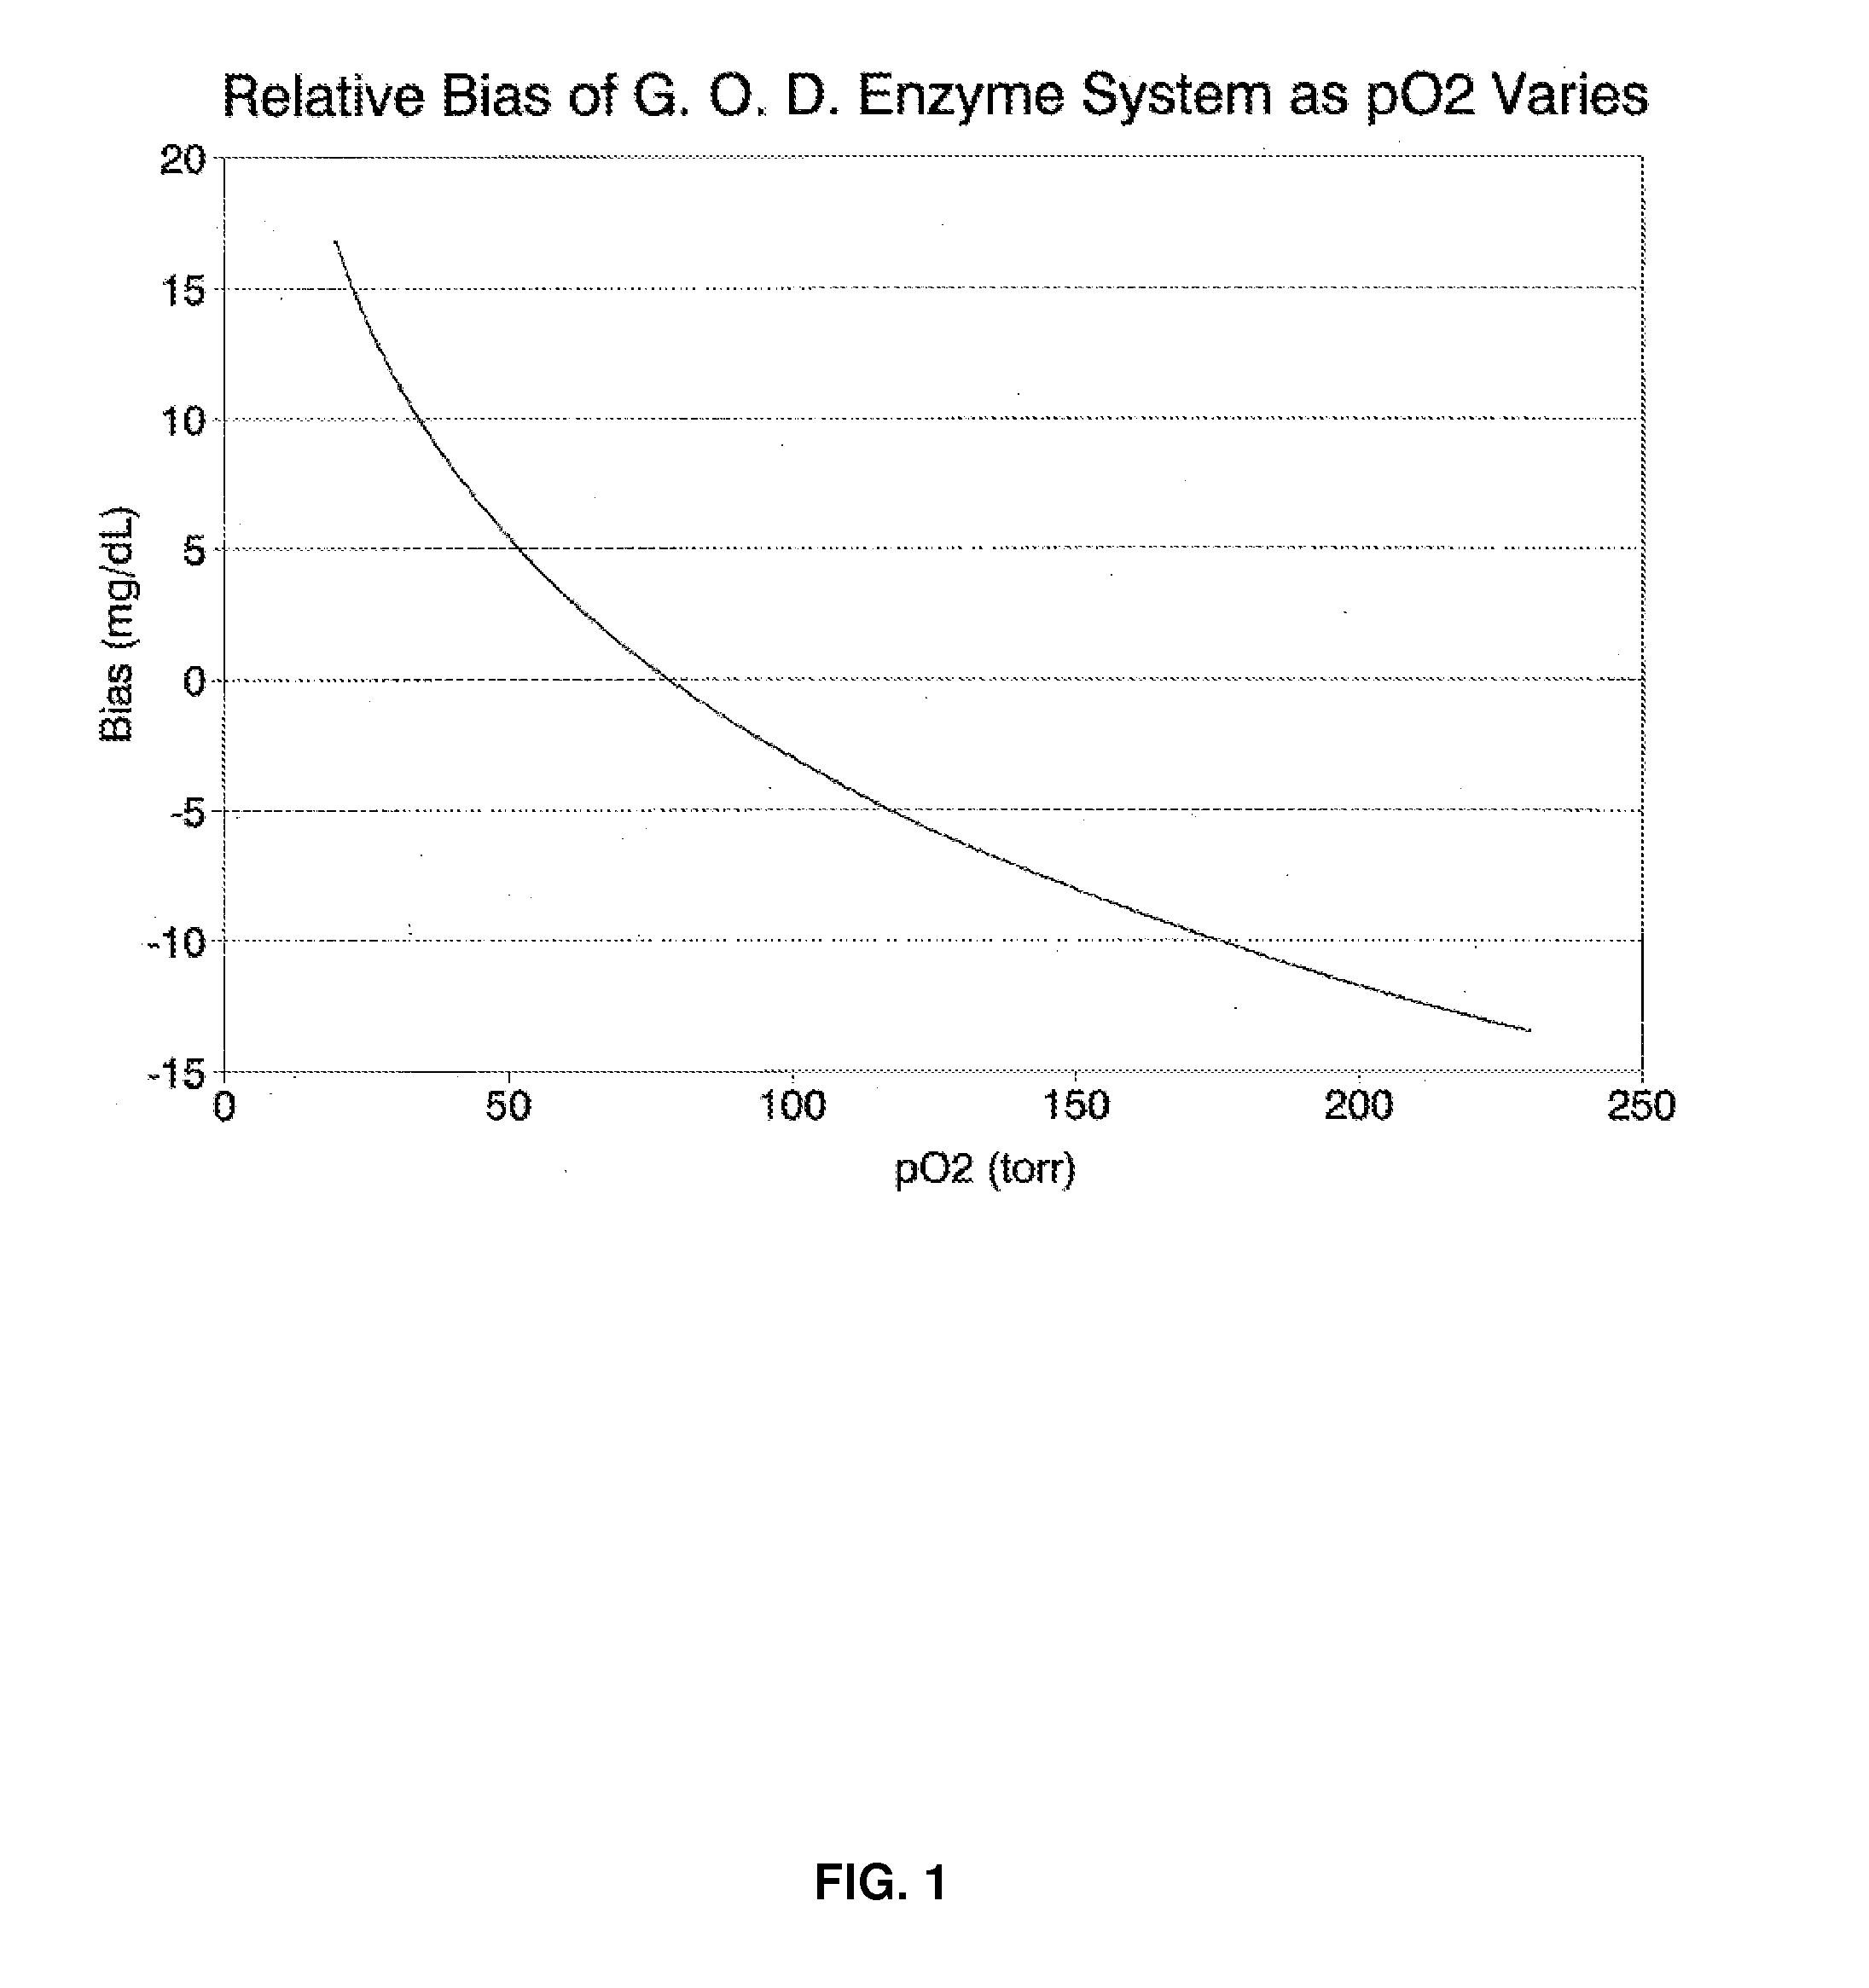
However, GOx is an enzyme for which the natural terminal electron acceptor for glucose conversion is oxygen, and variations in the level of oxygenation of blood, such as is the case when comparing venous, arterial and capillary blood, can produce variations in the GOx response and can adversely affect the accuracy of glucose measurements using GOx.

Method used


Image

  • Systems and methods to compensate for sources of error during electrochemical testing
  • Systems and methods to compensate for sources of error during electrochemical testing
  • Systems and methods to compensate for sources of error during electrochemical testing

Examples


example 1

[0120]A test sequence is employed comprising a first DC test block followed by 4 AC test blocks with different excitation frequencies, followed by a second DC test block. Shown in FIG. 8 are representative current responses for this system, with the horizontal axis representing time after fill sufficiency and the vertical axis on the left representing DC voltage. A second vertical axis, corresponding to the four AC responses, represents the frequencies of the four AC test blocks. From each of the DC test blocks, four DC readings are taken at different time points, and from each of the AC test blocks a phase-shift and an admittance value are determined and used for the glucose calculation algorithm. In total, 8 AC observables and 8 DC observables are used.

[0121]From the four phase-shift values, a weighted combination P-Effective is calculated: Peff=(p1*P1)+(p2*P2)+(p3*P3)+(p4*P4).

[0122]From the four admittance values, a weighted combination Y-Effective is calculated: Yeff=(y1*Y1)+(y2...

example 2

[0165]FIG. 9 illustrates a specific embodiment in which the first pulse and second pulse are of opposite polarity, which can be particularly useful for compensating for various factors such as, for example, slow enzyme kinetics. FIG. 9 shows a graph 78 of an example of a fixed test time sequence in accordance with one embodiment. As can be seen, the graph 78 has a first y-axis 80 located on the left side of FIG. 9 that represents the DC voltage level (in volts), including polarity, as applied during the DC pulses. In other words, to determine the voltage and polarity of the applied DC pulses, reference should be made to the first y-axis 80. A second y-axis 82 shows the frequency levels (in kHz) applied during the AC pulses. In other words, to determine the frequency levels (in kHz) applied during the applied AC pulses, reference should be made to the second y-axis 82. Graph 78 also has an x-axis 86 that indicates the time (in seconds) after fill sufficiency of the sensor 20 is detec...

example 3

[0173]In an alternative embodiment, the test sequence illustrated in FIG. 9 is altered with regard to the duration of each DC and AC pulse, as well as the magnitudes of the DC pulses. For example, with reference to the sequence references of FIG. 9, the open cell condition 96 preceding the first DC pulse 98 lasts about 2 seconds, the first DC pulse 98 has a magnitude and polarity of about +450 mV and lasts about 2.5 seconds, open cell condition 108 lasts about a quarter of a second, AC signal 112 lasts about a half second at a frequency of about 10 kHz, AC signal 114 lasts about a quarter of a second at a frequency of about 20 kHz, AC signal 116 lasts about a quarter of a second at a frequency of about 2 kHz, AC signal 118 lasts about a quarter of a second at a frequency of about 1 kHz, open cell condition 128 lasts about a quarter of a second, and second DC pulse 130 has a magnitude and polarity of about +450 mV and lasts about 2.5 seconds.

[0174]Certain embodiments have proven usef...


PUM

PropertyMeasurementUnit
timeaaaaaaaaaa
timeaaaaaaaaaa
temperatureaaaaaaaaaa

Abstract

A method is disclosed for determining analyte concentration that includes applying a first electrical potential excitation pulse to a body fluid sample in an analyte sensor, and a first current response of the body fluid sample to the first pulse is measured. A second excitation pulse is applied to the body fluid sample in the analyte sensor, and a second current response of the body fluid sample to the second pulse is measured. An analyte level in the body fluid sample is determined by compensating for sources of error based on the first current response to the first pulse.

Description

CROSS-REFERENCE TO RELATED APPLICATIONS[0001]This patent application is a continuation of Int'l Patent Application No. PCT / EP2011 / 006429; filed Dec. 20, 2011, which claims the benefit of U.S. Provisional Patent Application No. 61 / 426,062; filed Dec. 22, 2010. Each patent application is incorporated herein by reference as if set forth in its entirety.TECHNICAL FIELD[0002]The invention relates generally to statistics and electrochemistry, and more particularly to methods of measuring the presence and / or concentration of an analyte in a biological fluid, and more specifically, but not exclusively, to methods that account for various sources of error such as variability of the reaction rate and / or presence of interfering signals during measurement of the analyte with an electrochemical biosensor.BACKGROUND[0003]Measuring the concentration of substances, particularly in the presence of other confounding substances and under varied conditions, is important in many fields such as medical d...

Claims


Application Information

Patent Timeline
Patent Type & Authority Applications(United States)
IPC IPC(8): G01N27/327
CPCG01N27/3274
Inventor BURKE, DAVID W.MARQUANT, MICHAELSURRIDGE, NIGEL A.
Owner ROCHE DIABETES CARE INC
Why Eureka
Try Eureka