
Method, system, and computer code for finding spots defined in biological microarrays

a biological microarray and spot detection technology, applied in the field of biological microarray data processing techniques, can solve the problems of difficult to obtain information or be slightly (or considerably) inaccurate, and the manufacture of spotted arrays does not produce perfect rectilinear arrays, and achieves a broader range of applicability.

Inactive Publication Date: 2005-12-27
NILES SCI
View PDF8 Cites 42 Cited by
  • Summary
  • Abstract
  • Description
  • Claims
  • Application Information

AI Technical Summary

Benefits of technology

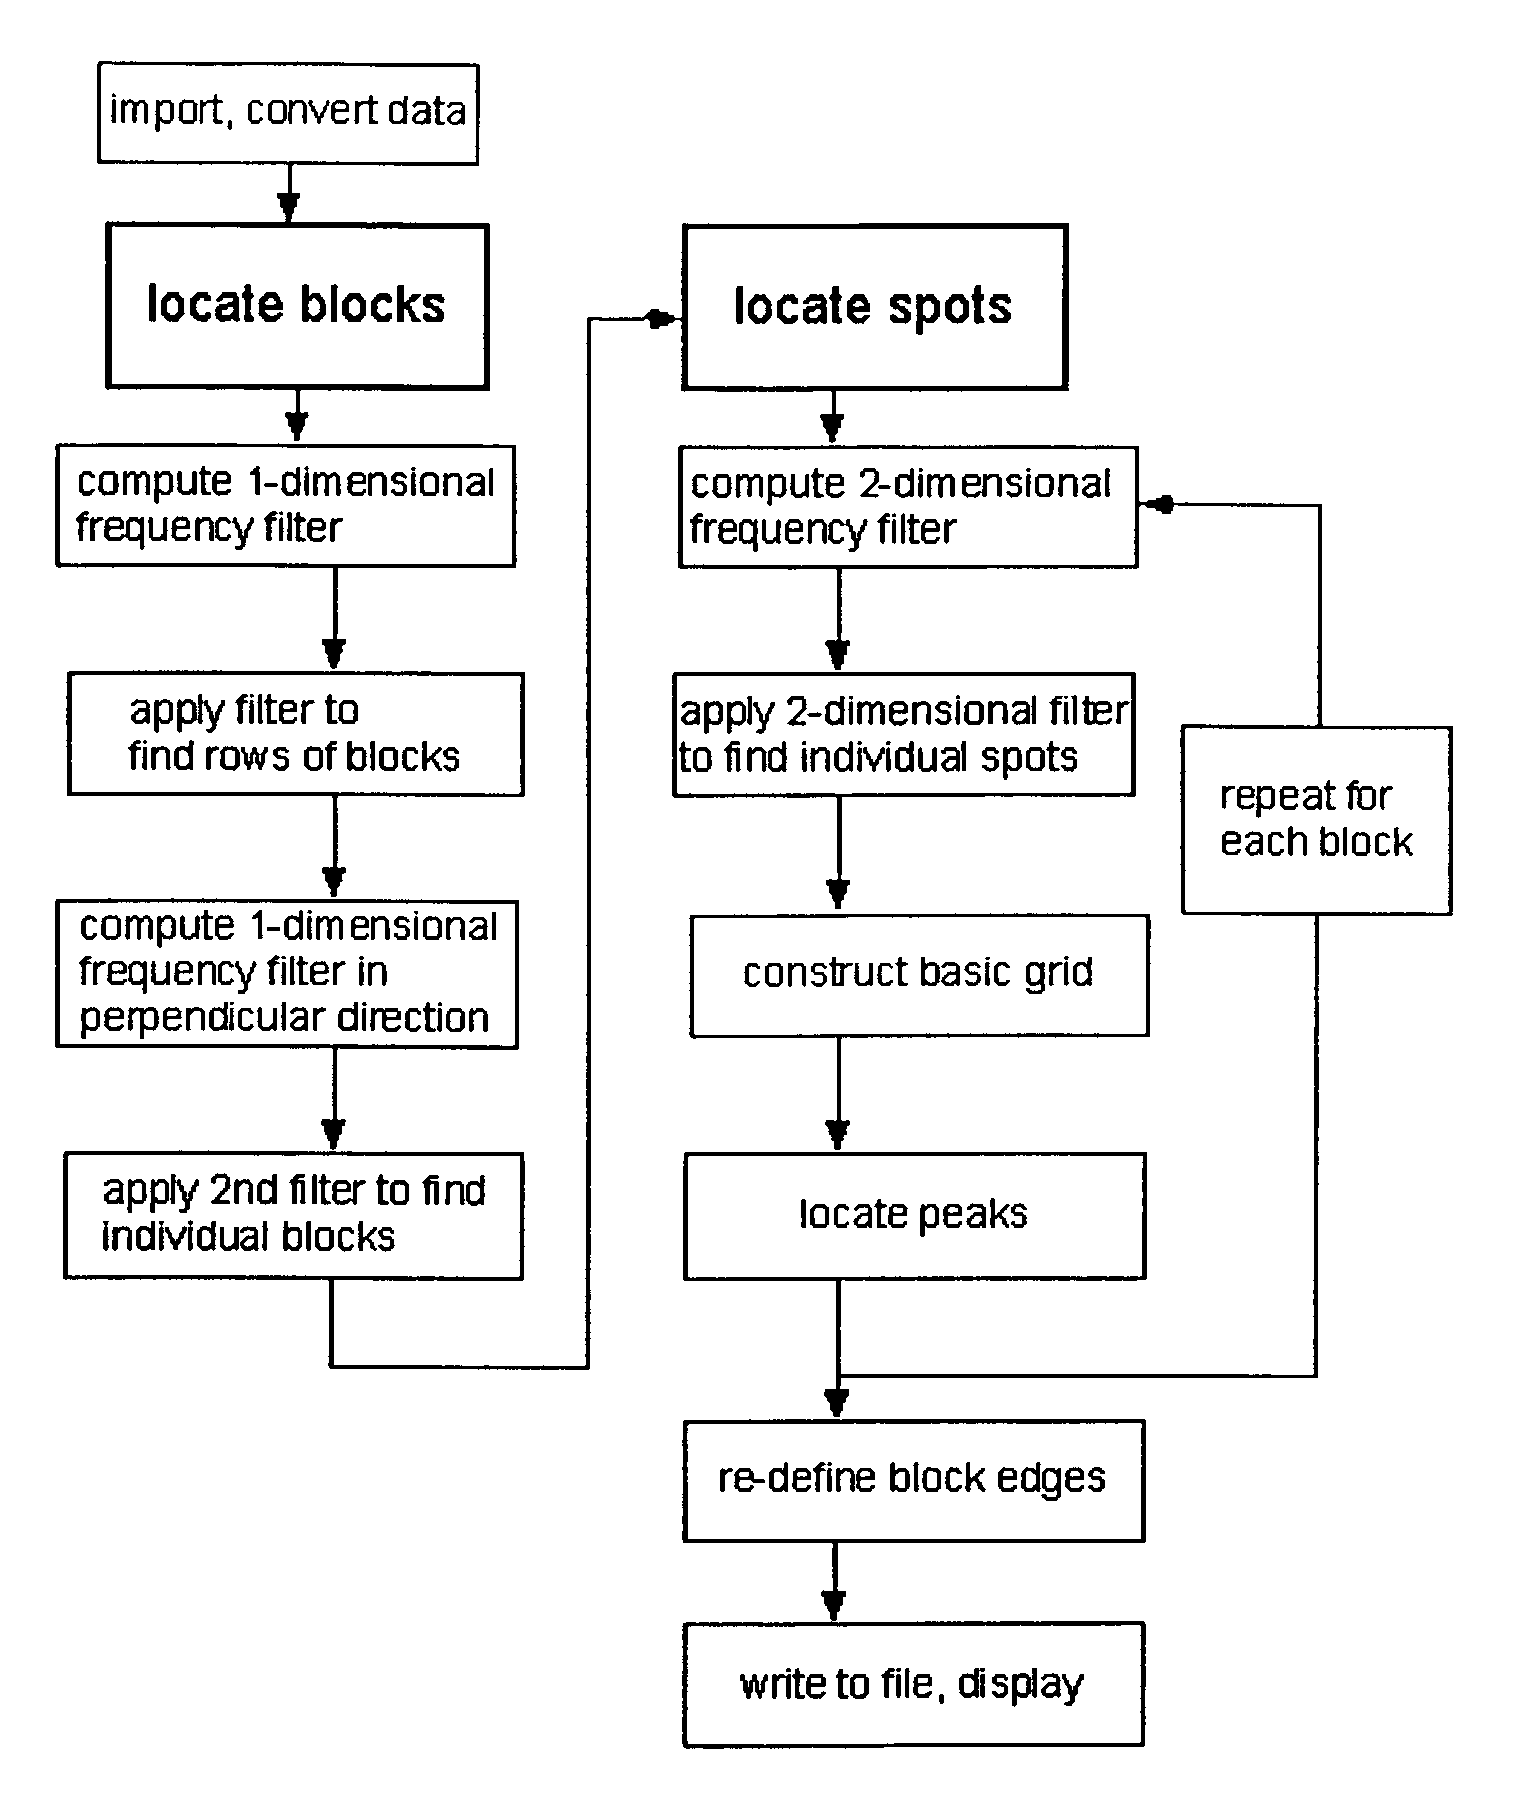
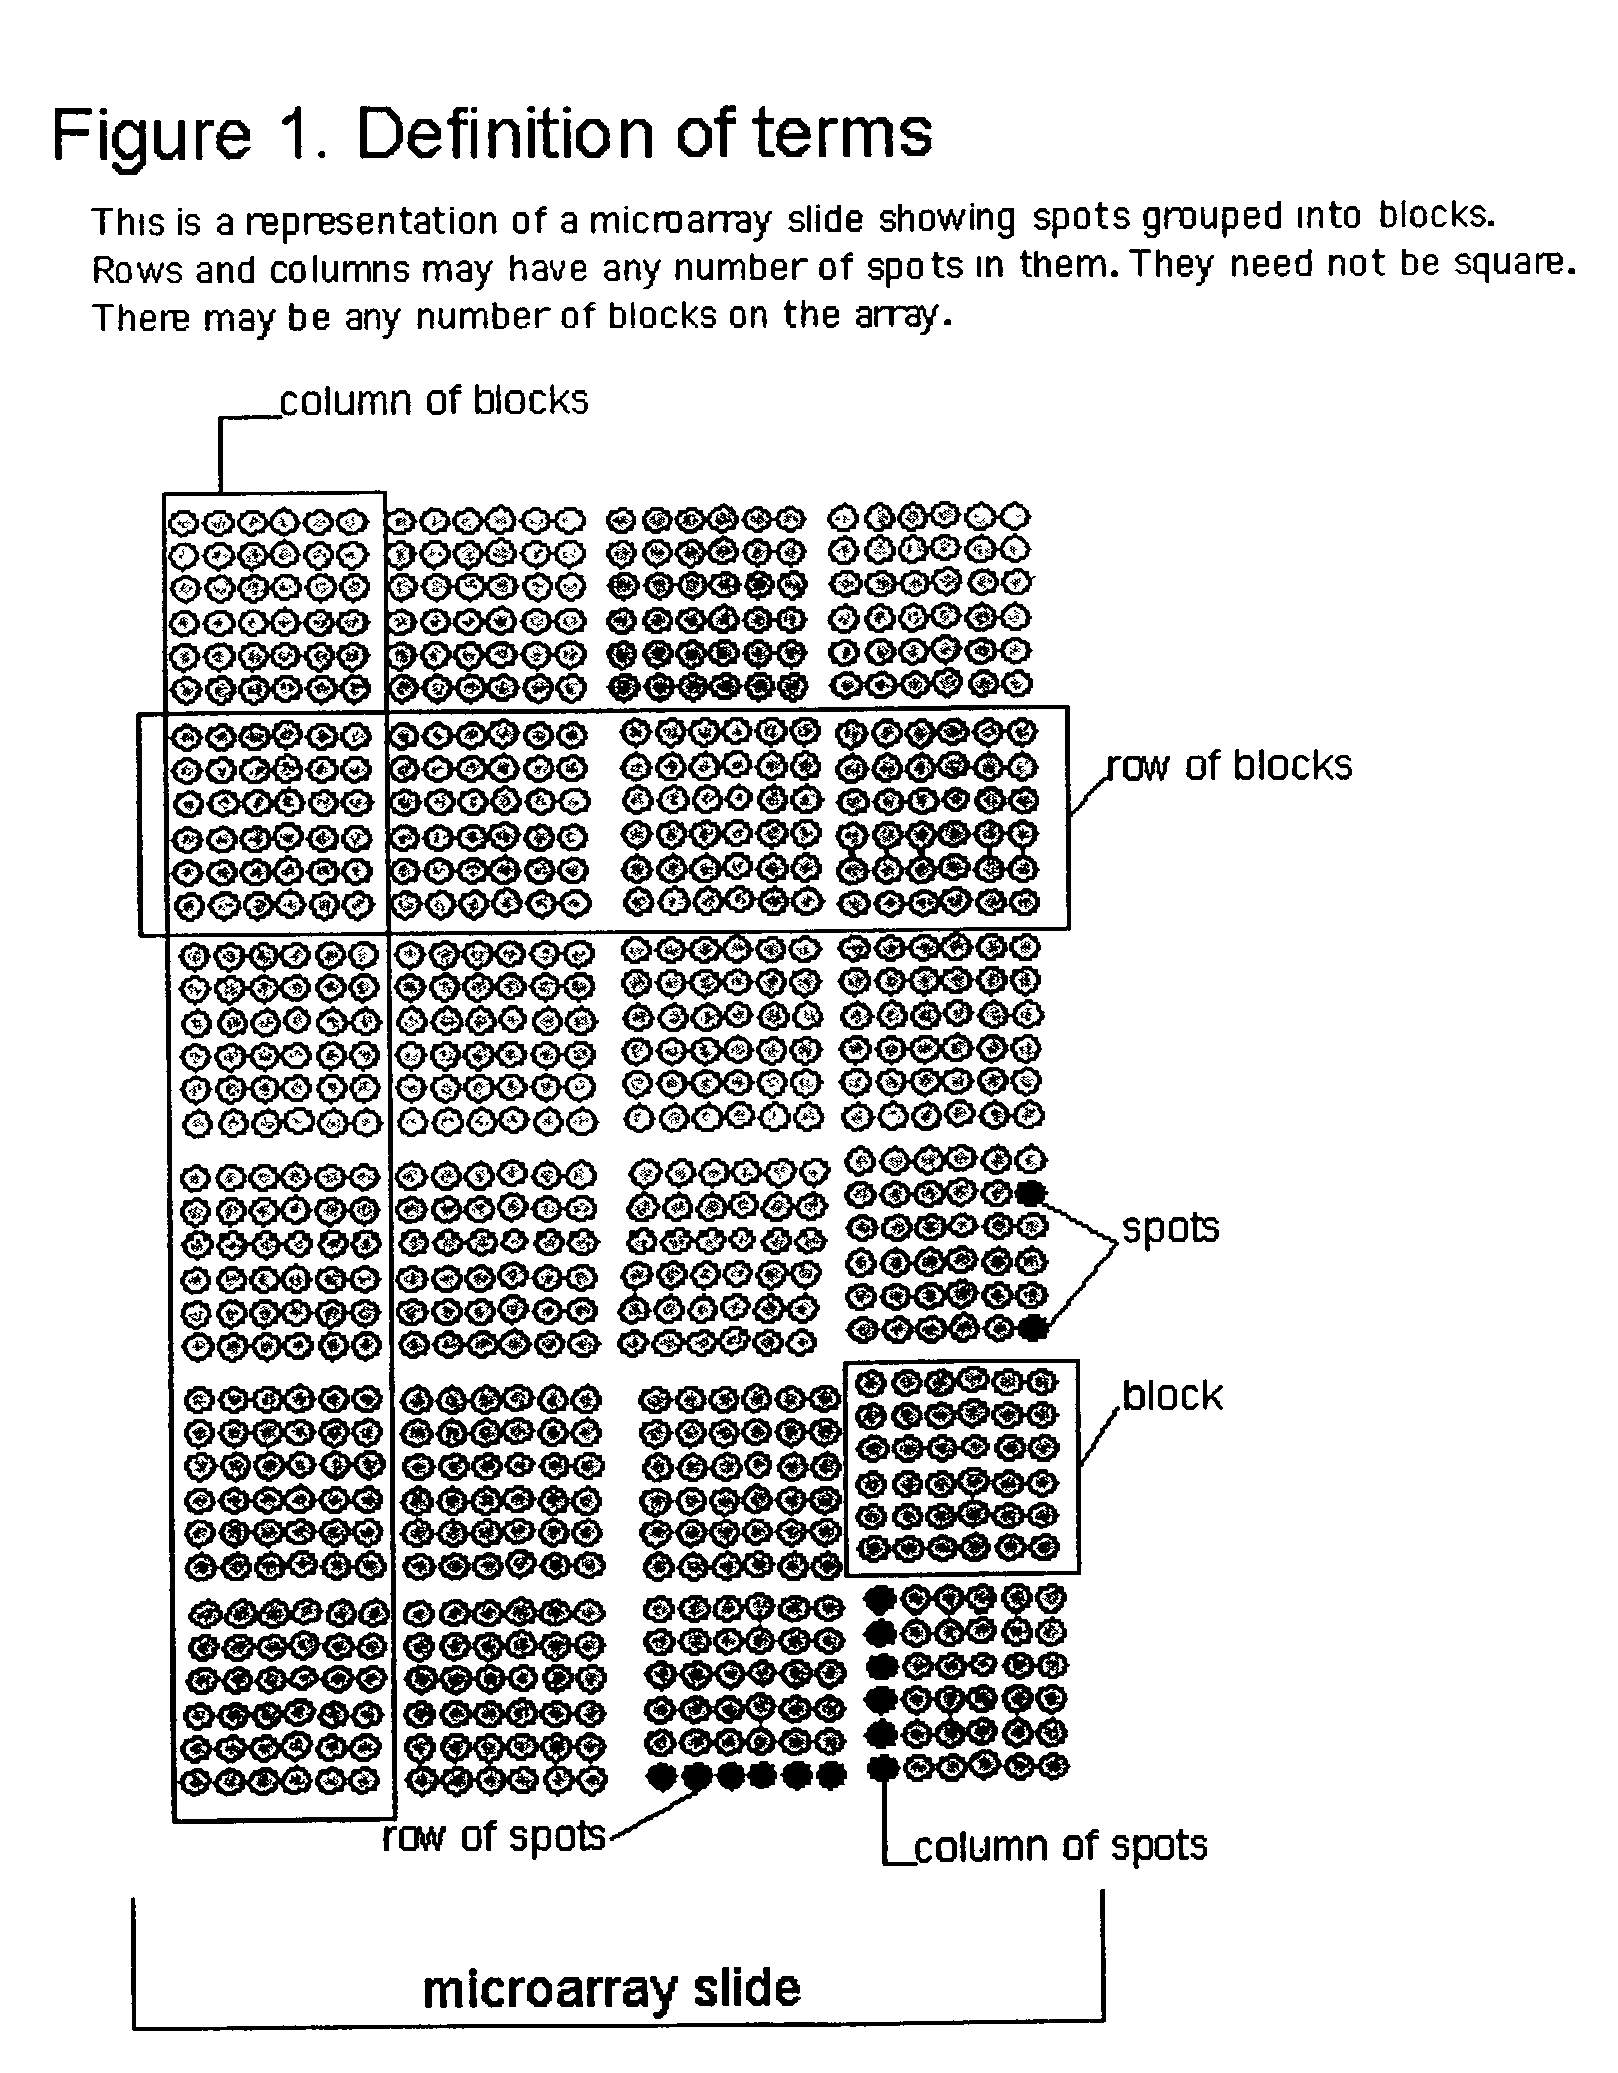
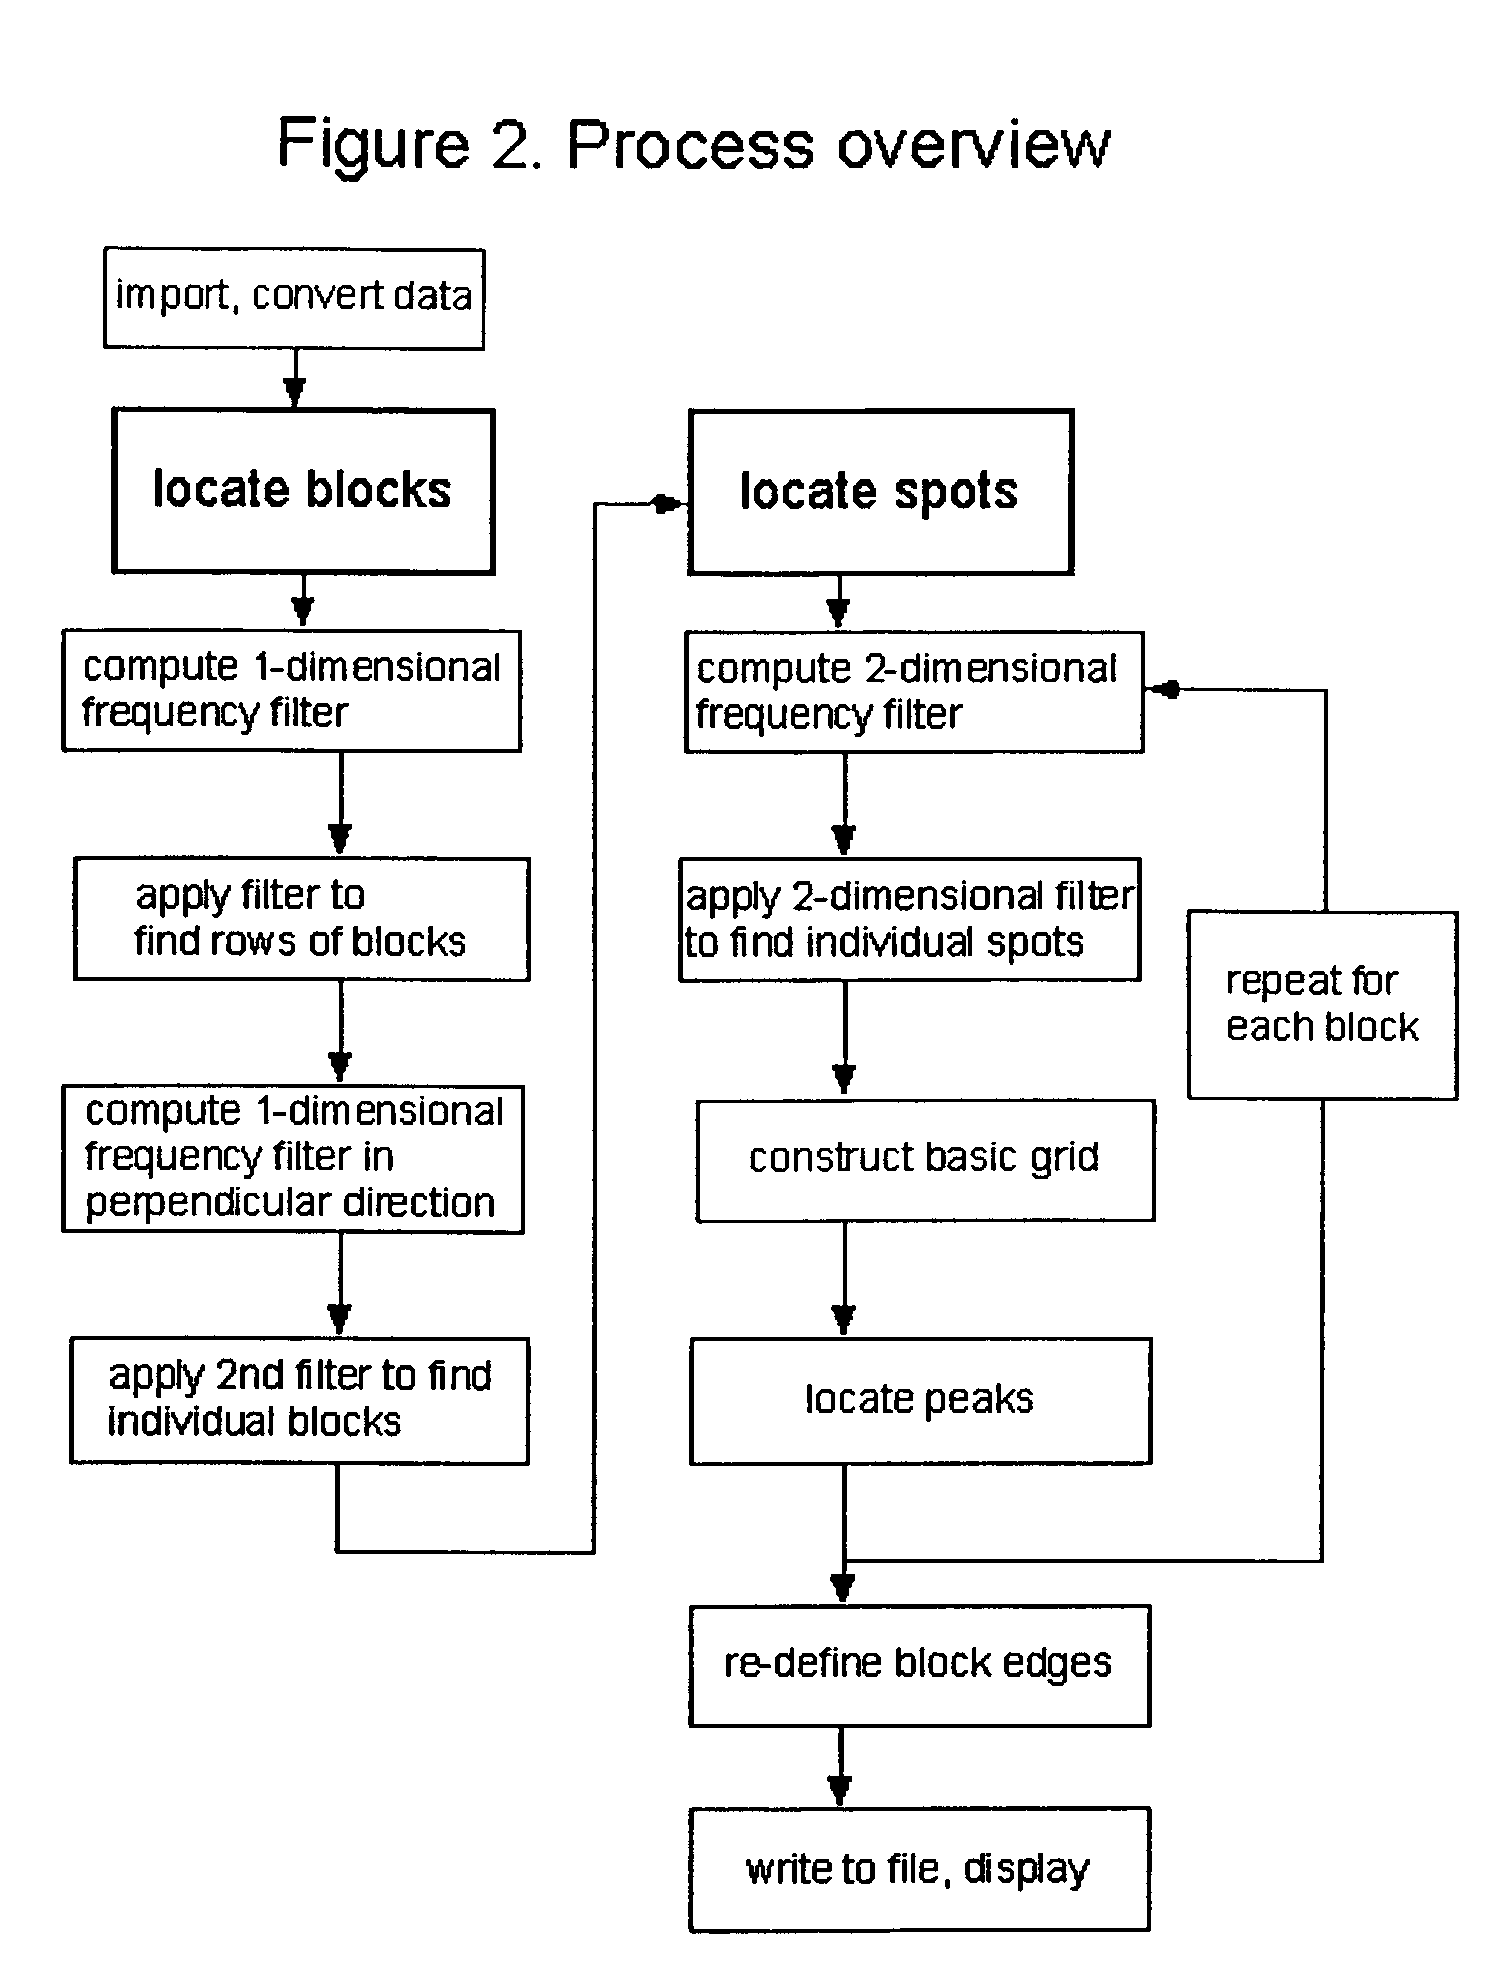
[0010]According to the present invention, techniques for processing images of biological microarrays are provided. More particularly, the invention provides one or more methods for identifying areas on images of a mechanically printed or otherwise generated array of spots which contain data, and those which are background areas. Merely by way of example the invention is applied to captured digital images of DNA microarrays which contain spots of active regions of biological material, which may be treated or otherwise, situated within an area of background on the substrate of the microarray. But it would be recognized that the invention has much broader range of applicability to analyze digital images of any type of molecular or cellular array utilized in any type of biological or chemical assay.
[0013]In an alternative specific embodiment, the invention provides a method for processing data in digital images of biological microarrays to identify one or more groupings of spots present in the microarray image. The method receives a captured image of a biological microarray of spots in an electronic format. The array itself, which is the source of the image, in most cases is composed of a plurality of groupings of spots. The groupings may be defined by 1 through N, where N is an integer greater than 1, and each of the groupings is separated by an isolation region, which is substantially free from any spots. The method processes the captured electronic image to reduce background noise. A step of identifying at least the isolation region between the groupings in the captured image using a filter applied to the captured image is included. The filter is described according to periodic components of the captured image, where the periodic components are defined by a spatial distribution of the spots in the array image. The method determines the boundaries of each grouping in the digital image of the biological microarray to isolate any one of the groupings from any one of the other groupings, and stores the locations of each grouping in the image of the biological microarray into memory.
[0019]Further, to reduce the effect of background fluorescence (“noise”), the invention uses the Principal Frequency Filter, or PFF, as will be referenced herein. Briefly, this filter is defined from the digital image of the microarray by calculating a one-dimensional Fourier transformation and deriving from it the power spectrum of each row of pixels. Preferably, spectra are averaged across all rows of pixels in the image, and all peaks that occur in a small neighborhood of defined width are located. The first local peak away from zero frequency is the Principal Frequency, which is the spatial frequency determined by the repeating spot pattern. Random, non-periodic background or noise is spread out in the Fourier domain; periodic signals are concentrated into the Principal Frequency, with little contamination of this frequency by noisy nonperiodic signals. Utilizing Fourier transformation thus separates the pattern of important signals from spurious background signals. An intensity profile is determined from the power spectra of individual rows of pixels in a small neighborhood of the Principal Frequency, which eliminates the contributions of non-periodic background. The Principal Frequency intensity profile is then smoothed by a value of 1.5 times the estimated row spacing to reduce further the impact of noise and interspot spacing on the profile. Thresholding of the filtered intensity profile identifies locations of block edges along the long dimension of the array.
[0024]Numerous benefits are achieved using the present invention over conventional techniques. In a specific embodiment, the invention can be implemented using conventional hardware and / or software technologies. Additionally, the invention provides for reduced manual operation by a user. The invention can reduce processing time required by conventional microarray data analysis techniques by a significant factor, depending on the skill of the practitioner and the quality of the printed microarray. Importantly, use of the invention results in greatly increased accuracy of the data grid, leading to improvements in the accuracy and quality of experimental data from microarray assays. This in turn leads to reduced need for replicate experiments and thus provides savings in both time and materials costs. The invention makes possible the batch processing of data from multiple microarray slides with little user input required, allowing for greater automation of the entire process, with ensuing cost and time savings. These and other benefits are described throughout the present specification and more particularly below. Depending upon the embodiment, there may be one or more or none of these benefits.

Problems solved by technology

Often, this information is difficult to obtain or is slightly (or considerably) inaccurate, and may even be variable within a single microarray image.
Grids made in this way are created as perfectly spaced and perfectly aligned circles, without reference to the actual image being analyzed, which makes them limiting.
Other limitations also exist.
The manufacture of spotted arrays, however, does not produce perfect rectilinear arrays.
However, irregularities in the grid of DNA spots occur due to many factors, including variations in the size and thickness of the glass slides, minute differences in the distances between pins or capillaries in the set, minute differences in the bore size among the set of capillaries or diameter among the set of pins, variable precision of the distances traveled by the set of pins or capillaries when moving from one slide to another, and inconsistency of DNA concentration and thus viscosity among the thousands of DNA samples.
Further irregularity in the arrangement of spots on the array can occur when the robot stops periodically during the printing run for replacement of the multiwell DNA plate or for other types of instrument maintenance.
When multiplied over tens of thousands of spots, even minuscule variation results in DNA arrays which are not perfectly rectilinear.
Even the best spotted arrays contain irregularities that make creation of the data analysis grid a challenge.
Furthermore, within the area of a given spot, there are often irregularities in the fluorescence intensity of pixels, leading to variation in the shape of spots on the array.
These spots may still provide valid hybridization information, but because spot positions are not aligned with a simple grid, such data are often lost.
This adjustment process, which must be done before any analysis can be carried out, is quite time-consuming and cumbersome, and often leads to inaccuracy, as the user tires of the tedious process of adjusting the positions of hundreds or thousands of individual spots on a grid.
This technique, however, often leads to large misinterpretation of images of arrays containing areas of weak or absent signals, misalignments, or high background fluorescence.
With bright spots, large features and widely separated spots, this method works fairly well, but spots on images of arrays or parts of arrays with irregular features are not accurately located and require considerable user manipulation.
This method begins with a “target mask” inferred from landmark signals placed into the potential target area, and thus it suffers from the same limitations as described for other methods which use simple mathematical grids and statistical methods.
This method makes easier the task of locating spots by suggesting row and column spacing values, but individual spots are frequently misaligned and low-signal spots are often missed altogether.
The method can be made to work by expert users but is cumbersome and often unsuccessful when operated by less highly trained personnel.
In all of these programs, default values may be used to carry out data analysis “automatically,” but in reality, accuracy is poor if the many specific parameters of each array are not accurately entered.
Unfortunately, in practice, all of such techniques usually require considerable manual inspection and adjustment in order to align each and every spot on the demarcation grid with the actual spots on the image.

Method used


Image

  • Method, system, and computer code for finding spots defined in biological microarrays
  • Method, system, and computer code for finding spots defined in biological microarrays
  • Method, system, and computer code for finding spots defined in biological microarrays

Examples


Embodiment Construction

[0032]According to the present invention, techniques for processing of biological microarrays are provided. More particularly, the invention provides one or more methods for identifying areas on images of a mechanically printed or otherwise generated array of spots which contain data, and those which are background areas. Merely by way of example the invention is applied to images of spots making up DNA microarrays. Such spots on the DNA microarray itself contain active regions of immobilized nucleic acids, which may be treated or otherwise, located within inactive areas, or background regions. But it would be recognized that the methods of the invention are useful for the analysis of digitized images from any type of readout signal generated from arrays of any class of molecules, cells, or tissues in which there are areas of data and of background, and where data-containing areas lie in an approximately regular grid. Data from arrays of other classes of nucleic acids, of proteins, ...


PUM


Abstract

A method (and system) for using information contained within the scanned image to create, in an automated (or semi-automated) process, an accurate data grid. The process has steps: enhance the image; locate blocks of spots; and find each individual spot in each of the blocks. Preferably, the method makes use of image filtering using a“Principal Frequency Filter” based on a mathematical determination of major periodic elements in the image to eliminate noisy, non-periodic signals, and of smoothed intensity profiles of the filtered image data. Here, the term Principal Frequency Filter is used to indicate an image-enhancing filter based upon a mathematical operation which identifies the major periodic components of the image.

Description

BACKGROUND OF THE INVENTION[0001]The present invention relates generally to processing techniques for data from biological microarrays. More particularly, the invention provides one or more methods for identifying areas on images of a mechanically printed or otherwise generated array of spots which contain data, and those which are background areas. Merely by way of example, the invention is applied to processing images of DNA microarrays to distinguish and demarcate the data-containing areas known as spots from the background areas. But it would be recognized that the invention has much broader range of applicability including analysis of images of arrays of any kind in which data-containing areas lie in an approximately regular pattern on a background.[0002]Microarray technology has been developed over the past few years to allow scientists to test large numbers of genes, proteins, or other molecules for hybridization or binding to molecules in a test mixture (see, for example, De...

Claims


Application Information

Patent Timeline
IPC IPC(8): G06K9/00G06T7/00
CPCG06K9/00G06T7/0044G06K2209/07G06T2207/30072G06T7/74G06V2201/04
Inventor NILES, RICHARD K.MARTENS, CHRISTINE L.FOSKETT, DARACH B.
Owner NILES SCI
Learn More