
Eureka
For R&D, Eureka makes reading and utilizing patents & technical documents easy.
Eureka AIR
Designed for self-driven R&D workflows. Generate viable solutions, solve complex R&D challenges, empower your innovation with AI.

Eureka Materials
Designed for material experts only. Revolutionize your material R&D, from search, analyze, to developing new materials.

TechResearch
Generate reliable direction feasibility study reports for your R&D in just a few steps.

TechSeek
Discover and master advanced knowledge NOW. Basics, ideas, possibilities, all at once.

TechMind
As an expert in R&D Theories, TechMind can generates customized viable solutions instantly.

TechRisk
Analyze your overall solution with one click, know your potential R&D risks in advance.

TechMonitor
Get weekly tech updates, stay abreast of the latest tech innovations and key insights.
Carbon monoxide sensor and method of use thereof
- Summary
- Abstract
- Description
- Claims
- Application Information
AI Technical Summary
Benefits of technology
Problems solved by technology
Method used
Image

Examples
example 1
Sensor Fabrication
[0045]A silicon substrate was first cleaned in a solution of 200 mls H2SO4 and 85 ml H2O2s. After rinsing, the substrate was dipped for 10 seconds in a solution of 200 ml H2O and 20 ml HF and then rinsed again. The cleaned substrate was then air dried and oxidized for 420 minutes at 1050° C. to provide a thick layer of oxidized material, approximately 5000 Å in thickness.
[0046]Next, the oxide layer was removed from the back of the substrate and from selected regions of the upper surface using a standard 4330 photoresist developed in MF319. The patterned substrate was then oxidized for an additional 45 minutes to provide a thin layer of oxidation at the bottom of the patterned areas.
[0047]Once patterned and oxidized, the substrate was placed in a thermal evaporator and a gate metal layer of Pd, approximately 200 nm thick, was deposited over the entire upper surface of the substrate. In order to remove the gate metal coating from undesired areas of the substrate, i.e...
example 2
Flow Cell Testing Conditions and Apparatus
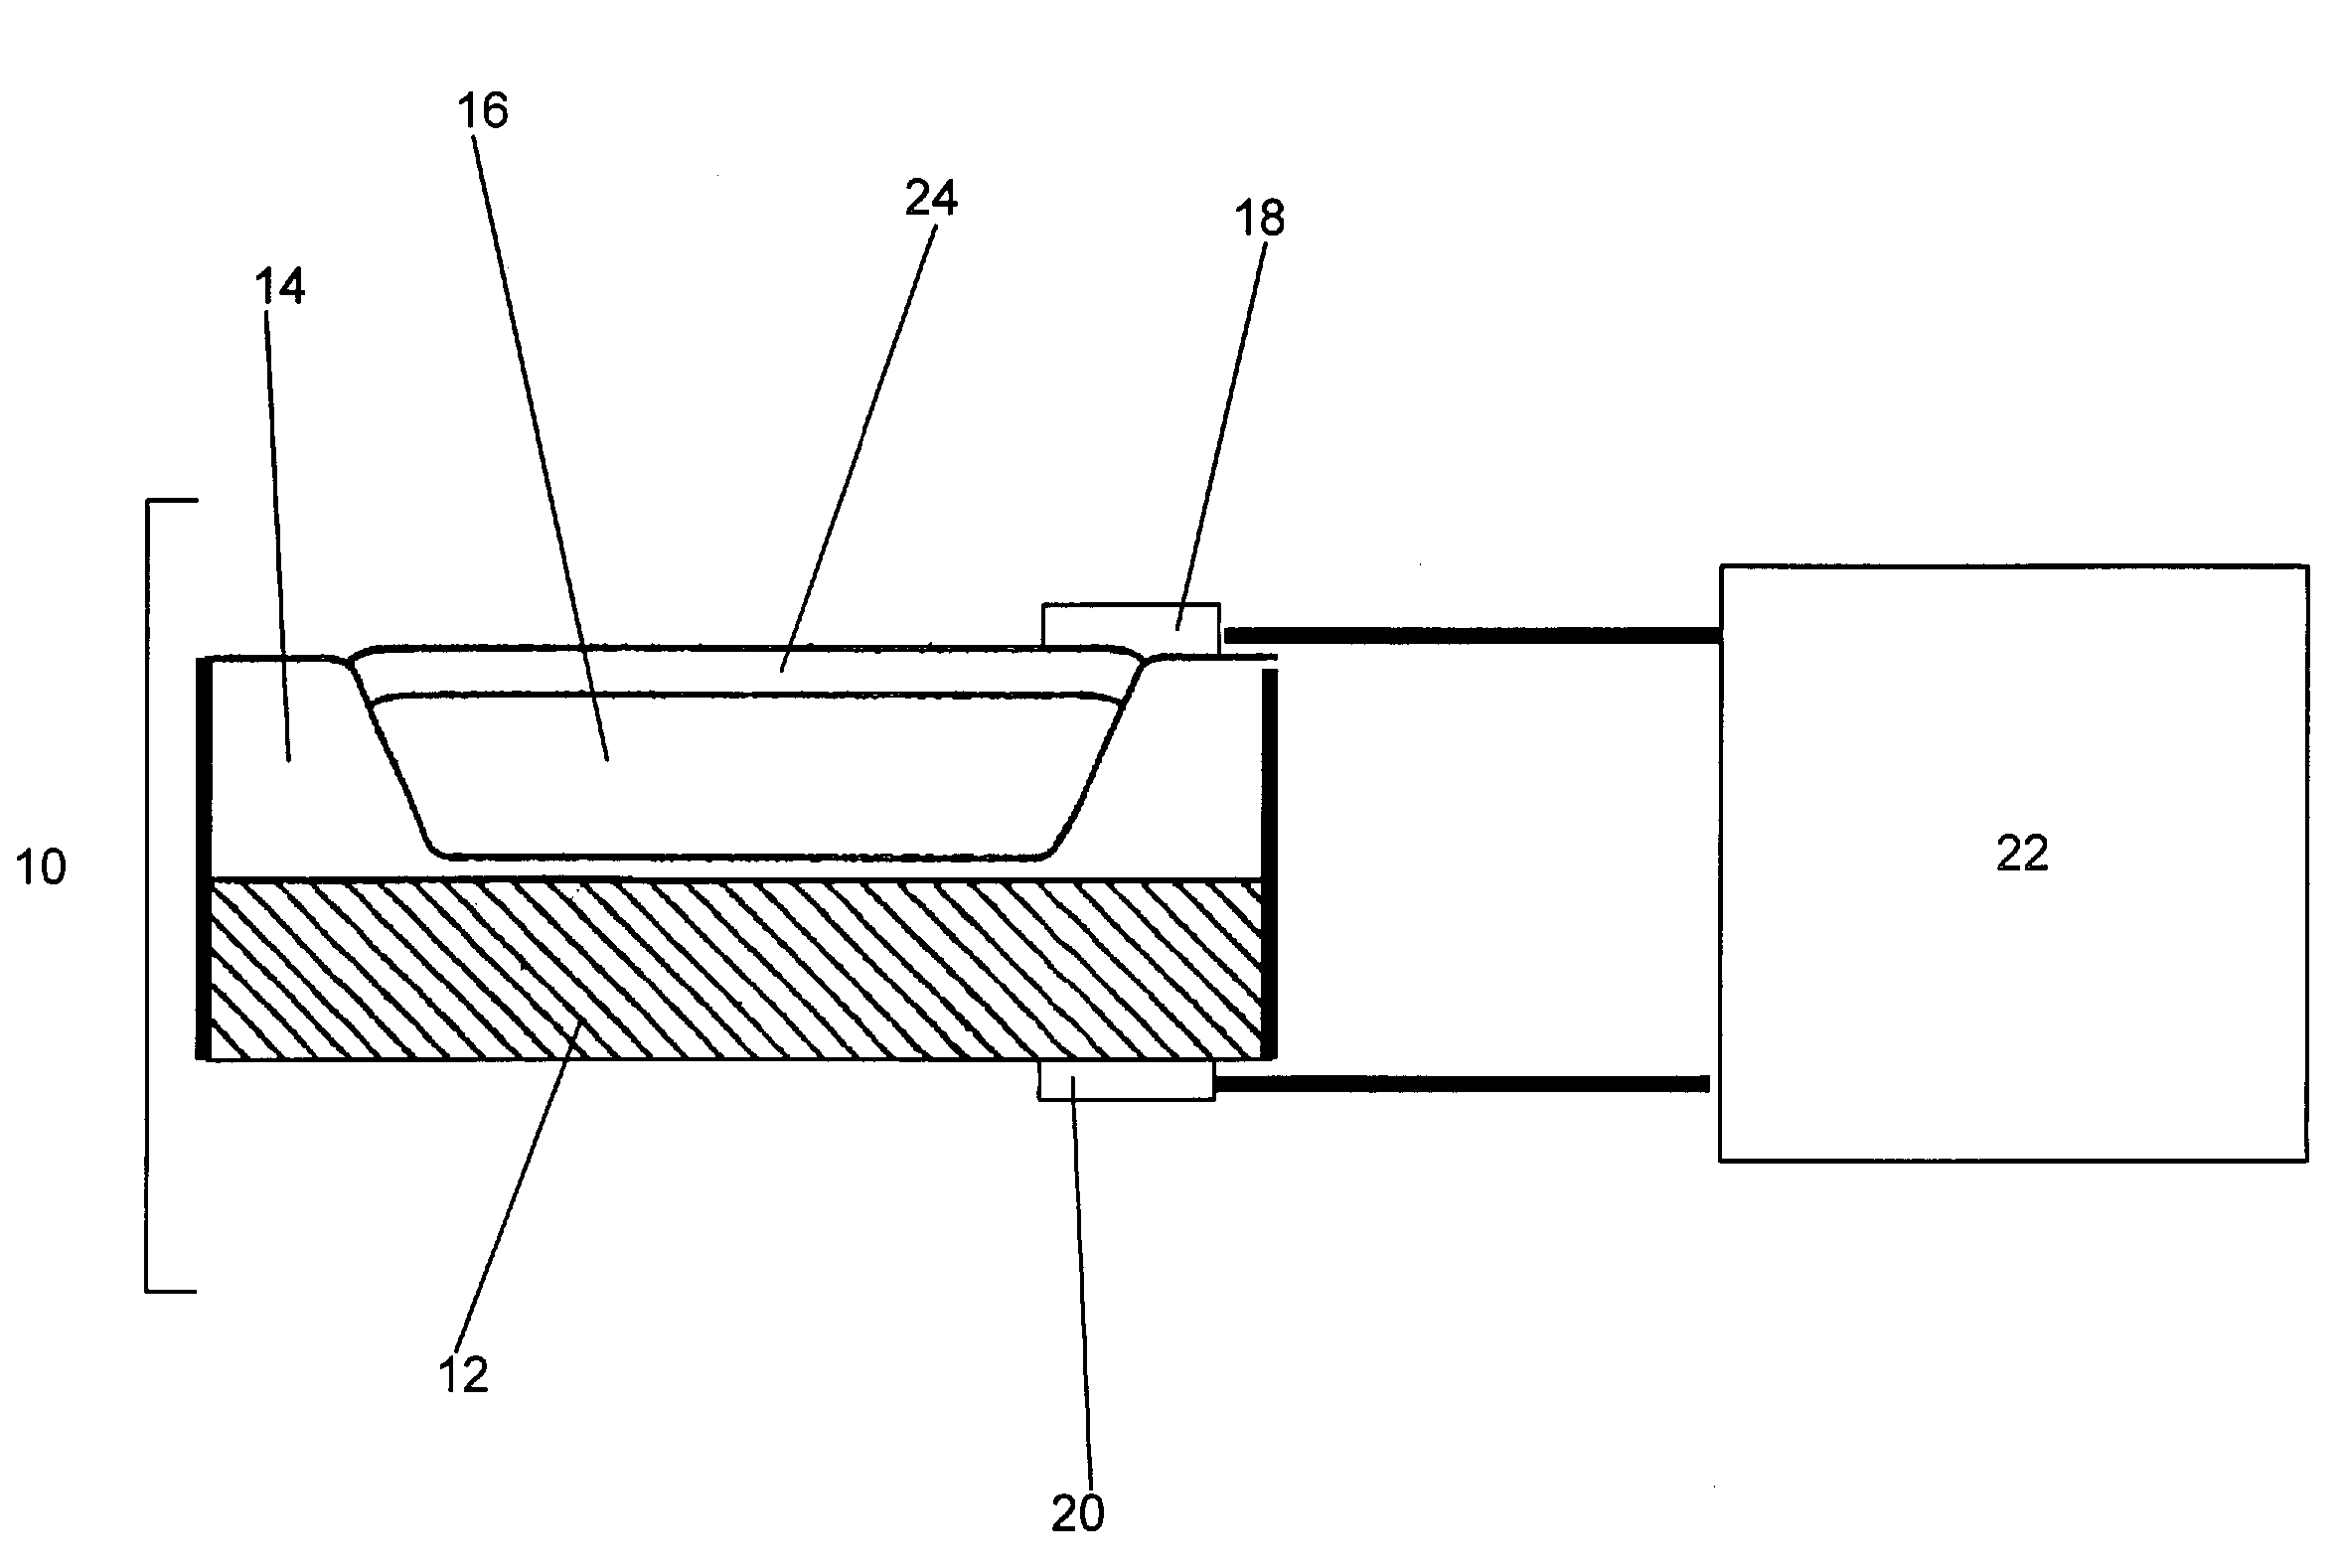
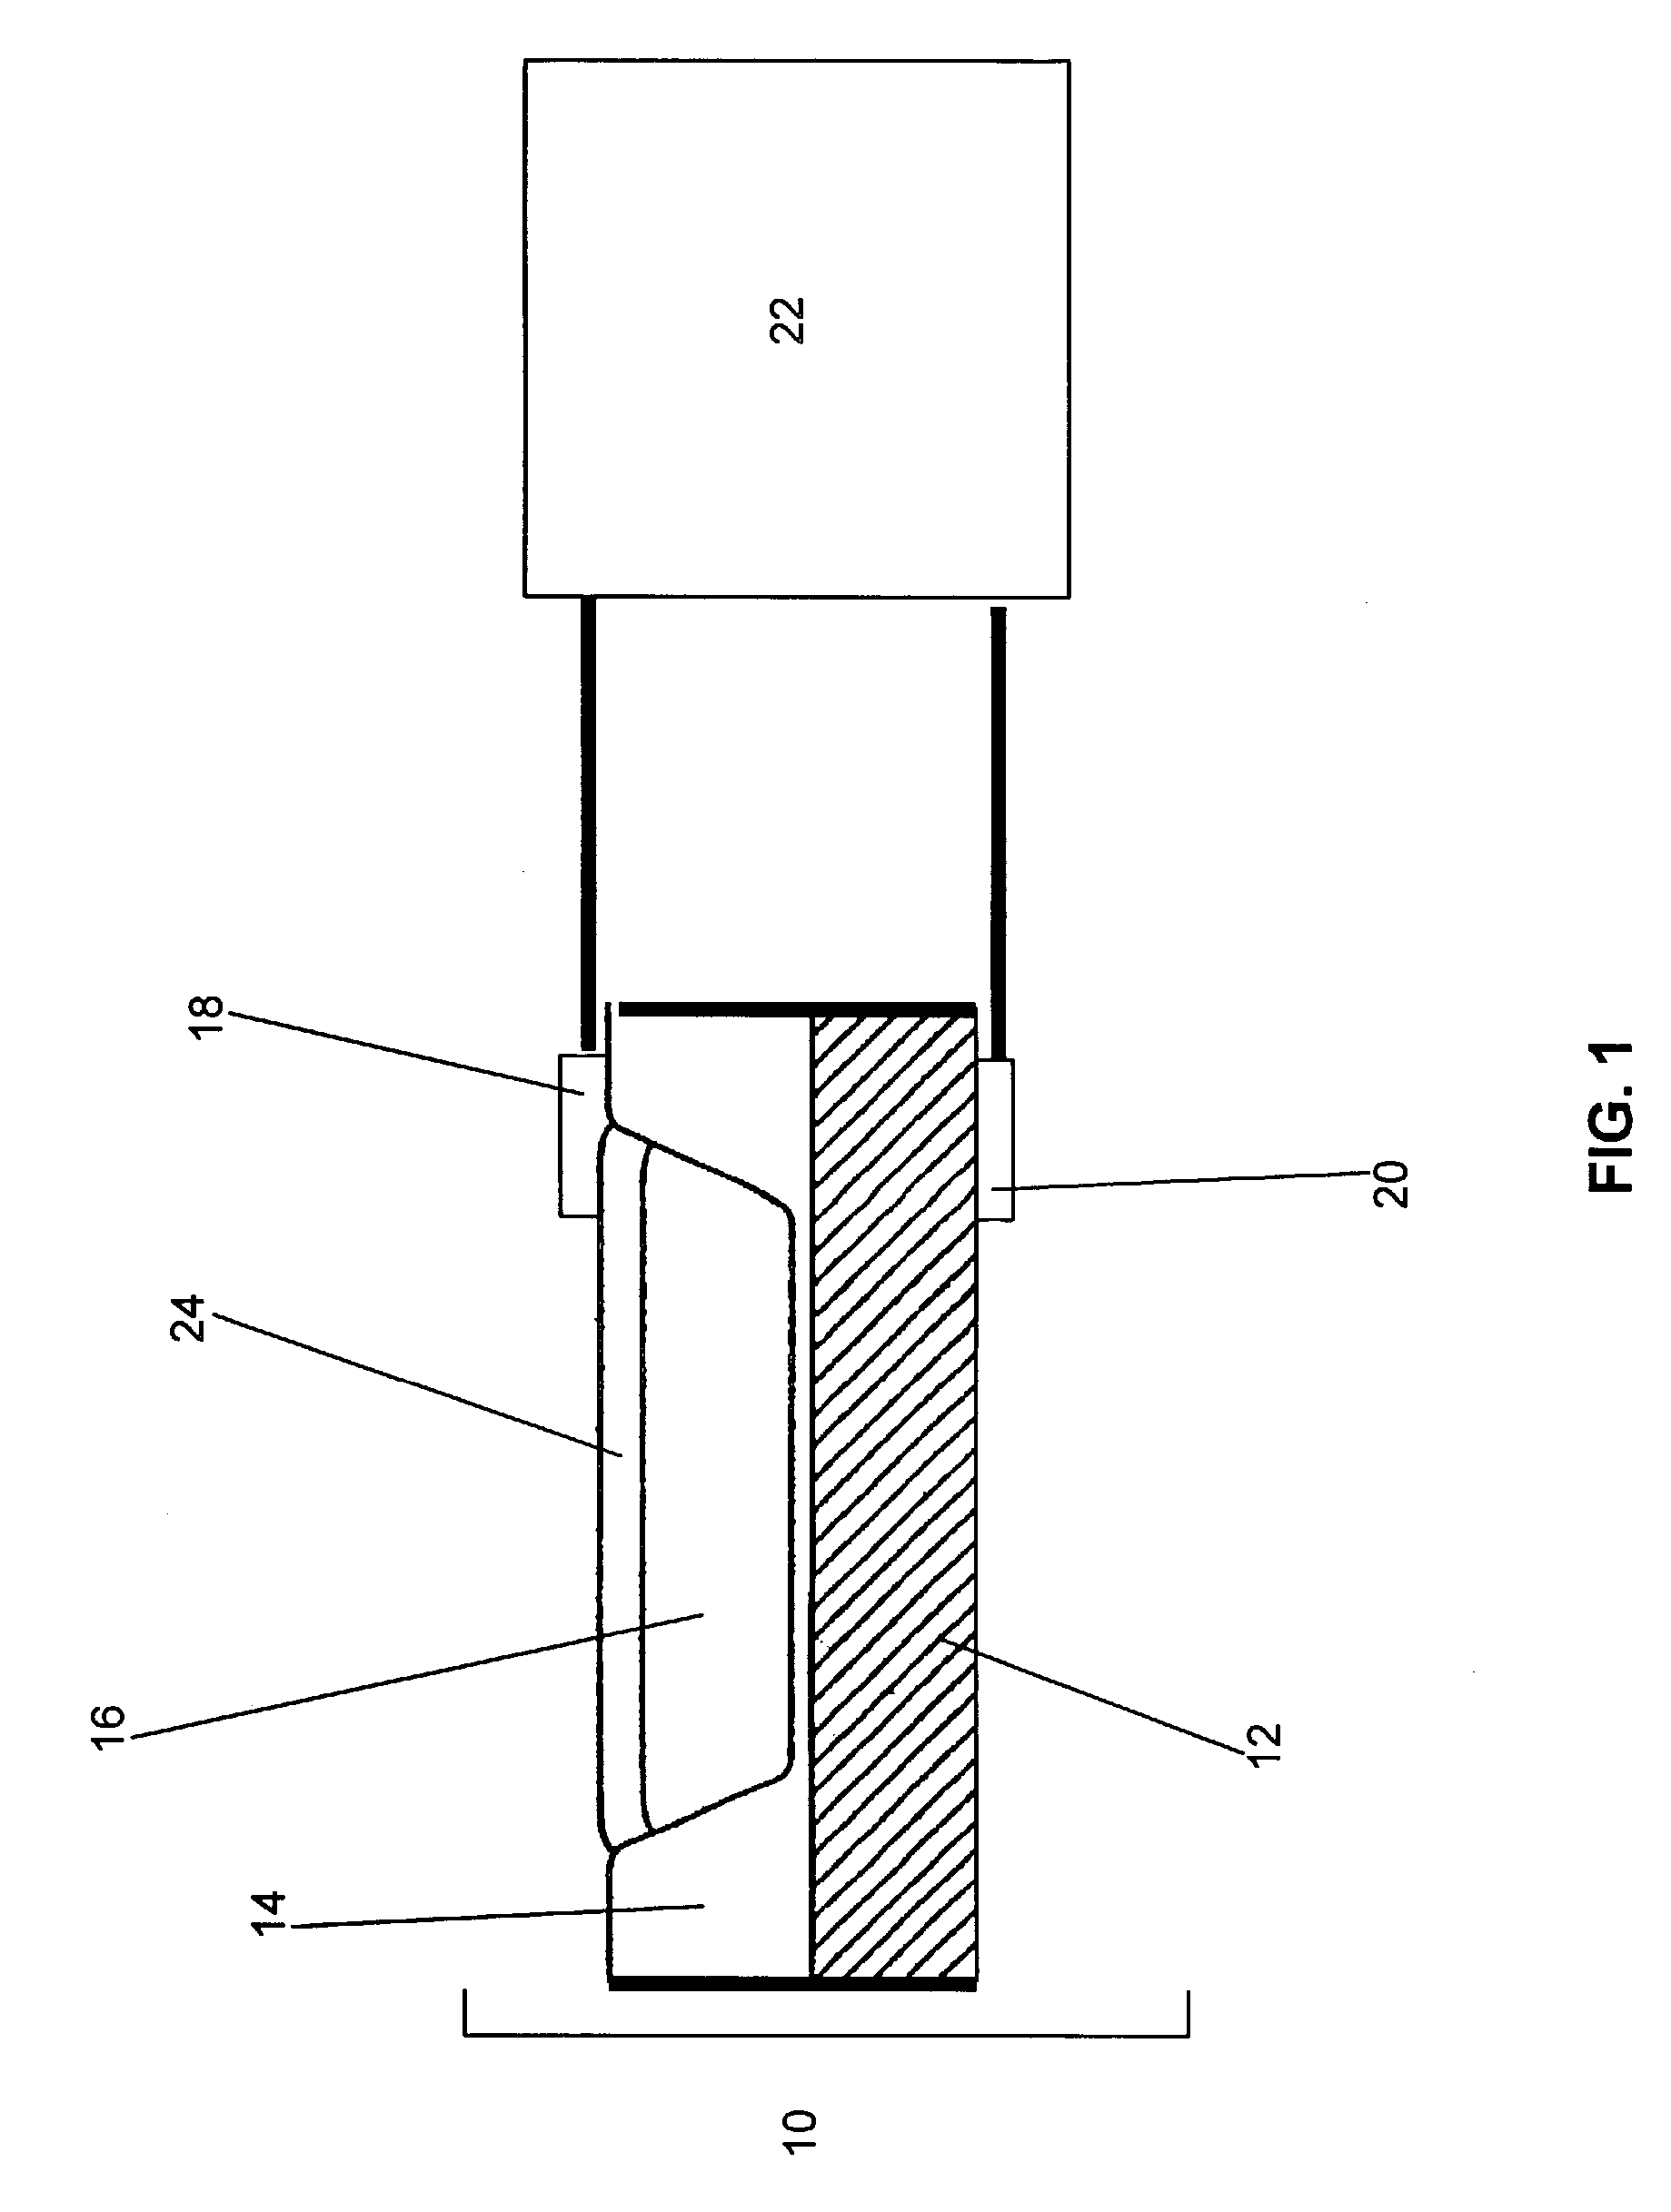
[0052]Prior to testing, each capacitor was mounted on a sample holder for insertion into a gas flow cell. Electrical leads were attached to the capacitor base and sensor bonding pads attached to the Pd layer. The resulting sensor was then heated resistively on a conductive pedestal, and the sample temperature was measured by a thermocouple spot-welded to the heater body.
[0053]During flow cell testing, shifts in the C-V curve of the sensor were monitored using a computer-based control algorithm that measured the voltage shift (response) required to maintain a constant capacitance value at a point of maximum slope along the C-V curve. The noise level for measurements made via this method was less than 2 mV. Exposure of the sensor to hydrogen gas caused the C-V curve to shift toward lower bias voltages, as shown in FIG. 3. In order for increasing hydrogen to correspond to increasing signal strength, the sign of the measured response was reverse...
example 3
Flow Cell Testing: Type 1 Sensors
[0056]In a series of experiments, the effect of co-fed carbon monoxide on the hydrogen response of Type 1 sensors was examined by the sequential introduction of streams containing hydrogen and carbon monoxide into the flow cell at 100° C.; PH2=500 mTorr, PCO=500 mTorr. Results from a representative experiment are shown in FIG. 4. A large sensor response was observed almost immediately after addition of hydrogen into the flow cell. This rapid response to hydrogen was typical of all sensors investigated. After allowing the hydrogen response to equilibrate, a stream containing carbon monoxide was introduced into the flow cell. As shown in FIG. 4, the addition of carbon monoxide resulted in a substantial increase in the sensor response signal. The time required for this increase in response varied between different sensors tested and this variation may be attributable to different levels of contamination on the surface of the sensor.
[0057]After allowing ...
PUM
| Property | Measurement | Unit |
|---|---|---|
| Temperature | aaaaa | aaaaa |
| Temperature | aaaaa | aaaaa |
| Fraction | aaaaa | aaaaa |
Abstract
Description
Claims
Application Information
 - R&D Engineer
- R&D Manager
- IP Professional
- Industry Leading Data Capabilities
- Powerful AI technology
- Patent DNA Extraction
Browse by: Latest US Patents, China's latest patents, Technical Efficacy Thesaurus, Application Domain, Technology Topic, Popular Technical Reports.
© 2024 PatSnap. All rights reserved.Legal|Privacy policy|Modern Slavery Act Transparency Statement|Sitemap|About US| Contact US: help@patsnap.com