Benzothiazole lysosome-targeted pH fluorescent probe and preparation and application thereof
A technology of benzothiazoles and fluorescent probes, applied in the field of fluorescent probes, can solve the problems of complex synthesis, small displacement, etc., and achieve the effects of simple synthesis method, high yield, and reducing the interference of excitation light.
- Summary
- Abstract
- Description
- Claims
- Application Information
AI Technical Summary
Problems solved by technology
Method used
Image
Examples
Embodiment 1
[0025] The synthesis of 2-(quinoline-4-vinyl)benzothiazole (QVBT) is as follows:
[0026]
[0027] In a sealed tube, quinoline-4-carbaldehyde (0.471 g, 3 mmol), 2-methylbenzothiazole (382 μL, 3 mmol) and trimethylchlorosilane (TMSCl, 3.8 μL, 30 mmol) were mixed in a molar ratio of 1: Dissolve in dimethylformamide at a ratio of 1:10, in which TMSCl is the catalyst, stir and heat at 100°C for 16 hours, and filter the precipitate after cooling. The precipitate was dissolved with dichloromethane and washed with NaCO 3 The pH of the solution was adjusted to 8.0, and stirred for 30 min, then extracted 3 times with dichloromethane containing saturated sodium chloride, the organic phases were combined, and washed with anhydrous MgSO 4 After drying, the organic solution was distilled under reduced pressure, and finally recrystallized with dichloromethane to obtain 0.78 g of a brown solid with a yield of 90%. 1 HNMR (DMSO-d 6 ,300MHz),δ(ppm)7.39(m,3H),7.48(d,3H),7.66(d,2H),7.73(t,...
Embodiment 2
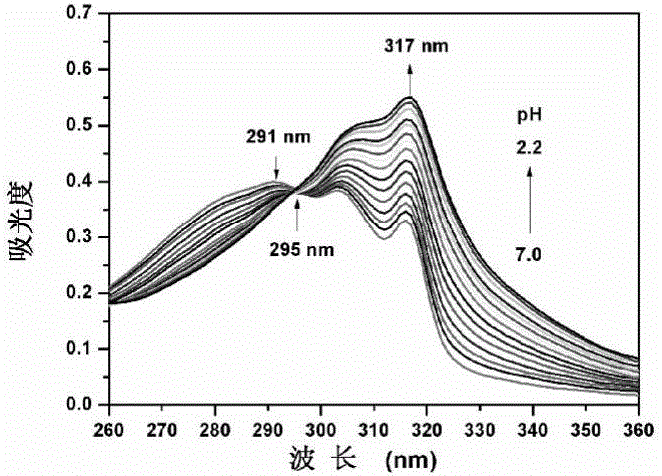
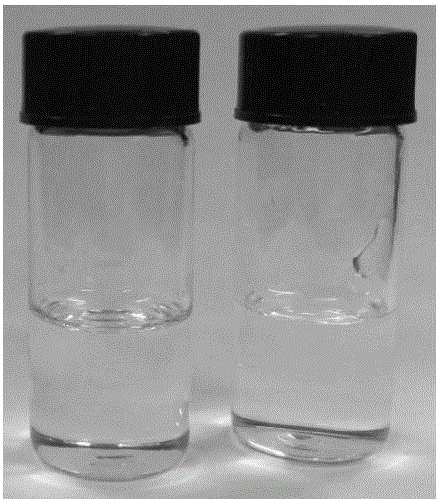
[0029] The probe QVBT in Example 1 was stored in absolute ethanol to prepare a stock solution with a concentration of 1 mM. In the experiment, the probe was diluted with ethanol / water (V / V, 1 / 2) system to a final concentration of 10 μM, and the pH value of the system was adjusted with HCl (0.3M, 0.6M and 1.0M) and NaOH (0.4M). Record the UV absorption spectrum of QVBT changing with pH ( figure 1 ). With the decrease of pH value, the absorption peak at 291nm decreased successively, the absorption peak at 317nm gradually increased, and an obvious isoabsorptive point appeared near 295nm. At the same time, the color of the solution changed from light yellow to colorless ( figure 2 ).
Embodiment 3
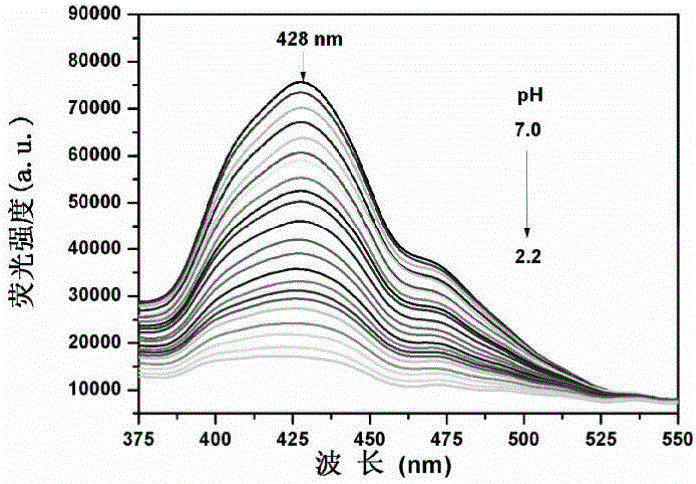
[0031] Also use ethanol / water (V / V, 1 / 2) system to dilute the probe QVBT to a final concentration of 10 μM, adjust the pH value of the system with HCl (0.3M, 0.6Mand 1.0M) and NaOH (0.4M), fix The excitation wavelength was 317nm, and the fluorescence emission spectrum changes of QVBT with pH changes were recorded ( image 3 ). With the decrease of pH value, the fluorescence intensity at 428nm decreased gradually. Under the irradiation of ultraviolet light, the color of the solution changed from blue to colorless ( Figure 4 ). Calculate pK according to the Singmoidal fitting curve of the fluorescence intensity value of QVBT at 428 nm as a function of pH a The value is 3.52 ( Figure 5 ), the pH response linear range is 3.0-3.8. The linear regression equation is I=44869.25×pH-114030.27, the linear coefficient R 2 = 0.9936.
PUM
 Abstract
Description
Claims
Application Information
 - R&D
- Intellectual Property
- Life Sciences
- Materials
- Tech Scout
- Unparalleled Data Quality
- Higher Quality Content
- 60% Fewer Hallucinations
Browse by: Latest US Patents, China's latest patents, Technical Efficacy Thesaurus, Application Domain, Technology Topic, Popular Technical Reports.
© 2025 PatSnap. All rights reserved.Legal|Privacy policy|Modern Slavery Act Transparency Statement|Sitemap|About US| Contact US: help@patsnap.com


