
A method for detecting fructose in food
A fructose and food technology, applied in the field of food testing, can solve the problems of unstable colored products, harsh operating conditions, expensive instruments and equipment, and achieve the effects of low detection limit, simple instruments and equipment, and low reagent cost
- Summary
- Abstract
- Description
- Claims
- Application Information
AI Technical Summary
Problems solved by technology
Method used
Image

Examples
Embodiment
[0019] A method for detecting fructose in food, the steps are:
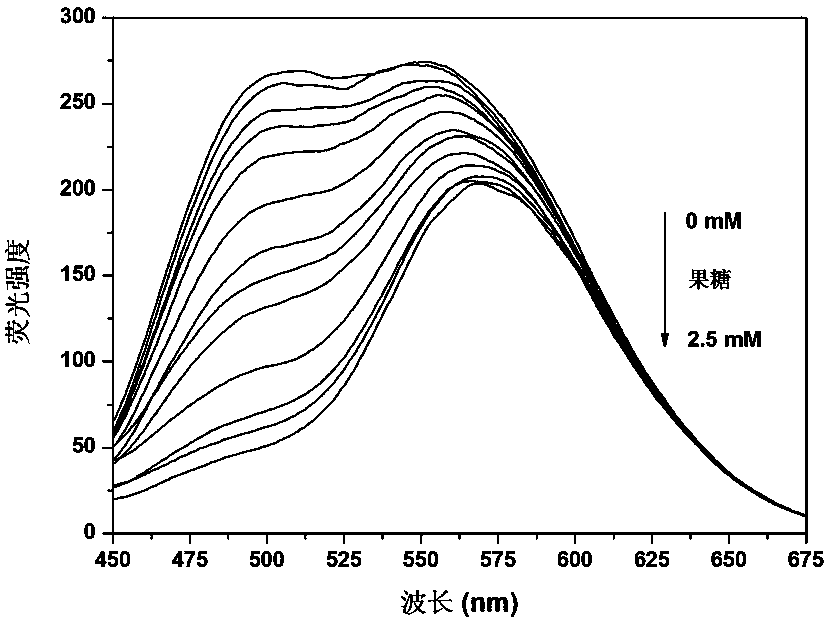
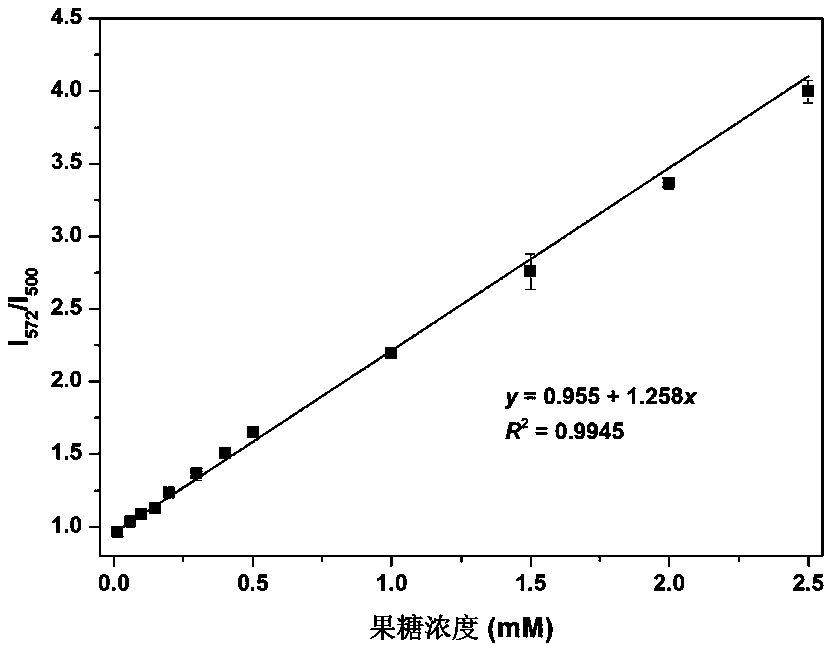
[0020] Mix 0.5 mL of 10-hydroxybenzo[h]quinoline at a concentration of 0.5 mM and 0.5 mL of a stock solution of 3-pyridineboronic acid at a concentration of 0.5 mM with 3.8 mL of a 10 mM phosphate buffer solution at pH = 7.4 in 10 mL After mixing in the centrifuge tube, add 0.2 mL of fructose standard solutions with concentrations of 0, 0.015, 0.060, 0.10, 0.15, 0.20, 0.30, 0.40, 0.50, 1.0, 1.5, 2.0 and 2.5 mM, and then in a 37 °C water bath Incubate for 10 min. Put the prepared standard solution into a fluorescence spectrophotometer to measure the fluorescence spectrum. The parameters set for the fluorescence spectrum are: cuvette: 1.0 cm, excitation wavelength: 380nm, emission wavelength scanning range: 450–675 nm, slit width: 5 / 10nm. Then, the standard curve was drawn with fructose concentration as the abscissa and the ratio of fluorescence intensity at 572 nm to 500 nm as the ordinate.
[0021] Such as f...
experiment example 1
[0023] In response to fructose, glucose, galactose, mannose, sucrose, or maltose, the steps are:
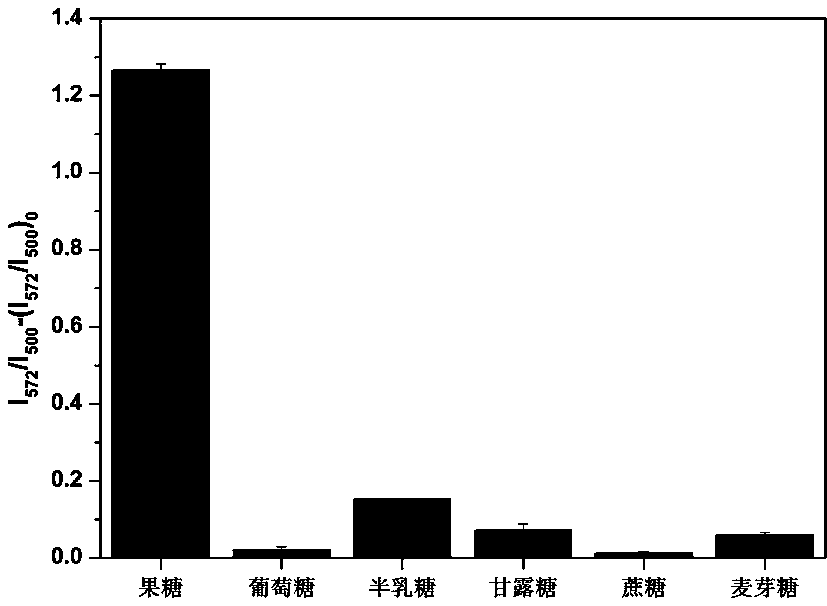
[0024] Mix 0.5 mL of 10-hydroxybenzo[h]quinoline at a concentration of 0.5 mM and 0.5 mL of a stock solution of 3-pyridineboronic acid at a concentration of 0.5 mM with 3.8 mL of a 10 mM phosphate buffer solution at pH = 7.4 in 10 mL After mixing in the centrifuge tube, add 0.2 mL standard solution of fructose, glucose, galactose, mannose, sucrose or maltose with a concentration of 1 mM, and then incubate in a water bath at 37 °C for 10 min. Put the prepared standard solution into a fluorescence spectrophotometer to measure the fluorescence spectrum. The parameters set for the fluorescence spectrum are: cuvette: 1.0 cm, excitation wavelength: 380 nm, emission wavelength scanning range: 450–675 nm, slit width: 5 / 10nm. Then, with the name of the sugar as the abscissa and the increment of the ratio of the fluorescence intensity at 572 nm to 500 nm as the ordinate, draw the response...
experiment example 2
[0027] To detect fructose in honey and beverages, the steps are:
[0028] Honey and beverages were purchased from local supermarkets and diluted with ultrapure water before measurement. Mix 0.5 mL of 10-hydroxybenzo[h]quinoline at a concentration of 0.5 mM and 0.5 mL of a stock solution of 3-pyridineboronic acid at a concentration of 0.5 mM with 3.8 mL of a 10 mM phosphate buffer solution at pH = 7.4 in 10 mL After mixing in the centrifuge tube, add 0.2 mL of the sample and incubate in a 37 °C water bath for 10 min. Put the prepared solution into a fluorescence spectrophotometer to measure the fluorescence spectrum. The parameters set for the fluorescence spectrum are: cuvette: 1.0 cm, excitation wavelength: 380 nm, emission wavelength scanning range: 450–675 nm, slit width: 5 / 10nm. Then, the concentration of fructose in the sample was calculated by combining the measured fluorescence intensity ratio of 572 nm to 500 nm and the linear equation in Example 1.
[0029] Table ...
PUM
 Abstract
Description
Claims
Application Information