Metal element doped CNB photocatalyst and preparation method thereof
A metal element, photocatalyst technology, applied in the field of photocatalysis, can solve the problems of limited application, low catalytic efficiency, low quantum efficiency, etc.
- Summary
- Abstract
- Description
- Claims
- Application Information
AI Technical Summary
Problems solved by technology
Method used
Image
Examples
Embodiment 1~3
[0070] (1) Preparation of boron-doped graphitic carbon nitride (CNB): Weigh 20.000g of urea, put it into a dry and clean small beaker, measure 10mL of distilled water with a graduated cylinder, add it to the small beaker to dissolve it, and then add Accurately weighed sodium tetraphenylborate 5.0mg, when the water bath is heated to 80°C, put the beaker in the water bath to remove the distilled water, after the water in the beaker is evaporated, transfer the sample to a dry and clean crucible, use crucible tongs Move it into a muffle furnace, bake at 550°C for 2 hours, cool to room temperature, and grind to obtain a CNB sample, put it in a sample bag, and seal it, which is CNB.
[0071] (2) Preparation of palladium nitrate solution: 1.000g of palladium nitrate dihydrate powder was dissolved in distilled water, then moved to a 500mL volumetric flask, and prepared into Pd(NO 3 ) 2 solution, the concentration of the solution is C x (The calculation formula is C x V=m / M [二水合硝酸钯...
experiment example 1
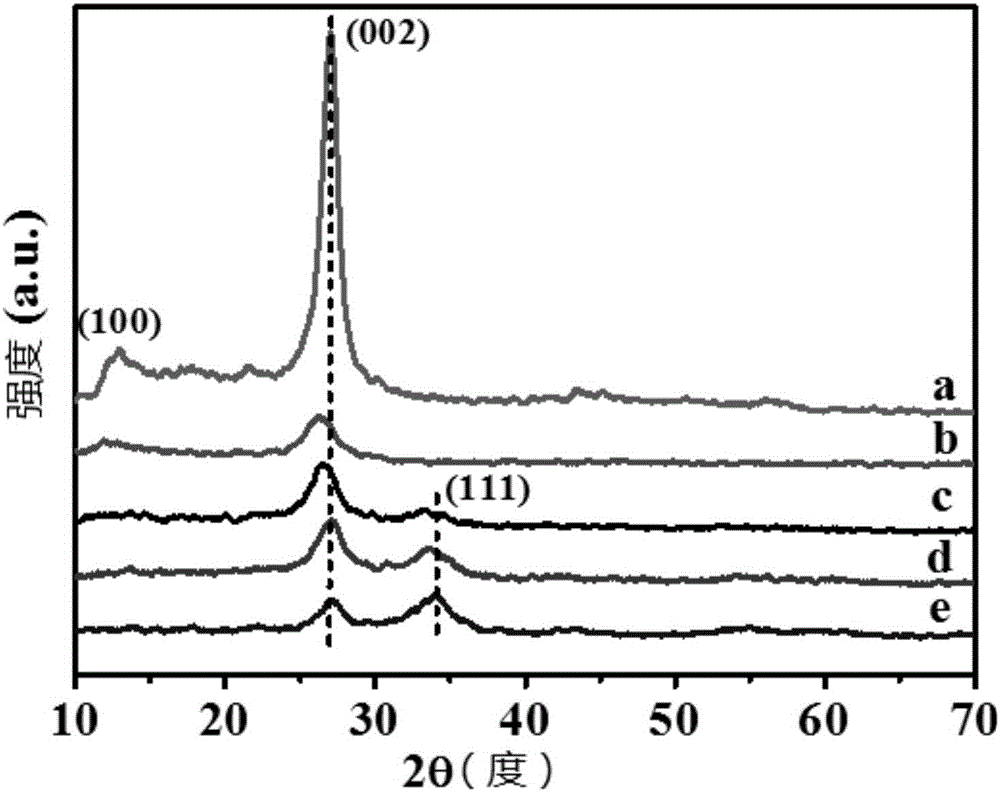
[0081] XRD characterization of experimental example 1 sample
[0082] The samples used in this experimental example were prepared from Examples 1-3 and Comparative Examples 1 and 2.
[0083] This experimental example adopts Bruker D8 Advance X-ray diffractometer (XRD), copper target (Cu Kα (λ=0.154nm)) rays, Ni filter, working voltage 40kV, current 40mA, scanning range 2θ=10°-70 °, analyze the crystal phase structure of the sample, the results are as follows figure 1 As shown, among them,
[0084] Curve a represents the XRD spectral line of the sample prepared in Comparative Example 1;
[0085] Curve b represents the XRD spectrum line of the sample prepared in Comparative Example 2;
[0086] Curve c represents the XRD line of sample that embodiment 3 makes;
[0087] Curve d represents the XRD line of sample that embodiment 1 makes;
[0088] Curve e represents the XRD line of the sample prepared in Example 2.
[0089] Depend on figure 1 It can be seen that the stronges...
experiment example 2
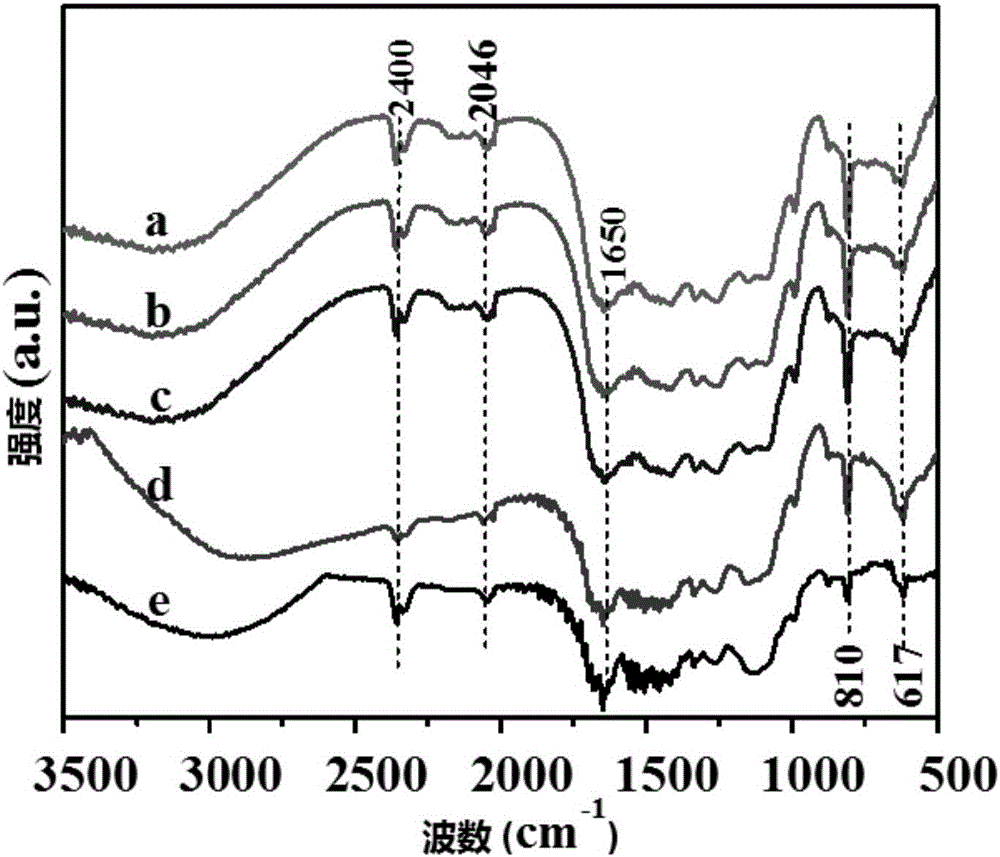
[0093] Infrared spectrum characterization of experimental example 2 sample
[0094] Infrared spectroscopy is used to measure that when a sample is irradiated by infrared light of continuously changing frequency, the molecule absorbs radiation of certain frequencies, and the change of dipole moment is caused by its vibration or bending motion, which causes the energy level to change from the ground state to the excited state. Transition, thus forming molecular absorption spectrum.
[0095] The samples used in this experimental example were prepared from Examples 1-3 and Comparative Examples 1 and 2.
[0096] Take a small amount of the above-mentioned photocatalyst sample, add a small amount of potassium bromide powder respectively, grind until mixed evenly, press into thin slices, and use a Fourier transform infrared spectrometer to carry out infrared spectrum characterization of the catalyst, the results are as follows figure 2 As shown, among them,
[0097] Curve a repre...
PUM
 Abstract
Description
Claims
Application Information
 - R&D
- Intellectual Property
- Life Sciences
- Materials
- Tech Scout
- Unparalleled Data Quality
- Higher Quality Content
- 60% Fewer Hallucinations
Browse by: Latest US Patents, China's latest patents, Technical Efficacy Thesaurus, Application Domain, Technology Topic, Popular Technical Reports.
© 2025 PatSnap. All rights reserved.Legal|Privacy policy|Modern Slavery Act Transparency Statement|Sitemap|About US| Contact US: help@patsnap.com


