M-CDs for quickly detecting content of NO2<-> in food and environment and application method of m-CDs
A carbon quantum dot and nitrite technology, applied in analytical chemistry and nanometer fields, can solve the problems of complicated operation, high instrument cost, low sensitivity, etc., and achieve the effects of low cost, simple operation and wide application range.
- Summary
- Abstract
- Description
- Claims
- Application Information
AI Technical Summary
Problems solved by technology
Method used
Image

Examples
Embodiment 1
[0022] Embodiment 1: carbon quantum dots m -Synthesis of CDs
[0023] Dissolve m-phenylenediamine (0.60 g) in absolute ethanol (60 mL) and sonicate for 5 min to homogenize it. The mixed solution was transferred to a 100 mL polytetrafluoroethylene-lined autoclave, reacted at 180 °C for 12 hours, and then naturally cooled to room temperature to obtain a brown solution. Using silica gel column chromatography, the mixed solution of dichloromethane and methanol (15:1, v / v) was used as the eluent for further separation and purification, and the fluorescent carbon quantum dots were collected.
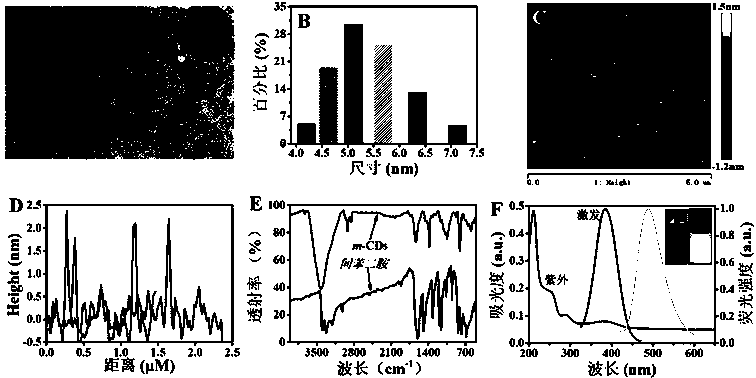
[0024] figure 1 for income m -The relevant characterization spectrum of CDs, wherein, Figure A is m - Transmission electron microscope image of CDs, Figure B is m -The particle size distribution diagram of CDs; Figure C is m -Atomic force microscopy images of CDs; Figure D is the corresponding image of Figure C m -Height of CDs; Figure E is m-phenylenediamine and m -Infrared contrast i...
Embodiment 2
[0025] Example 2: NO 2 - Drawing of standard curve
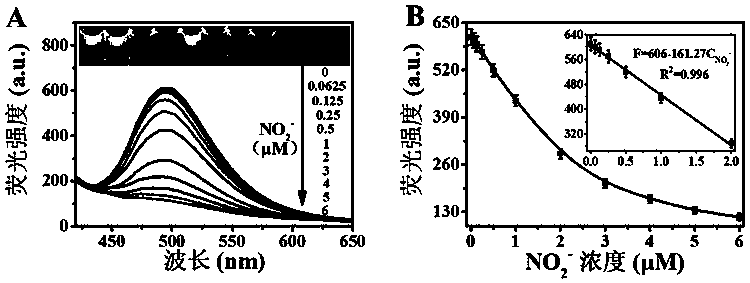
[0026] Preparation of NO with ultrapure water 2 - Solution, at room temperature, to 20 μg / mL m - CDs sulfuric acid solution (0.1 M) was added sequentially with different concentrations of NO 2 - solution (NO 2 - The final concentrations are 0, 0.063, 0.125, 0.25, 0.5, 1.0, 2.0, 3.0, 4.0, 5.0, 6.0 μM), and the mixed reaction was determined after 60 min m -CDs fluorescence intensity changes and plotted about m -CDs fluorescence in response to NO 2 - standard curve.
[0027] figure 2 for m -CDs respond to NO 2 - The change graph of fluorescence intensity (A) and the drawn standard curve (B). It can be seen from the figure that the response range is 0.063-6.0 μM, and the detection limit LOD is 0.018 μM.
Embodiment 3
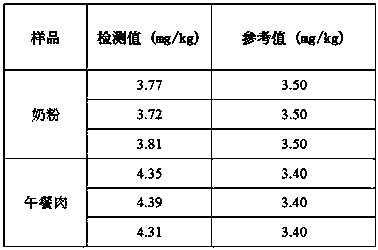
[0028] Example 3: NO in milk powder and luncheon meat quality control samples 2 - Content detection
[0029] (1) Sample extraction: Extract NO in quality control samples milk powder and luncheon meat according to Chinese national standard (GB 5009.33-2010) 2 -, the specific operation steps are: Weigh 5 g (accurate to 0.01 g) of a homogenized sample (if water is added during the preparation process, it should be converted according to the amount of water added), put it in a 50 mL beaker, add 12.5 mL of saturated borax solution , stir evenly, wash the sample into a 500 mL volumetric flask with about 300 mL of water at about 70 °C, heat in a boiling water bath for 15 min, take it out, put it in a cold water bath to cool, and place it at room temperature; when shaking the obtained extract Add 5 mL of potassium ferrocyanide solution, shake well, then add 5 mL of zinc acetate solution to precipitate protein; add water to the mark, shake well, let stand for 30 min, remove the uppe...
PUM
 Abstract
Description
Claims
Application Information
 - R&D
- Intellectual Property
- Life Sciences
- Materials
- Tech Scout
- Unparalleled Data Quality
- Higher Quality Content
- 60% Fewer Hallucinations
Browse by: Latest US Patents, China's latest patents, Technical Efficacy Thesaurus, Application Domain, Technology Topic, Popular Technical Reports.
© 2025 PatSnap. All rights reserved.Legal|Privacy policy|Modern Slavery Act Transparency Statement|Sitemap|About US| Contact US: help@patsnap.com