Method for detecting content of compounds in Huoxiang Zhengqi oral liquid by liquid chromatography-mass spectrometry
A technology of Zhengqi Oral Liquid and liquid chromatography, which is applied in the field of pharmaceutical component analysis, can solve the problems of low active ingredients and inability to accurately detect the content of Huoxiang Zhengqi Oral Liquid, and achieve good separation, repeatability and precision.
- Summary
- Abstract
- Description
- Claims
- Application Information
AI Technical Summary
Problems solved by technology
Method used
Image
Examples
Embodiment 1
[0053] Embodiment 1UHPLC / Q-Orbitrap MS detection condition verification
[0054] Liquid phase conditions: Waters ACQUITY BEH Shield RP18 (1.7μm, 2.1×100mm) chromatographic column, with 0.1% formic acid aqueous solution (A)-0.1% formic acid acetonitrile (B) as mobile phase, column temperature 35°C, flow rate 0.2mL / min, and the injection volume was 1 μL. The elution gradient is shown in Table 1.
[0055] Table 1 Mobile phase elution gradient
[0056] time / min Acetonitrile (B) 0.1% formic acid water (A) 0-1 5-10 95-90 1-12 10-20 90-80 12-20 20-27 80-73 20-24 27-33 73-67 24-30 33-40 67-60 30-33 40-48 60-52 33-42 48-80 52-20 42-42.5 80-95 20-5 42.5-45 95 5
[0057] Mass Spectrometry Condition Optimization
[0058] As the energy of NCE increases, the kurtosis of precursor ion fragments gradually decreases, while the kurtosis of characteristic product ion fragments gradually increases. If the energy is too hi...
Embodiment 2
[0063] Embodiment 2 specificity verification
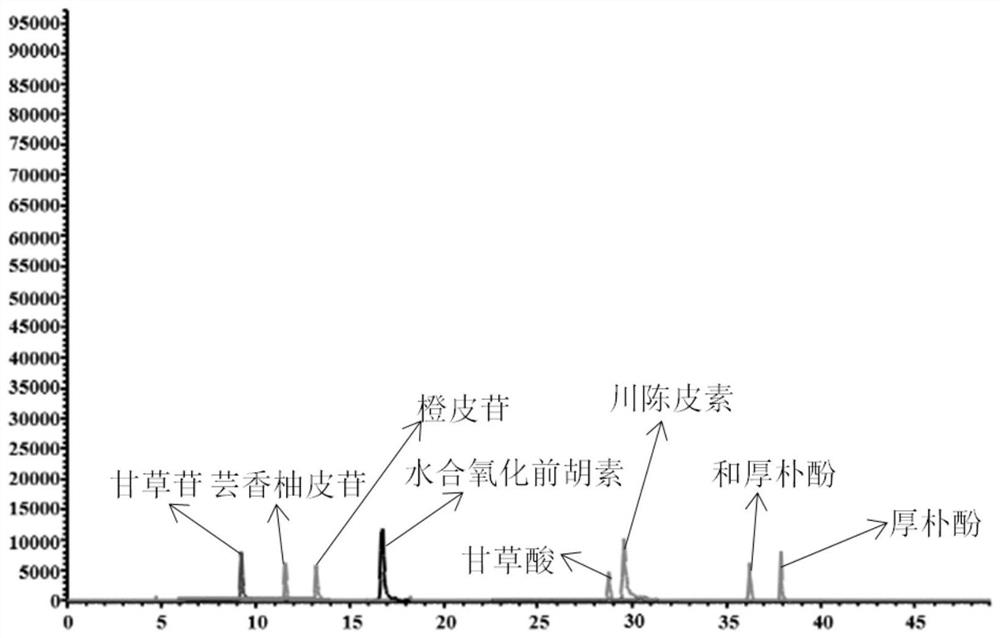
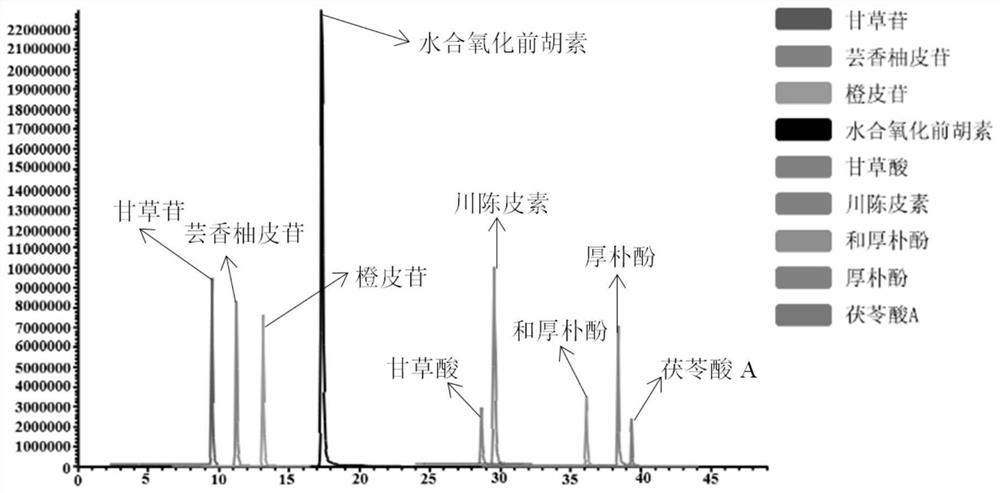
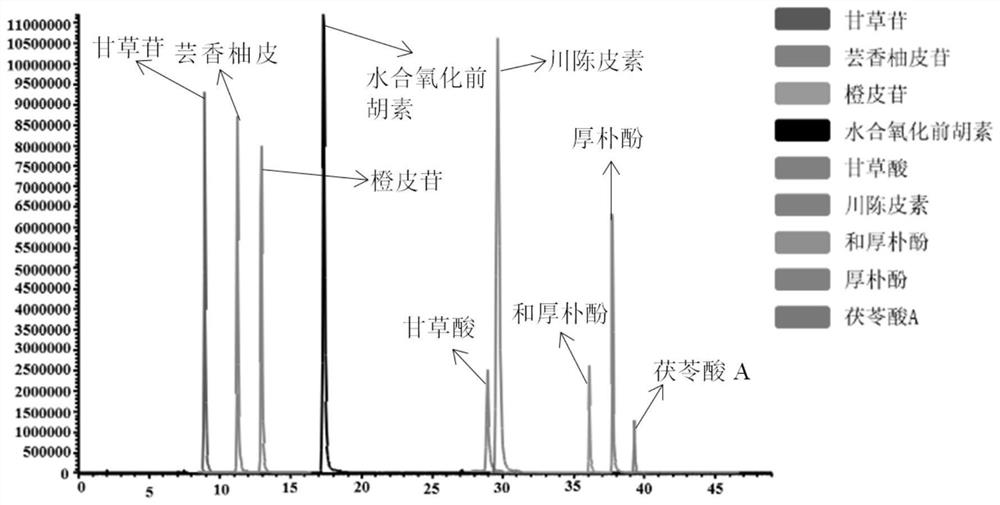
[0064] Specificity refers to the ability of the method to accurately detect the characteristics of the target compound in the presence of other components (impurities, excipients) that may exist. Under the chromatographic and mass spectrometric conditions in Example 1, the blank solvent, mixed standard solution, and Huoxiangzhengqi oral liquid samples were injected respectively, and the results in the positive and negative ion scanning modes were as follows: Figure 1-3 As shown, the results showed that nine target compounds and internal standards could be accurately detected without any interference, which indicated that the method had high selectivity.
Embodiment 3
[0065] Implement 3 linear range, LODs and LOQs verification
[0066] Using a series of concentration prepared mixed standard solutions, by plotting the peak area (A sample / A IS ) relative to each analyte concentration (C sample / C IS ) to create a standard curve. Then perform linear regression on the standard curve, and view the correlation coefficient and linear range of the resulting linear regression equation. The correlation coefficient should satisfy r 2 ≥0.999, the concentration of all samples should be located between the highest and lowest concentration of the standard curve as much as possible. The results are shown in Table 3, the linear regression equations of 9 target compounds were obtained, the correlation coefficient was good, r 2 The average is 0.999.
[0067] Table 3 The linear range of 9 compounds
[0068]
[0069] Further, the limit of detection and the limit of quantitation were measured with a signal-to-noise ratio (S / N) of 3 and 10, and the re...
PUM
| Property | Measurement | Unit |
|---|---|---|
| Particle size | aaaaa | aaaaa |
Abstract
Description
Claims
Application Information
 - R&D
- Intellectual Property
- Life Sciences
- Materials
- Tech Scout
- Unparalleled Data Quality
- Higher Quality Content
- 60% Fewer Hallucinations
Browse by: Latest US Patents, China's latest patents, Technical Efficacy Thesaurus, Application Domain, Technology Topic, Popular Technical Reports.
© 2025 PatSnap. All rights reserved.Legal|Privacy policy|Modern Slavery Act Transparency Statement|Sitemap|About US| Contact US: help@patsnap.com


