Automated quantitative restoration of bright field microscopy images

a bright field microscopy and automatic restoration technology, applied in image data processing, instruments, computer peripheral equipment, etc., can solve the problems of poor contrast of unstained cells' bfm images, difficult quantitative measurements of cellular shape and size, and lack of necessary contrast in bfm images of unstained cells

Active Publication Date: 2020-04-14
INST POTOSINO DE INVESTIGACION CIENTIFICA Y TECHCA A C
View PDF7 Cites 1 Cited by
  • Summary
  • Abstract
  • Description
  • Claims
  • Application Information

AI Technical Summary

Problems solved by technology

Although fluorescence enables the localization of specific targets with exquisite sensitivity, it presents limitations (M. Tscherepanow, F. Zöliner, M. Hillebrand, &F. Kummert, 2008 “Automatic Segmentation of Unstained Living Cells in Bright-Field Microscope Images” in Advances in Mass Data Analysis of Images and Signals in Medicine, Biotechnology, Chemistry and Food Industry, Springer Berlin Heidelberg, 158-172), such as photobleaching, phototoxicity, and spectral bleed-through due to an increased number of wavelength channels observed.
Phase contrast and differential interference contrast (DIC) are two widely employed microscopy procedures that effectively render visible unlabeled cells, albeit with associated optical artifacts (the presence of bright and dark halos surrounding cells) that difficult quantitative measurements of cellular shape and size.
However, for optically thin and transparent samples such as, but not limited to, unstained cells BFM images lack necessary contrast.
The BFM images carry amplitude and phase information and for optically thin and transparent objects (phase objects) the amplitude component is negligible; this is why BFM images of unstained cells present poor contrast.
Even when DM increases the contrast of an image allowing a better visualization of the phase object, it also introduces a significant blurring on the image of the object, impeding the use of DM for a quantitative analysis of shape.
Important drawbacks for this method are: the implementation of the TIE formalism in practice has been difficult and results in phase errors, the selected defocused planes must be optimized (P. K. Poola, V. P. Pandiyan, R. John, 2015 “Quantitative imaging of yeast cells using transport of intensity equation”, IEEE in 2015 Workshop on Recent Advances in Photonics) and the resulting phase image is often affected by low-frequency noise which can obscure images of cells (D. Paganin, A. Barty, P. J. McMahon, K. A. Nugent, 2004 “Quantitative phase-amplitude microscopy.
Some drawback of this method are: the need to rapidly acquire at least three images at different focal planes (before cells present any cell movement or morphological change), the simultaneous acquisition of bright field and fluorescence images for automated segmentation of bright field images (for cells with heterogeneous shapes such as macrophages), and finally for cells such as yeast U.S. Pat. No. 8,744,164 B2 mentions that important halo effects in bright field images are emphasized erroneously with this intensity projection method.
For BFM the implementation of deconvolution algorithms has been scarce due to the experimental difficulties of measuring the PSF, limited by low signal and poor contrast produced by sub-diffraction sized beads used in these measurements.
In addition, the PSF in BFM possesses an amplitude (aPSF) and a phase (pPSF) component, thus standard deconvolution algorithms (such as those used in fluorescence microscopy) cannot be applied unless one of the two BFM PSF components is neglected.
However, this methodology works only with high-contrast thin samples, which implies a staining step.
However, their blind deconvolution algorithm is also restricted to absorbing (stained) samples, where the phase component of the image and the phase component of the PSF are both ignored to simplify the deconvolution algorithm.
Image analysis software programs such as CellProfiler or Huygens Software by Scientific Volume Imaging allow to perform deconvolution on bright field images, as long as the images present high contrast, so the deconvolution process offered by these software programs are not suitable for phase objects such as unstained cells.

Method used


Image

  • Automated quantitative restoration of bright field microscopy images
  • Automated quantitative restoration of bright field microscopy images
  • Automated quantitative restoration of bright field microscopy images

Examples


example 1

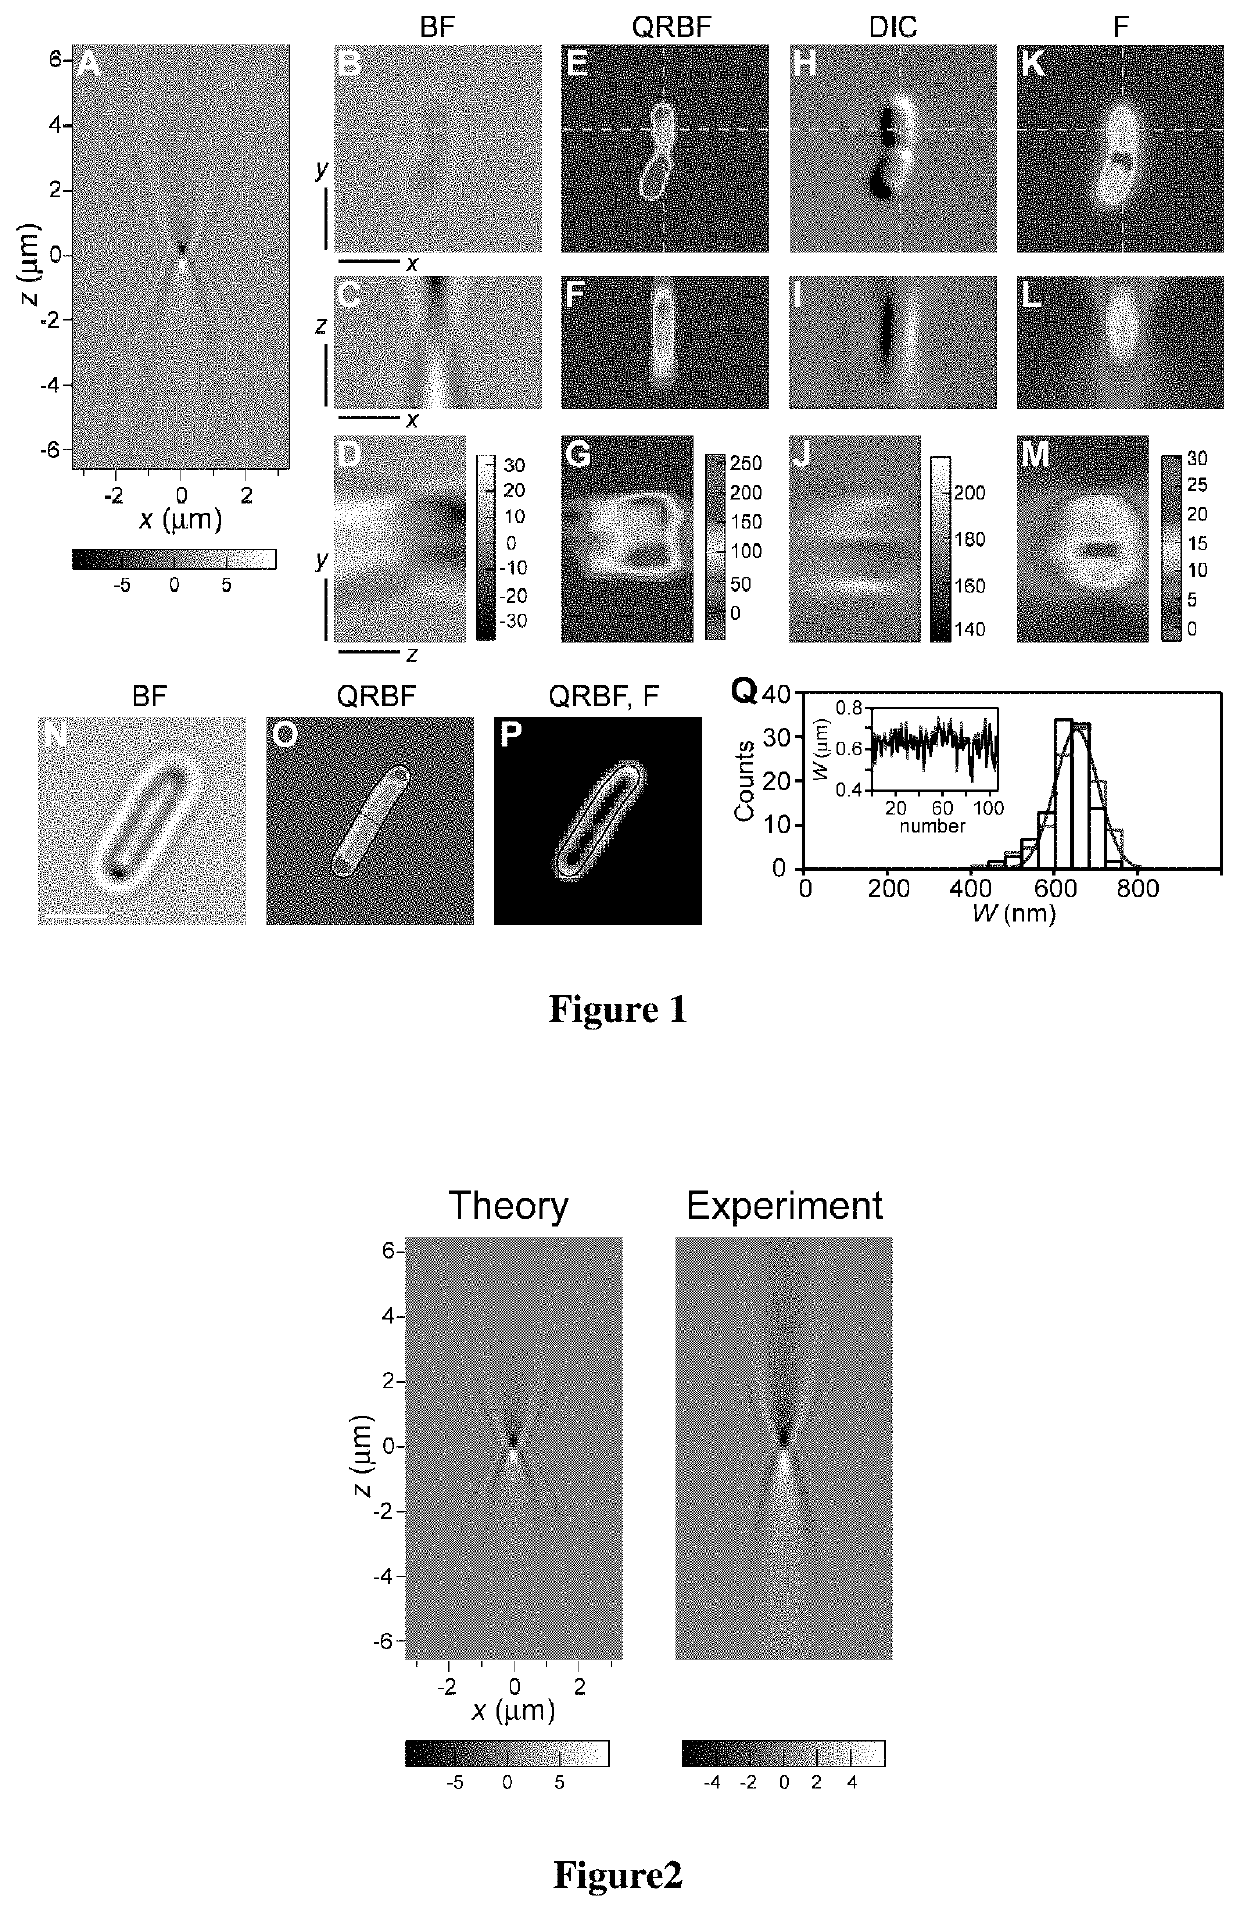
[0051]Using a conventional BF microscope operating under Koehler illumination, we collected z-stacks of background-free images of E. coli cells immobilized on a coverslip. An operational pPSF was generated based on Eq. (1) and three-dimensional (3D) deconvolution was performed on stacks of cell images using an available deconvolution routine.

pPSF(x,y,z)=∫01J0[kNAρ[x2+y2]1 / 2]sin[knz[[1−(NAρ / n)2]1 / 2−1]]dρ,  (1)

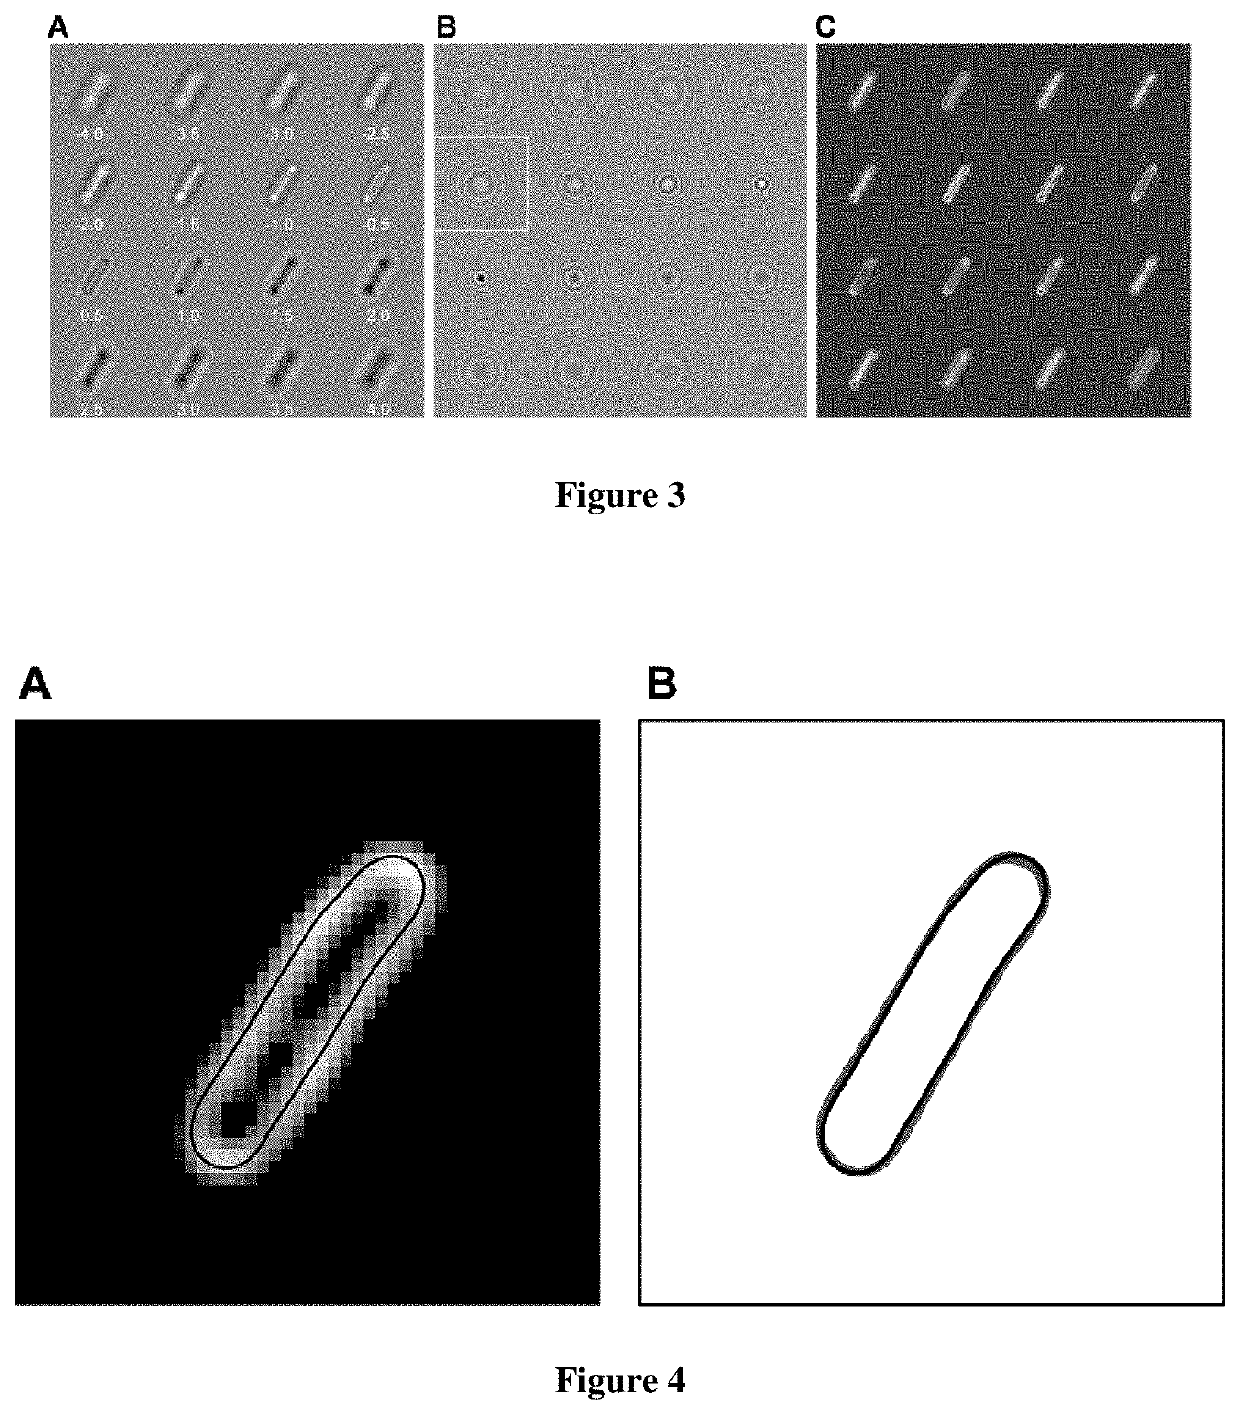
[0052]where J0 is the zeroth-order Bessel function of the first kind, k=2π / λ, λ is the wavelength of illumination, NA is the numerical aperture of the microscope objective, n is the index of refraction of the medium between the objective and the coverslip, (x,y) are transversal image coordinates and z is the amount of defocusing. FIG. 1A shows the resulting intensity distribution of the BF pPSF.

[0053]FIG. 1 shows how QRBF effectively restores images in 3D, turning an original BF image that features an ill-defined object (FIG. 1B,C,D) into the image of a cell undergoing division ...

example 2

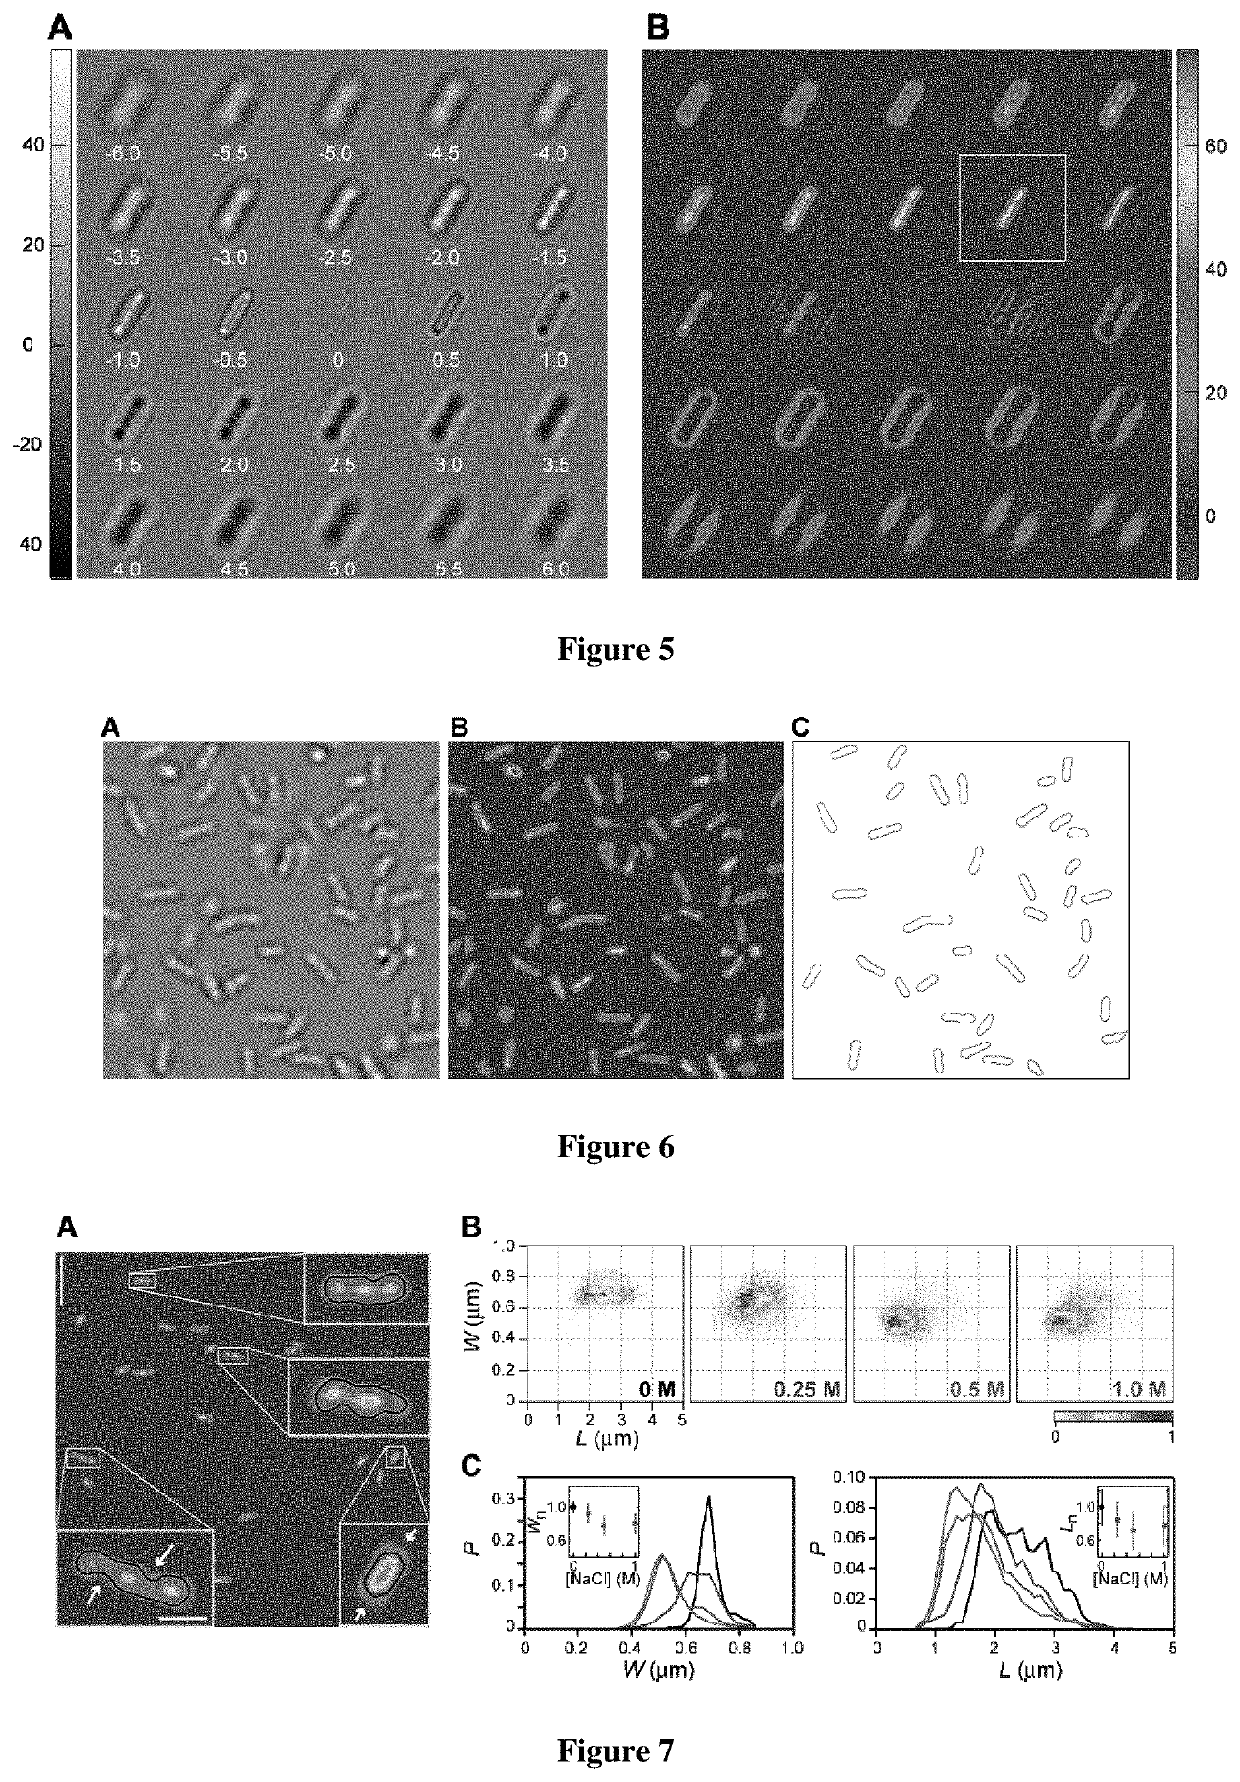
[0055]A large number of applications involving the study of cellular morphology would benefit from reliable, fast 2D-imaging of cells. To address this point, we implemented two-dimensional QRBF (2D-QRBF), where a single BF image of a defocused cell (FIG. 3A) is acquired and then deconvolved using the corresponding pPSF image at the same amount of defocus (FIG. 3B). The resulting 2D-QRBF image effectively restores cellular shape (FIG. 3C). Close inspection of cellular contour in 2D-QRBF images at various z-values above and below focus revealed that excellent agreement of cellular morphology is still maintained with respect to fluorescence microscopy (FIG. 4). Furthermore, we found that 2D-QRBF performs best when the amount of defocus is the same for both BF and pPSF images (FIG. 5), indicating that restoration is optimum at a given plane. We took advantage of this feature by applying 2D-QRBF on BF images of cells found both attached to a coverslip and free in solution (FIG. 6A). The ...

example 3

[0057]We applied 2D-QRBF in a new type of image cytometer to evaluate bacteria size changes in response to hyperosmotic shock. In the presence of hypertonic media bacteria modify their size and shape, developing plasmolysis—a process where water lost form the cytoplasm causes the inner plasma membrane to shrink away from the cell wall (P. Scheie, 1969. “Plasmolysis of Escherichia coli B / r with Sucrose”, J. Bacteriol. 98, 335-340). Here, non-growing E. coli cells were deposited on coverslips, subjected to increasing external concentrations of the solute NaCl, and imaged using 2D-QRBF. The deconvolved images of osmotically challenged bacteria show cells with deformations and voids in the cell body (FIG. 7A) that are in remarkable similarity with fluorescence (M. C. Konopka, I. A. Shkel, S. Cayley, M. T. Record, J. C. Weisshaar. 2006. “Crowding and confinement effects on protein diffusion in vivo”, J. Bacteriol. 188, 6115-6123) and electron microscopy (H. Schwarz, A. L. Kocht, 1995, “P...


PUM


Abstract

The herein invention discloses and claims a quantitative image restoration in bright field (QRBF) method that faithfully recovers shape and enables quantify size of individual unstained samples. The QRBF method restores out-of-focus BF images of unstained samples by applying deconvolution, which enhances contrast and allows for quantitative analysis. To perform deconvolution our procedure uses a point spread function modeled from theory. Image deconvolution can be performed even from a single input image in two dimensions (2D-QRBF), and quantitative information such as size and shape of samples can be determined from restored 2D-QRBF images. Application of 2D-QRBF in a high-throughput screening process to assess shape changes in cells during hyperosmotic shock shows that the described digital restoration approach is suitable for quantitative analysis of unstained BF images in high-throughput image cytometry.

Description

FIELD OF THE INVENTION[0001]The herein invention is related to restoration of bright field images generated with optical microscopes.BACKGROUND OF THE INVENTION[0002]The development of novel tools and methods has recently shaped remarkable advances in the field of optical microscopy of biological samples, with particular emphasis in fluorescence imaging (M. Oberholzer, M. Ostreicher, H. Christen&M. Brühlmann, 1996 “Methods in quantitative image analysis”, Histochem. Cell Biol., 105, 333-55). Although fluorescence enables the localization of specific targets with exquisite sensitivity, it presents limitations (M. Tscherepanow, F. Zöliner, M. Hillebrand, &F. Kummert, 2008 “Automatic Segmentation of Unstained Living Cells in Bright-Field Microscope Images” in Advances in Mass Data Analysis of Images and Signals in Medicine, Biotechnology, Chemistry and Food Industry, Springer Berlin Heidelberg, 158-172), such as photobleaching, phototoxicity, and spectral bleed-through due to an increa...

Claims


Application Information

Patent Timeline
Patent Type & Authority Patents(United States)
IPC IPC(8): G06T5/00G06T7/10G06K9/00G06T5/50G06T7/557
CPCG06T7/10G06K9/00134G06K9/0014G06T5/003G06T7/557G06T5/50G06T2207/10064G06T2207/10052G06T2207/10056G06T2207/30024G06V20/695G06V20/693
Inventor GUTIÉRREZ MEDINA, BRAULIOSÁNCHEZ MIRANDA, MANUEL DE JESÚSHERNÁNDEZ CANDIA, CARMEN NOEMÍ
Owner INST POTOSINO DE INVESTIGACION CIENTIFICA Y TECHCA A C
Why Eureka
Try Eureka