

Genetic loci associated with Sclerotinia tolerance in soybean
- Summary
- Abstract
- Description
- Claims
- Application Information
AI Technical Summary
Benefits of technology
Problems solved by technology
Method used
Image

Examples
example 1
Intergroup Allele Frequency Distribution Analysis
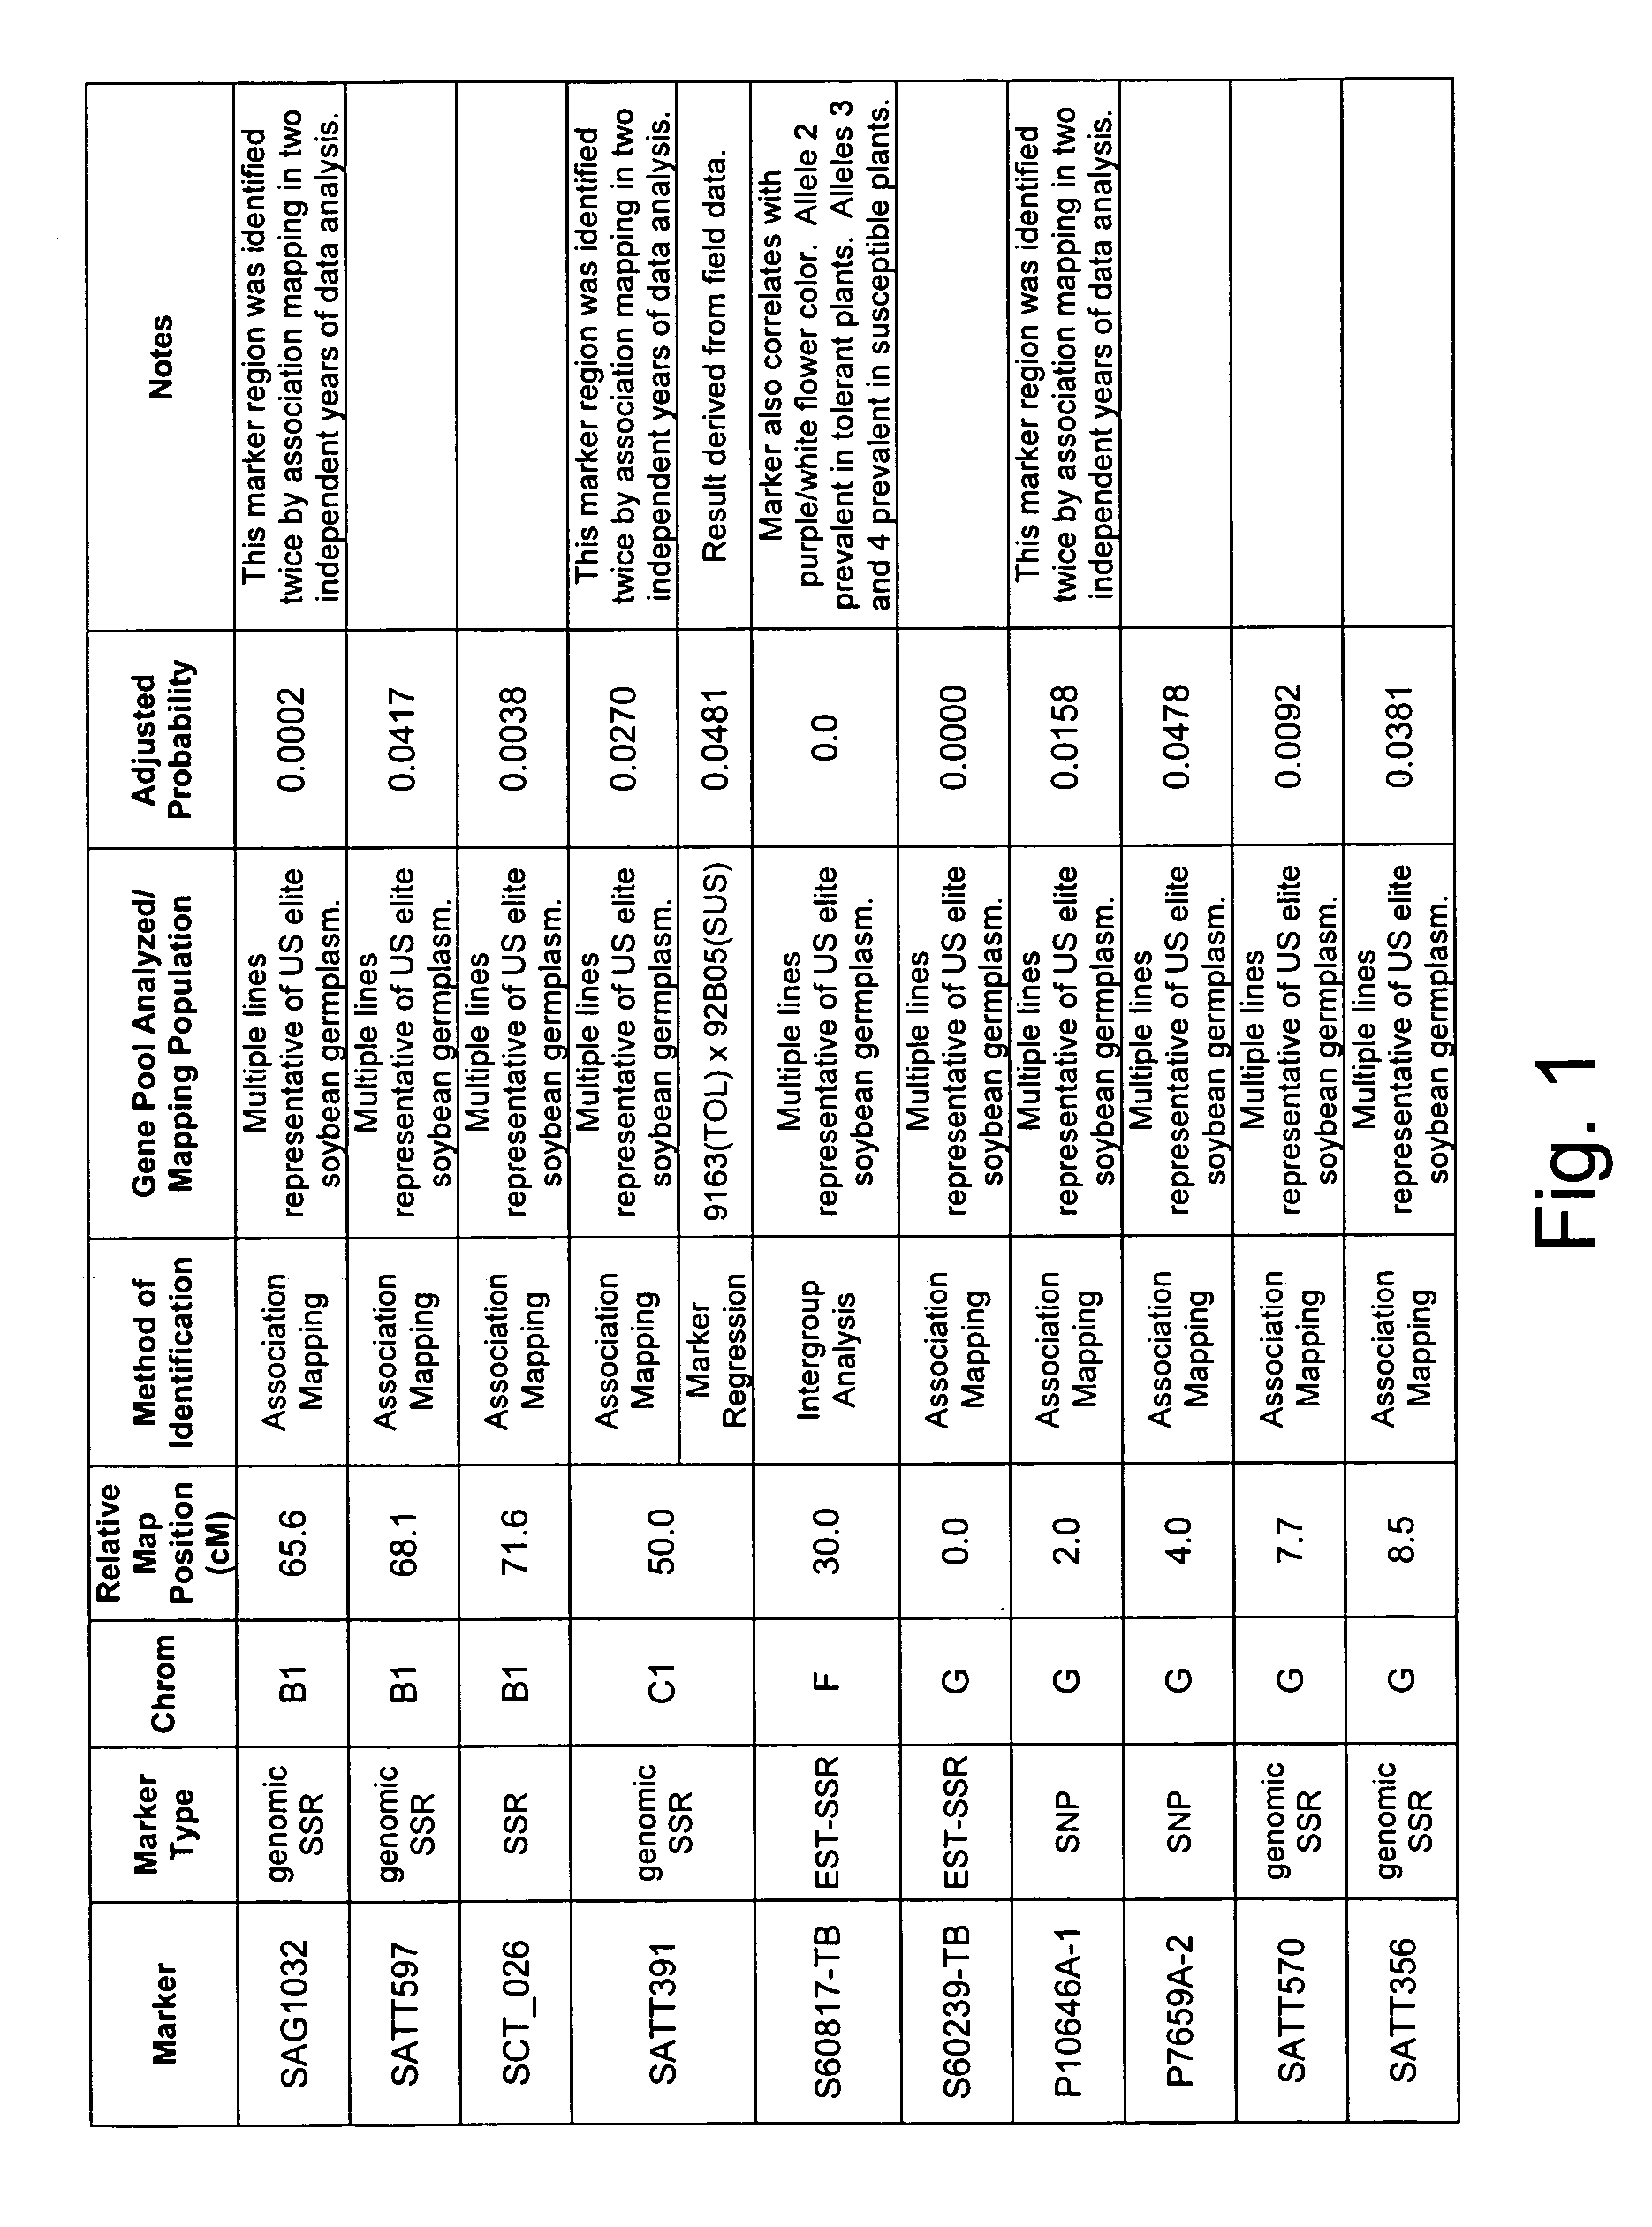
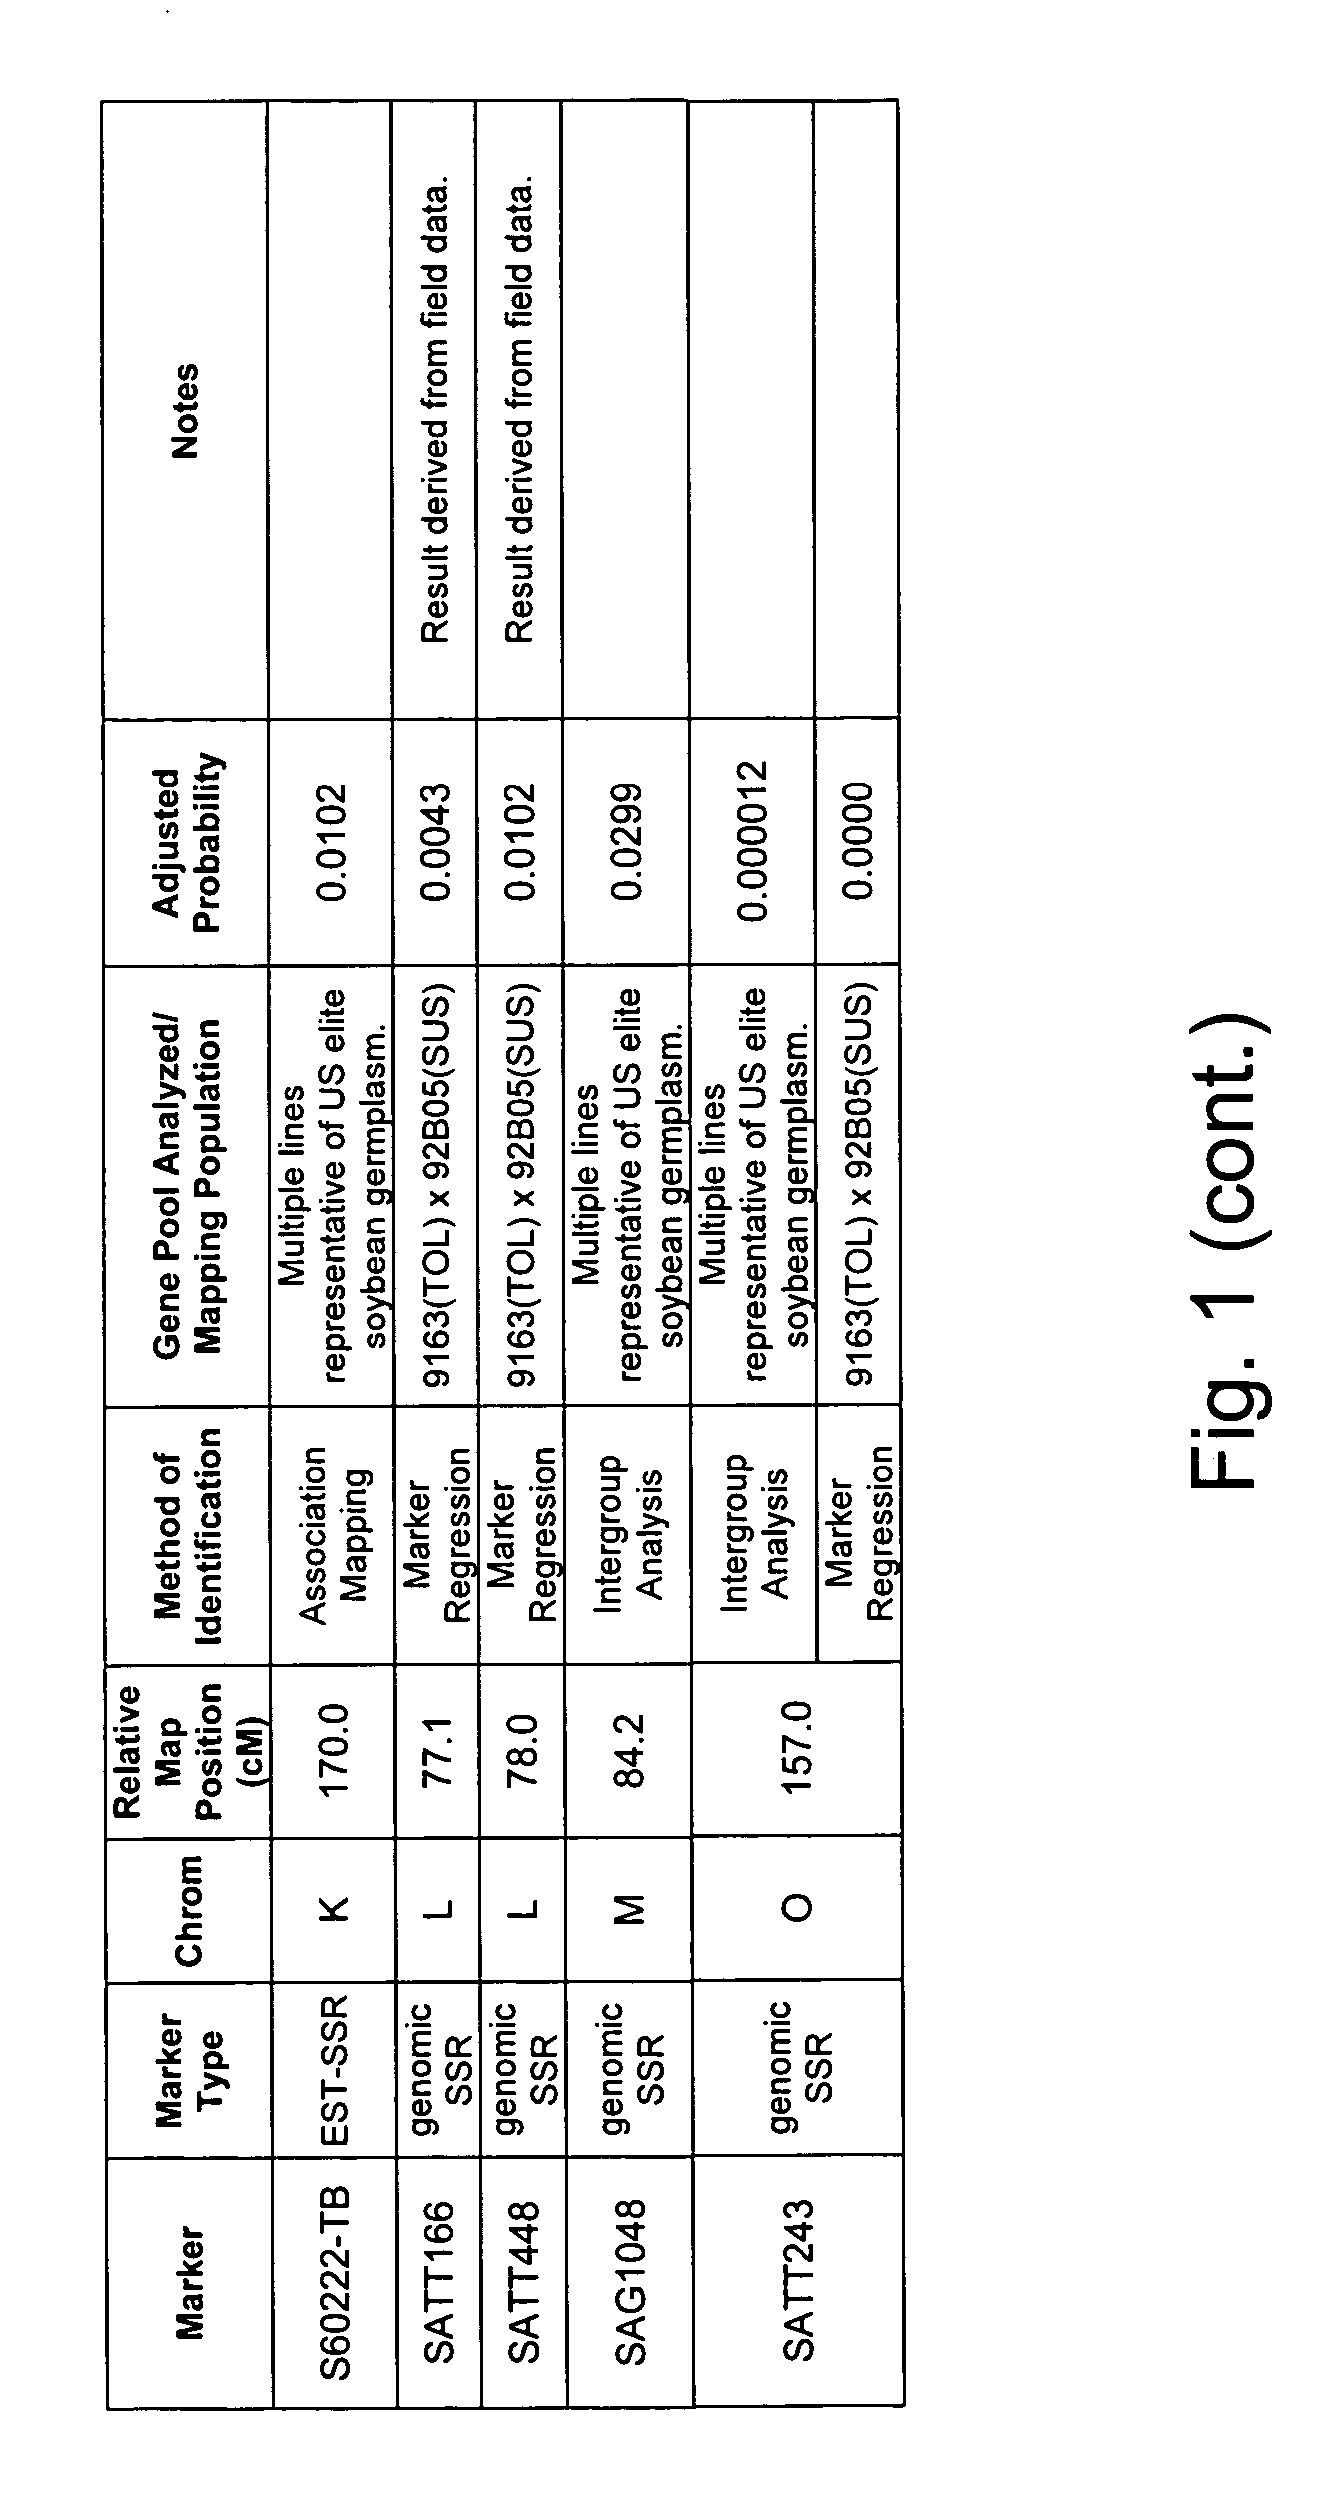
[0334] Two independent allele frequency distribution analyses were undertaken to identify soybean genetic marker loci associated with tolerance to Sclerotinia infection. By identifying such genetic markers, marker assisted selection (MAS) can be used to improve the efficiency of breeding for improved tolerance of soybean to Sclerotinia infection.
Soybean Lines and Tolerance Scoring
[0335] The plant varieties used in the analysis were from diverse sources, including elite germplasm, commercially released cultivars and other public lines representing a broad range of germplasm. The lines used in the study had a broad maturity range varying from group 0 to group 6.
[0336] Two groups of soybean lines were assembled for each analysis based on their phenotypic extremes in tolerance to Sclerotinia white mold infestation, where the plants were sorted into either highly susceptible or highly tolerant varieties. The classifications of toleran...
example 2
Association Mapping Analysis
[0357] An association mapping strategy was undertaken to identify soybean genetic markers associated with tolerance to Sclerotinia infection, which is the causative agent of soybean white mold (also termed stem rot). The study was completed twice, generating two independent data sets. By identifying such genetic markers, marker assisted selection (MAS) can be used to improve the efficiency of breeding for improved tolerance of soybean to Sclerotinia infection. Association mapping is known in the art, and is described in various sources, e.g., Jorde (2000), Genome Res., 10:1435-1444; Remington et al. (2001), “Structure of linkage disequilibrium and phenotype associations in the maize genome,” Proc Natl Acad Sci USA 98:11479-11484; and Weiss and Clark (2002), Trends in Genetics 18:19-24.
[0358] Understanding the extent and patterns of linkage disequilibrium (LD) in the genome is a prerequisite for developing efficient association appro...
example 3
QTL Interval Mapping and Single Marker Regression Analysis
[0375] A QTL interval mapping and a single marker regression analysis was undertaken to identify soybean chromosome intervals and genetic markers (respectively) that are associated with tolerance and allow the plant to escape the pathology associated with Sclerotinia infection. QTL mapping and marker regression are widely used methods to identify genetic loci that co-segregate with a desired phenotype. By identifying such genetic loci, marker assisted selection (MAS) can be used to improve the efficiency of breeding for improved soybean strains.
Soybean Lines
[0376] A mapping population for Sclerotinia tolerance was created from the cross of commercially available Pioneer varieties 9163 and 92B05. The population consisted of 276 RIL progeny.
Phenotypic Scoring
[0377] Two sets of phenotypic data were collected. One set was collected from a misting nursery. The second set was collected from a non-inoculated, irrigated, natur...
PUM
| Property | Measurement | Unit |
|---|---|---|
| Fraction | aaaaa | aaaaa |
| Volume | aaaaa | aaaaa |
| Volume | aaaaa | aaaaa |
Abstract
Description
Claims
Application Information