

Oh-type anion-exchange hydrocarbon-based elastomer, use and production method thereof
- Summary
- Abstract
- Description
- Claims
- Application Information
AI Technical Summary
Benefits of technology
Problems solved by technology
Method used
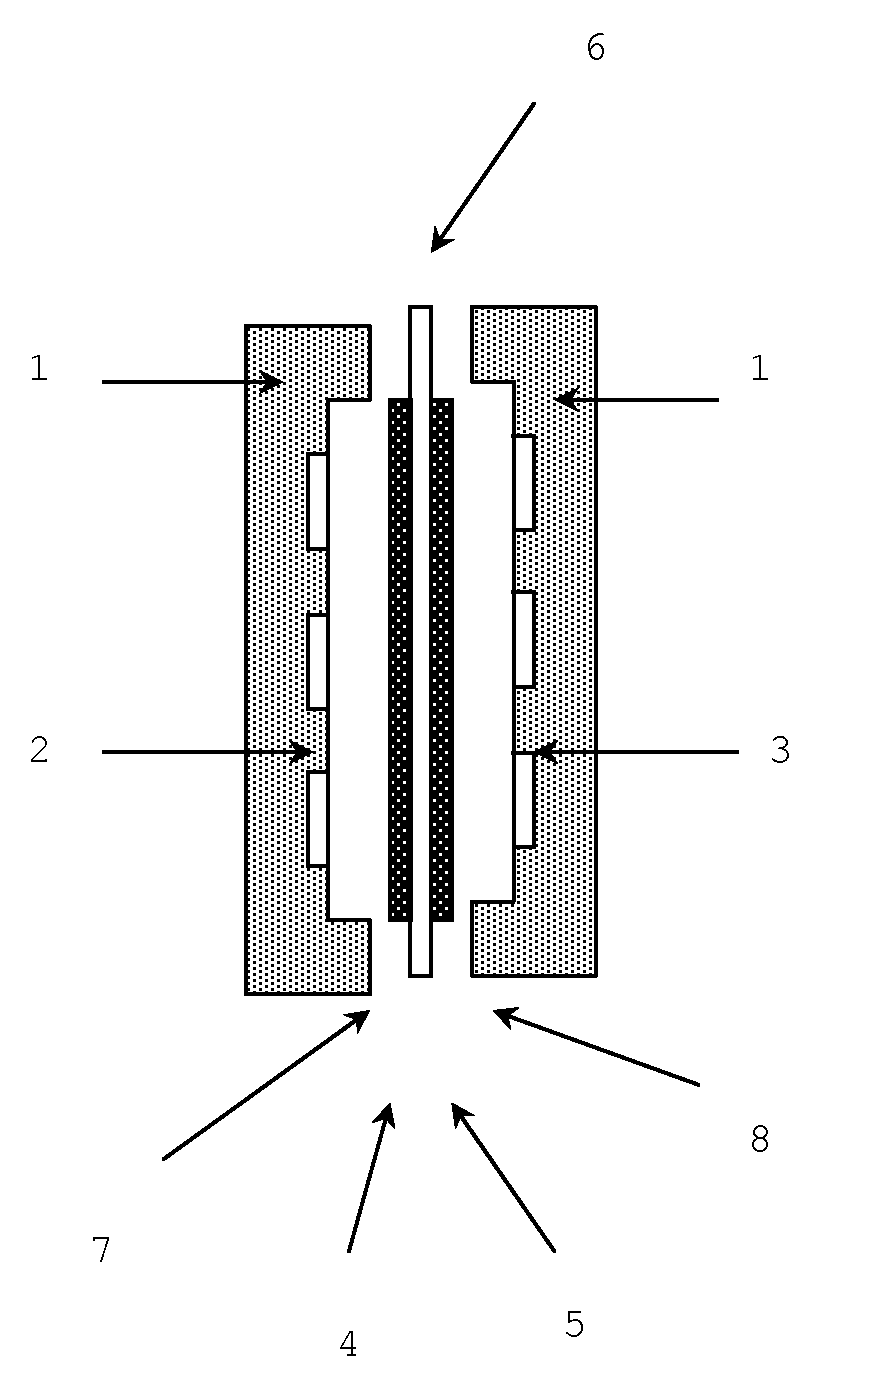
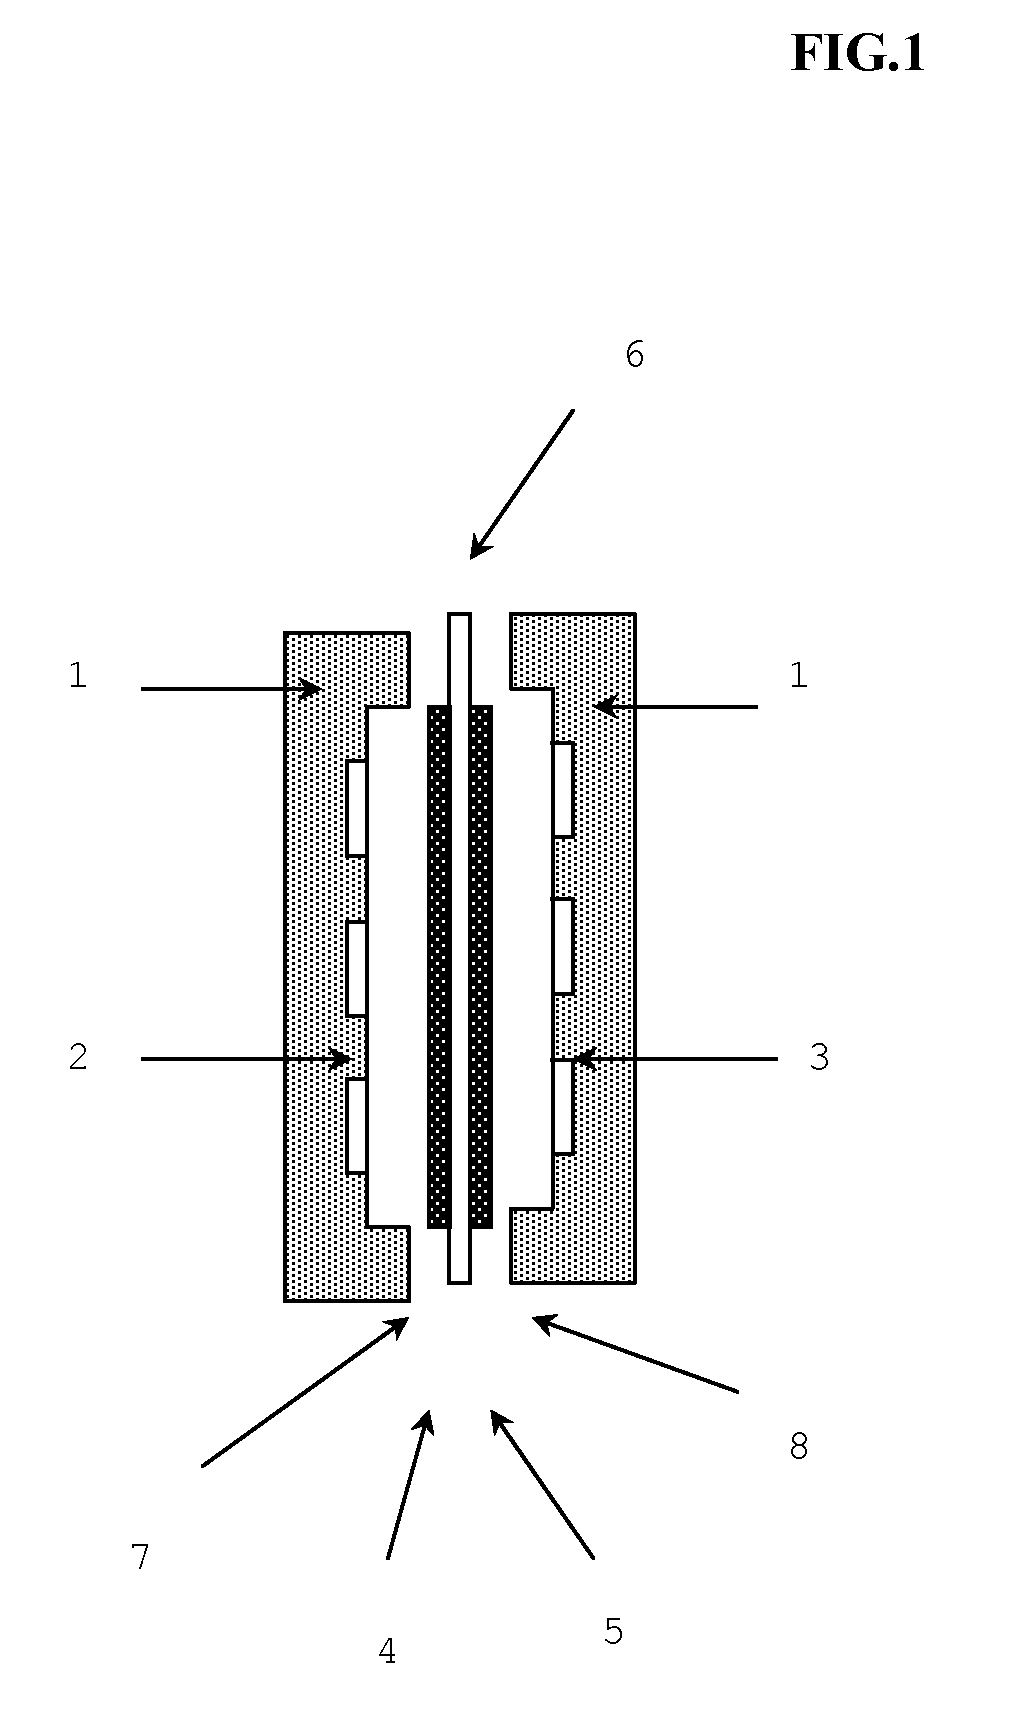
Image

Examples
manufacturing example 1
Raw Materials
[0130]A polystyrene-polyisoprene-polystyrene triblock copolymer (SIS) (weight average molecular weight of 30,000 and styrene content of 60 wt %) was used as a styrene-based elastomer. The iodine value of the styrene-based elastomer was 130.
[0131](Hydrogenation)
[0132]By using a hydrogenation catalyst prepared by nickel octylate and triisopropyl aluminum, hydrogenation reaction was performed in a solution in which the above styrene-based elastomer was dissolved in cyclohexane, so that a hydrogenated styrene-based elastomer, polystyrene-poly(ethylene-propylene)-polystyrene triblock copolymer (SEPS) (weight average molecular weight of 30,000 and styrene content of 60 wt %), was obtained. The hydrogenation rate was 95%, and the iodine value of the hydrogenated styrene-based elastomer was 7.
[0133](Chloromethylation)
[0134]A reaction to introduce a chloromethyl group was done in a solution in which the hydrogenated styrene-based elastomer was dissolved in chloromethyl methyl et...
manufacturing example 2
[0140]Except for drying at 30° C. after the ion exchange to the OH-type, an OH-type anion-exchange hydrocarbon-based elastomer was obtained as in the manufacturing example 1.
[0141]Table 1 shows the iodine value, anion-exchange capacity and water solubility at 20° C. of the OH-type anion-exchange hydrocarbon-based elastomer, and Table 2 shows concentrations of the hydroxide ion, carbonate ion and bicarbonate ion in the elastomer immediately after the manufacture, after 30 minutes in air and after 10 hours in air.
manufacturing example 3
Comparative
[0142]Except for drying at 50° C. after the ion exchange to the OH-type, an OH-type anion-exchange hydrocarbon-based elastomer was obtained as in the manufacturing example 1.
[0143]Table 1 shows the iodine value, anion-exchange capacity and water solubility at 20° C. of the OH-type anion-exchange hydrocarbon-based elastomer, and Table 2 shows concentrations of the hydroxide ion, carbonate ion and bicarbonate ion in the elastomer immediately after the manufacture, after 30 minutes in air and after 10 hours in air.
PUM
| Property | Measurement | Unit |
|---|---|---|
| Temperature | aaaaa | aaaaa |
| Temperature | aaaaa | aaaaa |
| Fraction | aaaaa | aaaaa |
Abstract
Description
Claims
Application Information