Methods and systems for microfluidics imaging and analysis

a microfluidics and imaging technology, applied in the field of methods and systems for microfluidic imaging and analysis, can solve the problems of difficult to use consumer electronics for diagnostics or detection, complex and expensive laboratory equipment must be used in highly controlled environments, and the use of complex and expensive laboratory equipment must be difficult,

Inactive Publication Date: 2015-09-03
CALIFORNIA INST OF TECH
View PDF1 Cites 57 Cited by
  • Summary
  • Abstract
  • Description
  • Claims
  • Application Information

AI Technical Summary

Problems solved by technology

While good results can be obtained with this type of analysis, complex and expensive laboratory equipment must be used in highly controlled environments.
These devices are especially attractive in limited-resource settings, where there are limitations on trained personnel, infrastructure, medical instruments, and access to resources such as electricity and refrigeration.
Several challenges exist for using consumer electronics for diagnostics or detection.
These tests can suffer from lack of accuracy and reliability due to analog ratiometric nature of the results.
Variability between devices also creates challenges for using consumer electronics for diagnostic or detection purposes.
Each user's phone may have different hardware and / or software which creates challenges for reliability and repeatability.
Additionally, as the devices are used outside the controlled environment of the laboratory environmental differences such as changes in humidity or temperature can alter the ability of a consumer electronic to used with accuracy and precision.

Method used


Image

  • Methods and systems for microfluidics imaging and analysis
  • Methods and systems for microfluidics imaging and analysis
  • Methods and systems for microfluidics imaging and analysis

Examples


example 1

Formation of a SlipChip

[0255]The procedure of fabricating desired glass SlipChips using soda lime glass was based on previous work. The two-step exposing-etching protocol was adapted to create wells of two different depths (5 μm for thermal expansion wells, 55 μm for all the other wells). After etching, the glass plates were thoroughly cleaned with piranha acid and DI water, and dried with nitrogen gas. The glass plates were then oxidized in a plasma cleaner for 10 minutes and immediately transferred into a desiccator for 1 hour of silanization. They were rinsed thoroughly with chloroform, acetone, and ethanol, and dried with nitrogen gas before use.

[0256]Plastic polycarbonate SlipChip devices were directly oxidized in a plasma cleaner for 15 minutes after they were received from microfluidic ChipShop GmbH, and then transferred into a desiccator for 90 minutes of silanization. They were soaked in tetradecane for 15 minutes at 65° C. and then rinsed thoroughly with ethanol, then drie...

example 2

Single-Molecule Amplification in a SlipChip

[0258]A digital reverse-transcription loop-mediated isothermal amplification (dRT-LAMP) reaction was used for quantifying HIV-1 viral load. LAMP produces a bright fluorescence signal through replacement of manganese with magnesium in calcein.

[0259]Digital LAMP experiments have been described previously. Primers targeting the p24 gene were used. Quantifying viral load is necessary to monitor the effectiveness of antiretroviral therapy (ART). HIV virus quickly mutates under pressure of drug therapy due to its error-prone reverse transcriptase, which converts viral RNA to cDNA. These multiple mutations allow for the sudden appearance of drug-resistant strains that could be controlled by switching to another ART.

[0260]The steps of a digital LAMP experiment include loading samples onto a SlipChip device consisted of two glass plates with etched wells and channels lubricated with a layer of hydrocarbon oil enabled loading, compartmentalize, incub...

example 3

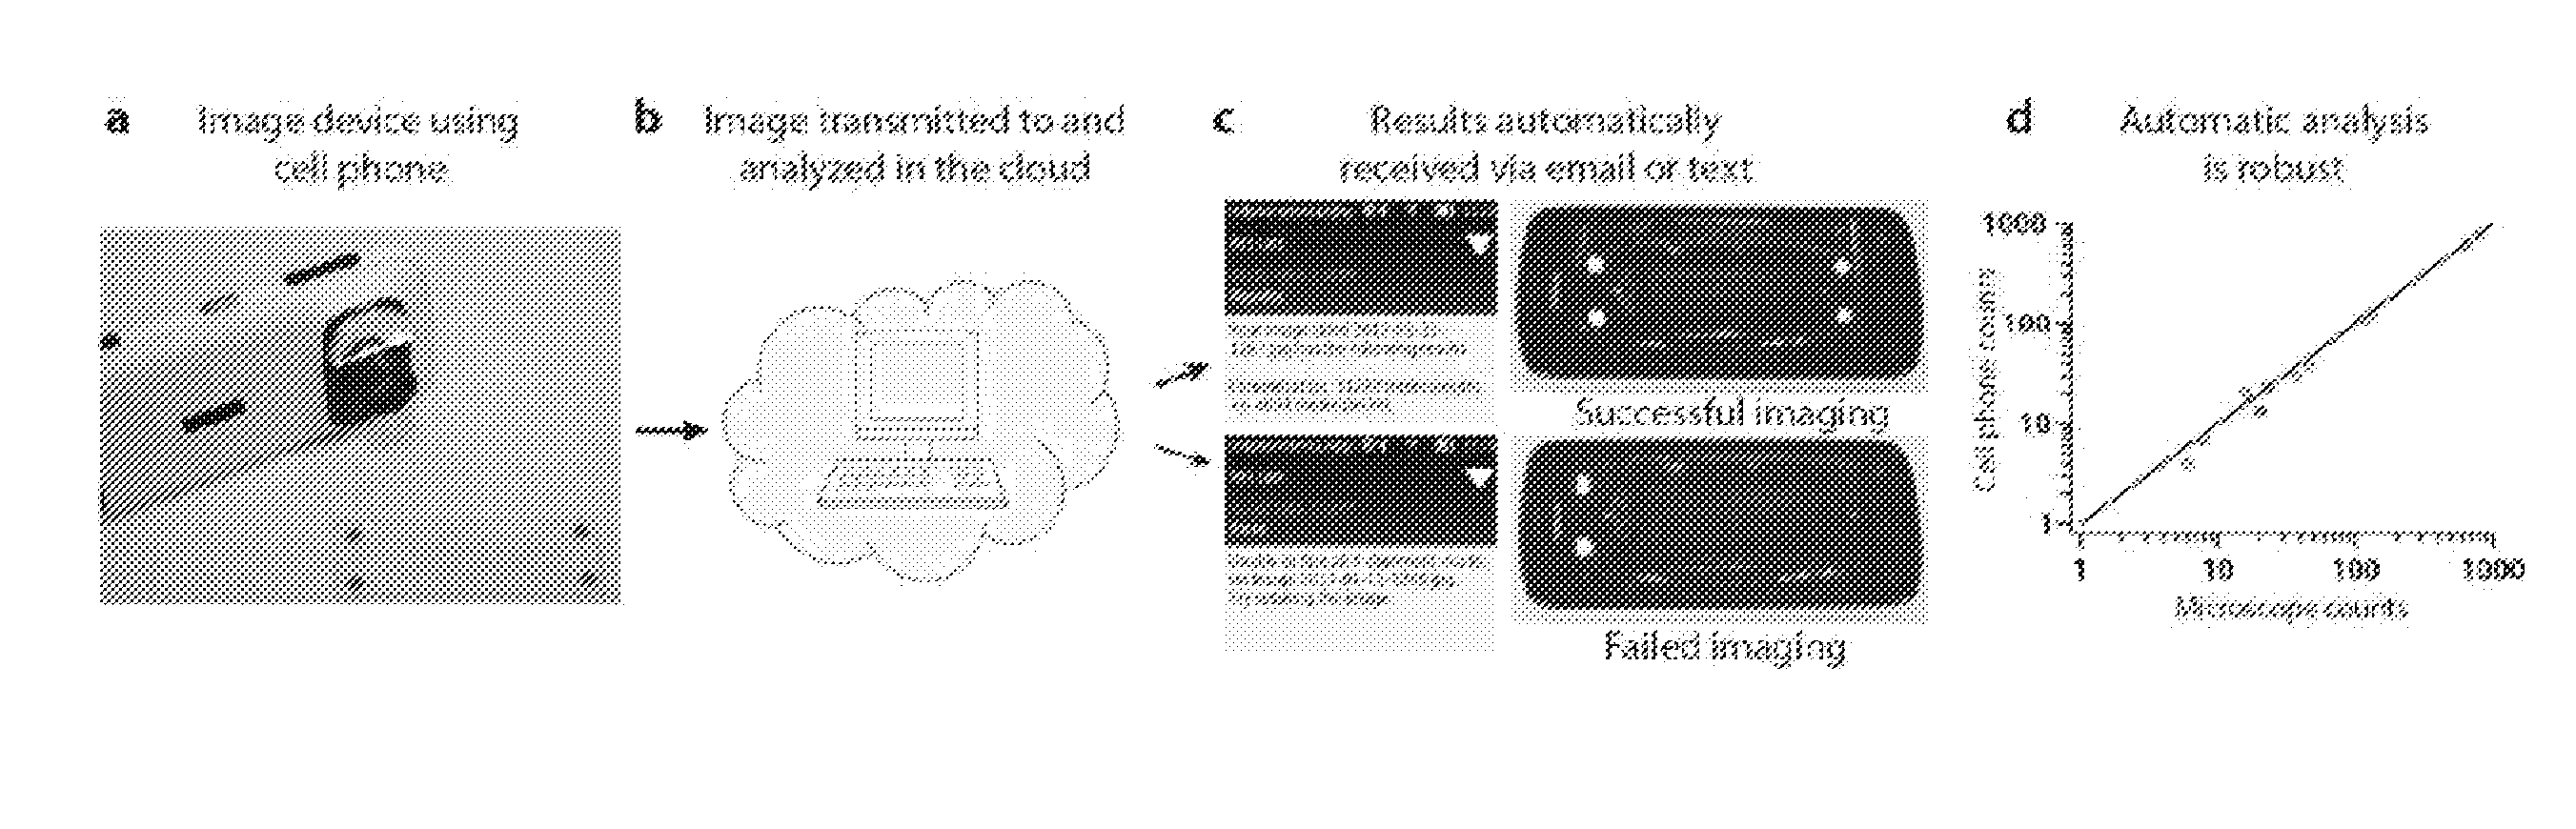
Imaging of SlipChip with Cell-Phone Camera

[0264]After incubation, the device from Example 2 was placed in a shoebox with a small window to mimic a dark room and imaged with a Nokia 808 cell phone.

[0265]A Nokia Pureview 808 cell phone was used to image and count microwells that contained the amplification product. This cell phone features a CMOS sensor with a Xenon flash which generates over 100,000 lux with a pulse with (PW) of 100-450 μs. The Nokia 808 PureView's large 1 / 1.4″ CMOS sensor has a 41 MP resolution, outputting a maximum of 38 MP (at 4:3 aspect ratio); pixel size is 1.4 μm. The camera has a Carl Zeiss F2.4 8.02 mm lens. Images captured in the PureView modes are created by oversampling from the sensor's full resolution. Pixel oversampling bins many pixels to create a much larger effective pixel, thus increasing the total sensitivity of the pixel.

[0266]The camera has focus distance of 15 cm in close-up mode, so a cell phone objective lens was used to bring the camera in cl...


PUM

PropertyMeasurementUnit
temperatureaaaaaaaaaa
wavelengthsaaaaaaaaaa
temperatureaaaaaaaaaa

Abstract

Disclosed herein are methods and devices for assessing sample for the presence of a disease or organism using images from devices such as a consumer cell phones.

Description

CROSS-REFERENCE[0001]This application claims the benefit of U.S. Provisional Application No. 61 / 710,454, filed Oct. 5, 2012, which application is incorporated herein by reference in its entirety.STATEMENT AS TO FEDERALLY SPONSORED RESEARCH[0002]This invention was made with government support under DARPA Cooperative Agreement HR0011-11-2-0006, NIH Grant R01EB012946 awarded by the National Institute of Biomedical Imaging and Bioengineering, and by the NIH Director's Pioneer Award program, part of the NIH Roadmap for Medical Research (5DP1OD003584). The government has certain rights in the invention.BACKGROUND OF THE INVENTION[0003]Currently, many important quantitative diagnostic / detection tools are available only in complex laboratory settings. In the laboratory, two methods that are commonly used to quantify molecules: kinetic analysis and single-molecule counting. Kinetic analysis is the most common method, and includes tests such as real-time polymerase chain reaction (rt-PCR), in...

Claims


Application Information

Patent Timeline
Patent Type & Authority Applications(United States)
IPC IPC(8): C12Q1/68G01N21/64C12Q1/70
CPCC12Q1/6851C12Q1/703G01N21/6428G01N21/6456C12Q2600/16G06F19/16G01N2021/6471G01N2201/061G01N2201/062G01N2201/12G01N2021/6439G16B15/00Y02A90/10C12Q2527/101C12Q2565/619C12Q2565/628
Inventor ISMAGILOV, RUSTEM F.SELCK, DAVID A.KARYMOV, MIKHAILSUN, BING
Owner CALIFORNIA INST OF TECH
Why Eureka
Try Eureka