Self-encoding fiber optic sensor

a fiber optic sensor and self-encoding technology, applied in the field of chemical sensors, sensor arrays and sensing devices, can solve the problems of limiting the efficacy of such devices, requiring recalibration and network retraining, and unsatisfactory element-to-element reproducibility between sensor arrays

Inactive Publication Date: 2006-10-03
TRUSTEES OF TUFTS COLLEGE
View PDF97 Cites 351 Cited by
  • Summary
  • Abstract
  • Description
  • Claims
  • Application Information

AI Technical Summary

Benefits of technology

[0019]The present invention overcomes certain limitations of the current art by embodying the innovation of a self-encoding sensor array wherein a characteristic optical response signature is produced by the interaction of specific bead subpopulation compositions with a reporter dye. The self-encoding feature of the present invention eliminates the need for a more complex, multi-step encoding system. In the self-encoding sensor array of the present invention, the response signal to a target analyte serves both as a response signature for the target analyte and as the encoding signal for the entire sensor array and subpopulations within the array. The decoding of the array is thus accomplished in a one-step process during the array response measurement of a target analyte and utilizes the very response which is used to identify the target analyte. The bead encoding is thus incorporated into the array by the nature of the bead subpopulation responses to target analytes.
[0020]In the present invention, each bead-dye combination of a subpopulation has a characteristic optical response signature when exposed to a given vapor. The self-encoding concept is provided by the unique response characteristics of the dye in combination with a specific bead matrix material. Thus the bead subpopulations which are randomly dispersed in a sensor array can be rapidly identified and located after placement in the array simply by exposing the sensor array to a known test vapor and matching the resulting optical response signature to those obtained for each bead subpopulation. With this approach, the beads are self encoding and the response characteristics of the entire sensor array are rapidly determined and stored for measurement of a target analyte. The method of the present invention is particularly useful in applications of sensor arrays containing thousands of sensors having distinctive optical response signature characteristics.
[0022]In a preferred embodiment of the present invention, ultra-fine, porous microbeads or microspheres are utilized as individual sensors. The utilization of porous micrometer scale sensors provides for improved sensor response and sensitivity. The reduction in sensor dimension substantially reduces the diffusion length and time for analyte interaction with individual sensors and significantly shortens the sensor response time, while simultaneously enhancing sensor sensitivity and lowering detection limits.
[0026]The present invention thus embodies the evolutionary scent amplification process found in the human olfactory system in order to significantly enhance sensor array sensitivity to analytes by summing the low-level responses of a large number of sensor array elements. By summing the responses from several beads at low vapor concentrations, a substantial improvement in signal-to-noise ratios is achieved, exceeding a factor of ten or more. This innovation has led to reducing the detection limit of the sensor array by over an order of magnitude. The enhancement in sensitivity provided by the sensor array of the present invention is generally known to be directly proportional to the square root of the number of independent sensor bead responses available for summing. With such enhancements, detection limits approaching parts per billion are achievable.

Problems solved by technology

While such technologies provide inventive approaches utilizing a variety of physical and chemical phenomena to odor sensing, there are a number of limitations to these methods which restrict the efficacy of such devices.
Firstly, element-to-element reproducibility both within a single array and between sensor arrays is typically unsatisfactory and thus requires recalibration and network retraining from sensor to sensor.
Secondly, most of these methods have a relatively slow response time, frequently requiring several minutes to respond to the presence of an odor.
Thirdly, such methods have relatively high detection limits and low sensitivity, typically not functioning at odor levels below 10 parts per million (ppm): Fourthly, devices which embody such technologies typically require a relatively large inherent size, thereby restricting miniaturization of the sensor array for use in remote sensing applications.
Finally, construction of multi-sensor arrays by these methods is complex and involves expensive and tedious preparation and placement of individual sensors within a well-defined array.
The drawback, however, was the difficulty in applying the various chemistries associated with the chemical functionalities at the sensor's end; the functionalities were built on the sensor's end in a step-wise serial fashion.
This was a slow process, and in practice, only tens of functionalities could be applied.
While the method of applying microsphere sensor elements in chemical sensor arrays as taught in U.S. patent application Ser. No. 08 / 818,199 to Walt, et al, has many innovative features, this method has certain limitations.
The choice of encoding dyes is limited to those dyes which emit light at different wavelengths upon exposure to excitation light energy.
While combinations of dyes in different ratios provide for encoding subpopulations of beads, the number of dye ratios available for encoding beads with a given dye pair or combination is significantly limited due to crowding the emission spectrum from peak overlap.
Thus, the encoding dye choice is further limited by selecting dyes whose emission wavelengths do not overlap or interfere with the reporting dye which is uniquely responsive to the presence of an analyte.
This process of decoding individual subpopulations of beads may be require additional steps when a large number of subpopulations are deployed in the array, thereby increasing the training time required for each array.
However, such methods are limited in scope and have been applied only to a narrow class of bead materials having specific chemical functionality and molecular tags which are readily analyzable.

Method used


Image

  • Self-encoding fiber optic sensor
  • Self-encoding fiber optic sensor
  • Self-encoding fiber optic sensor

Examples


example 1

Preparation of Porous Silica NILE RED Dye Beads:

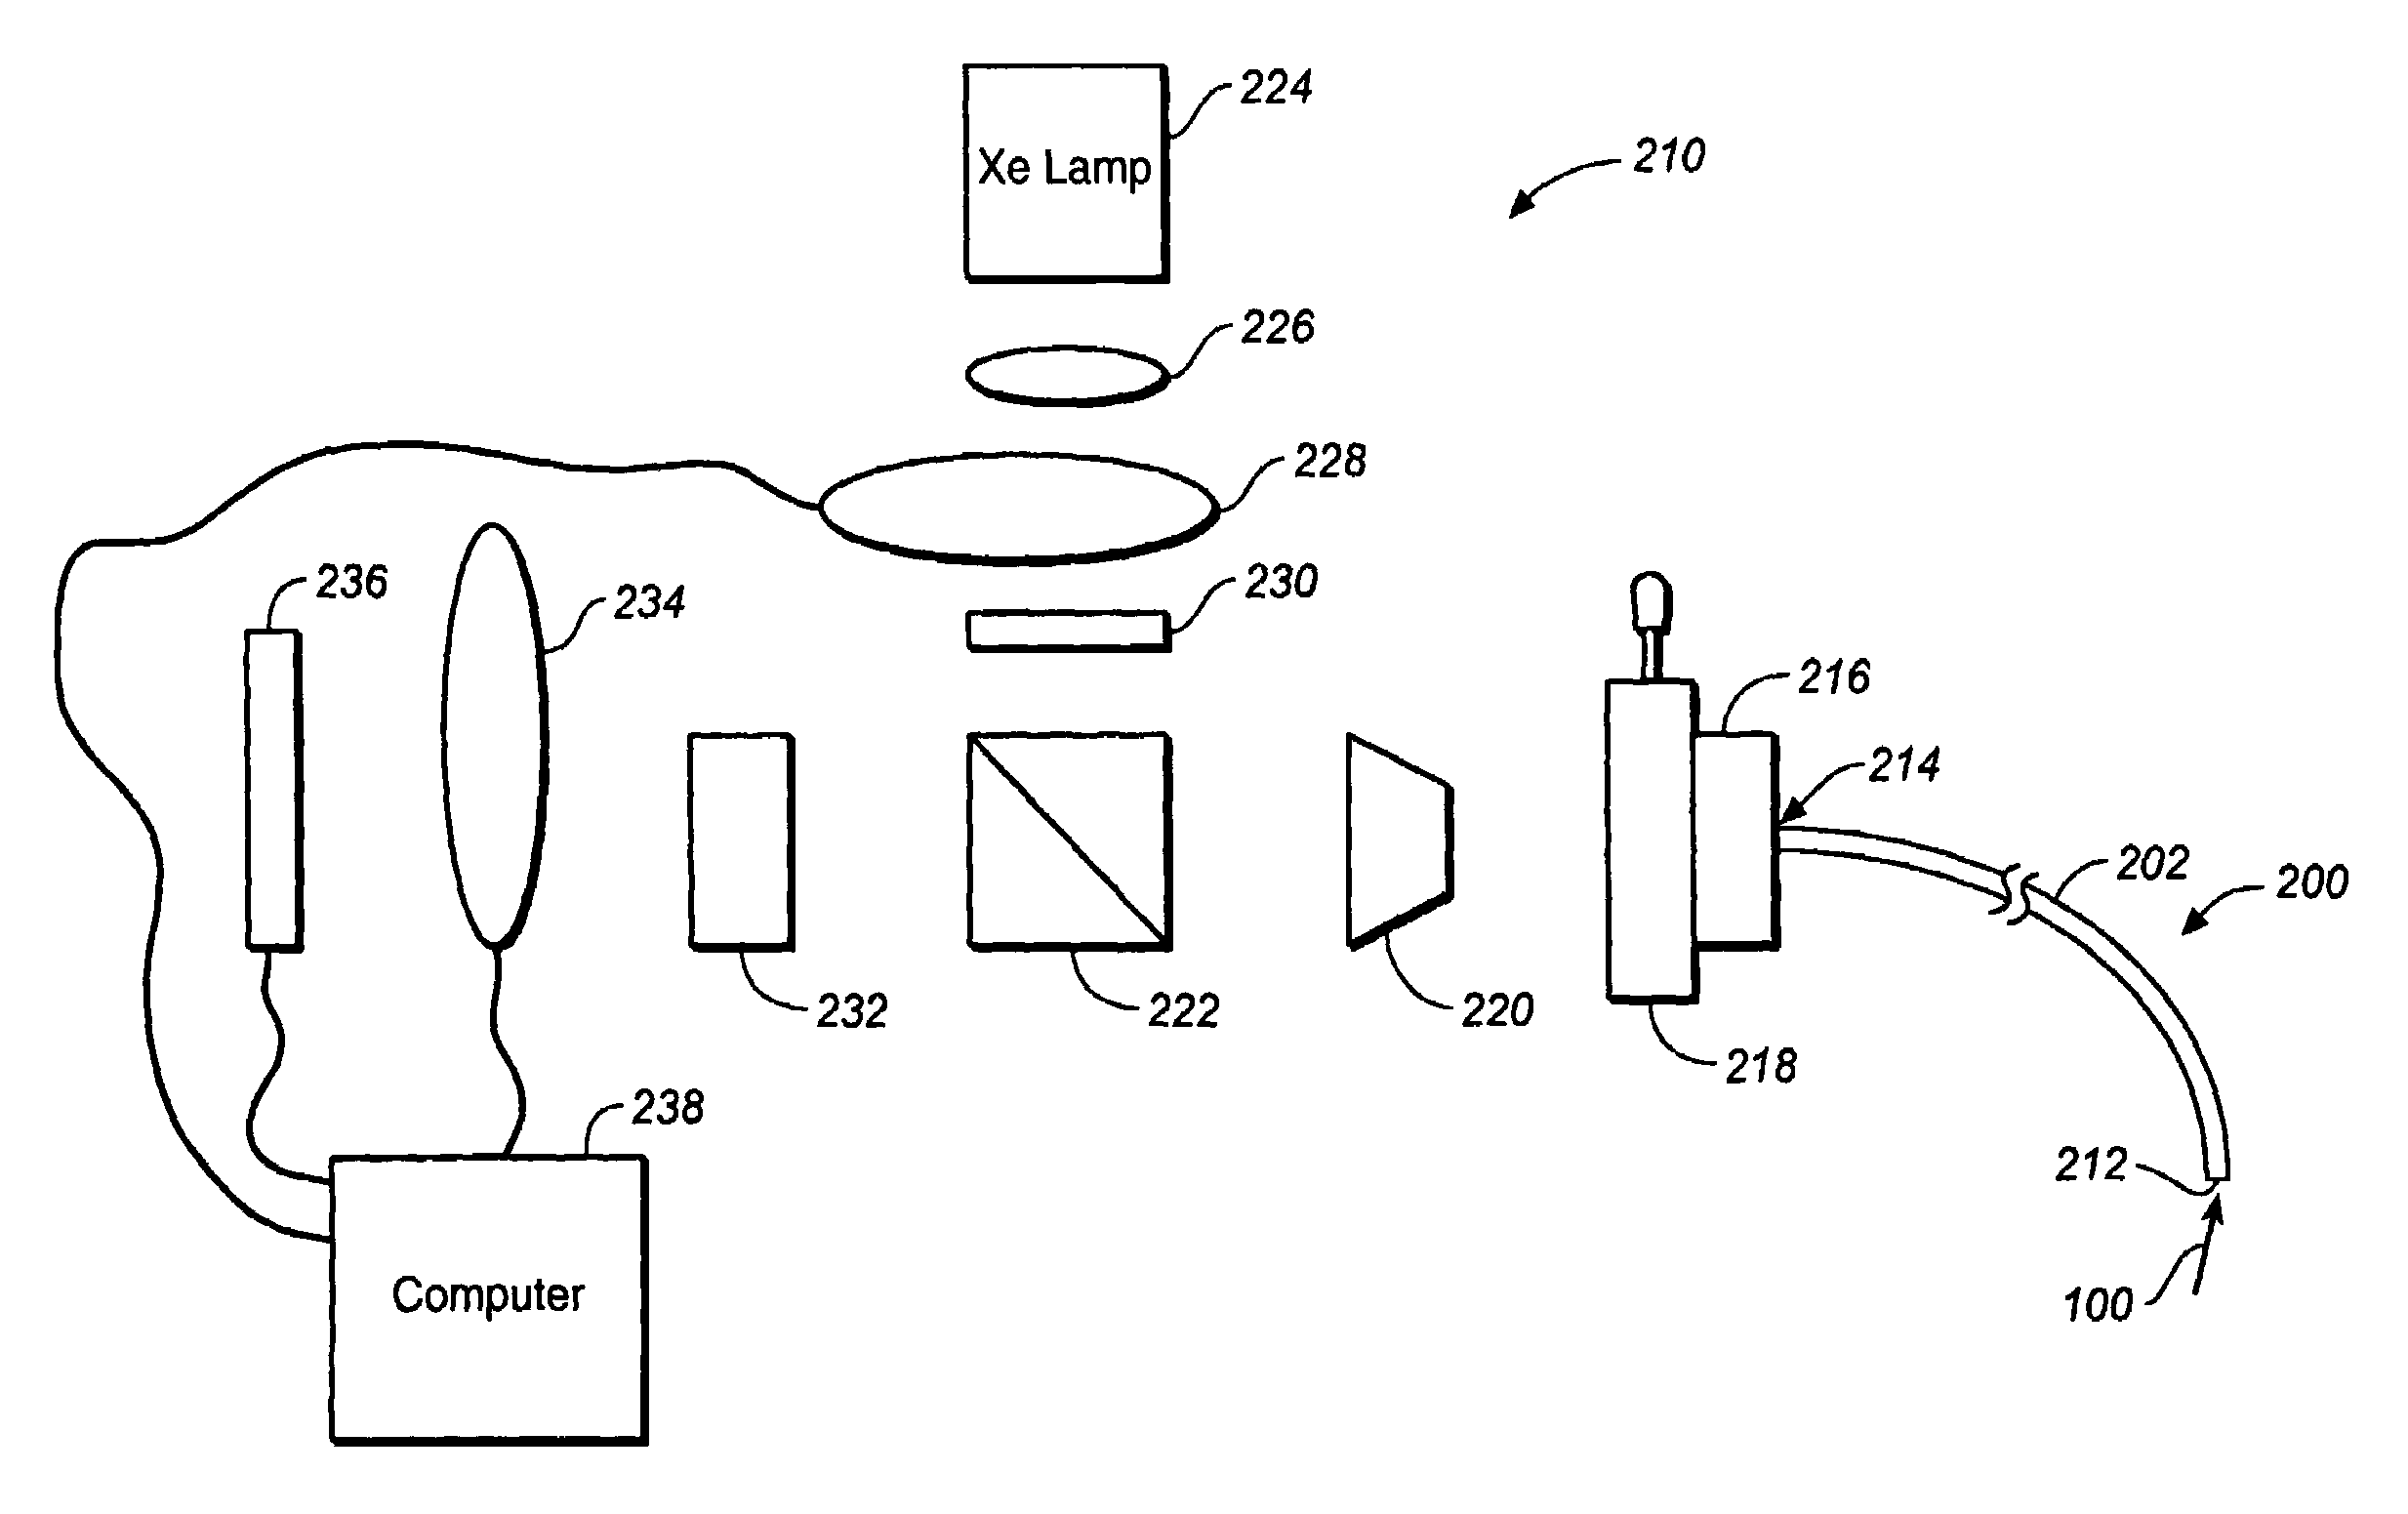
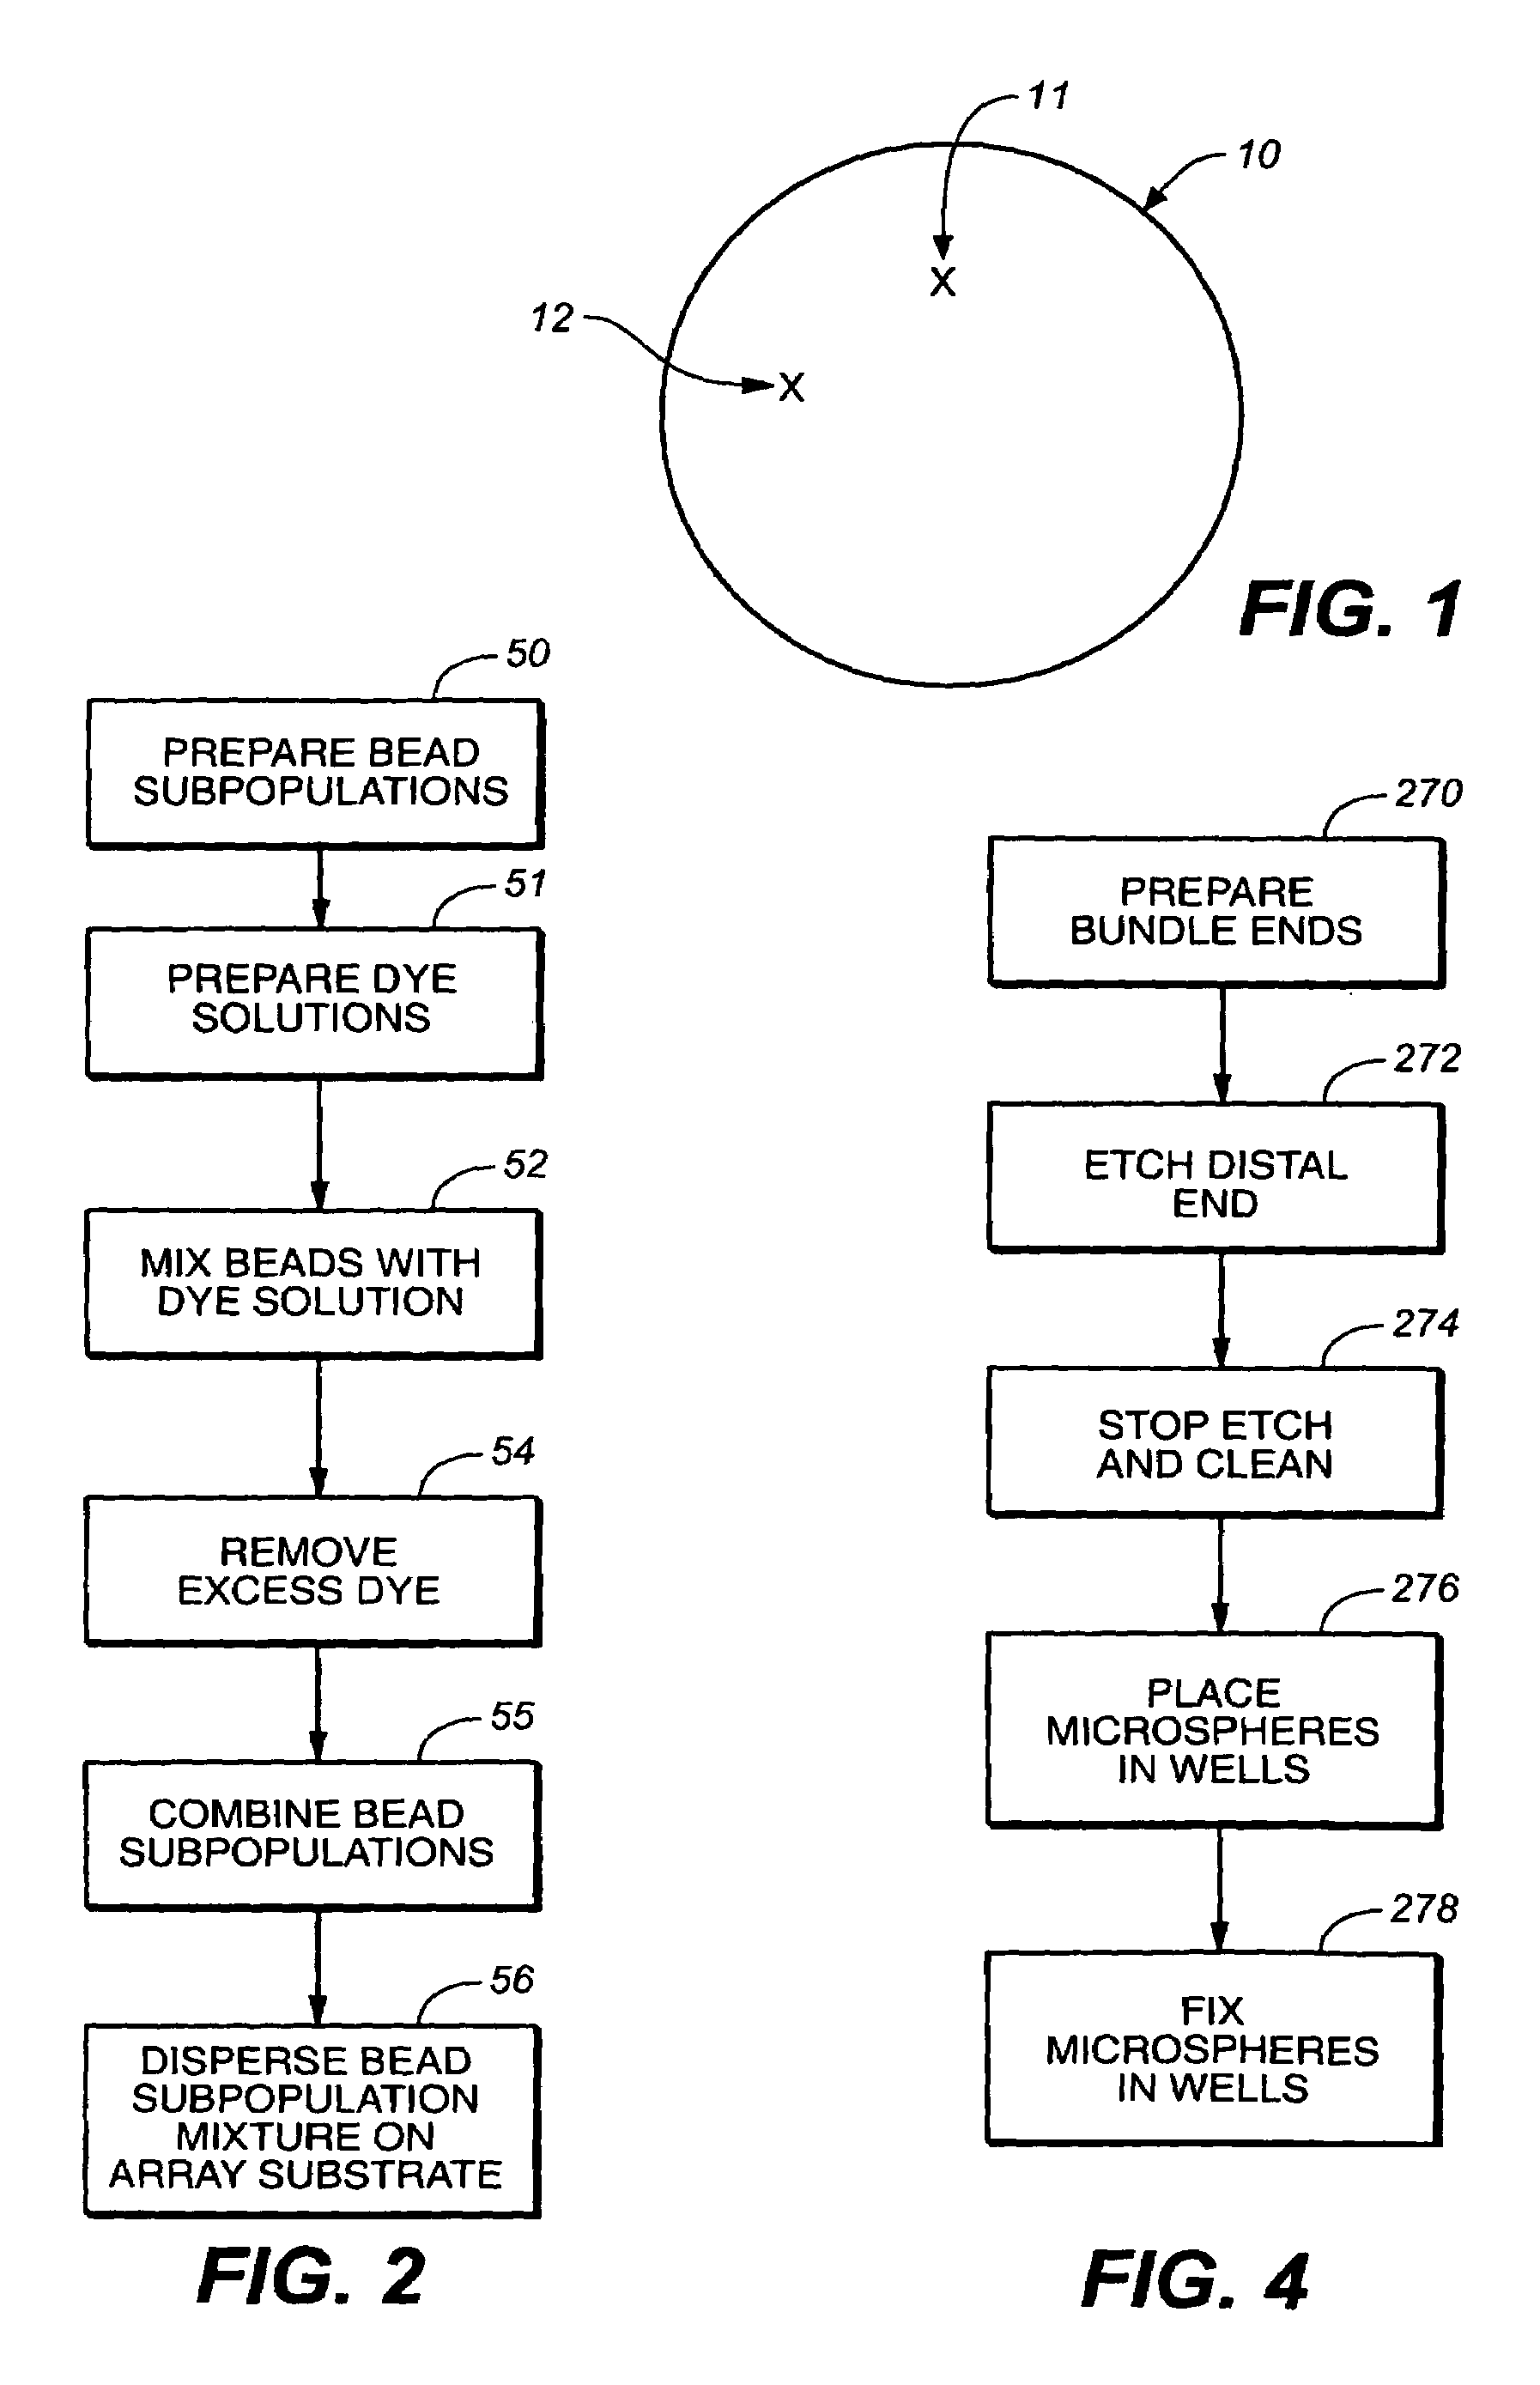
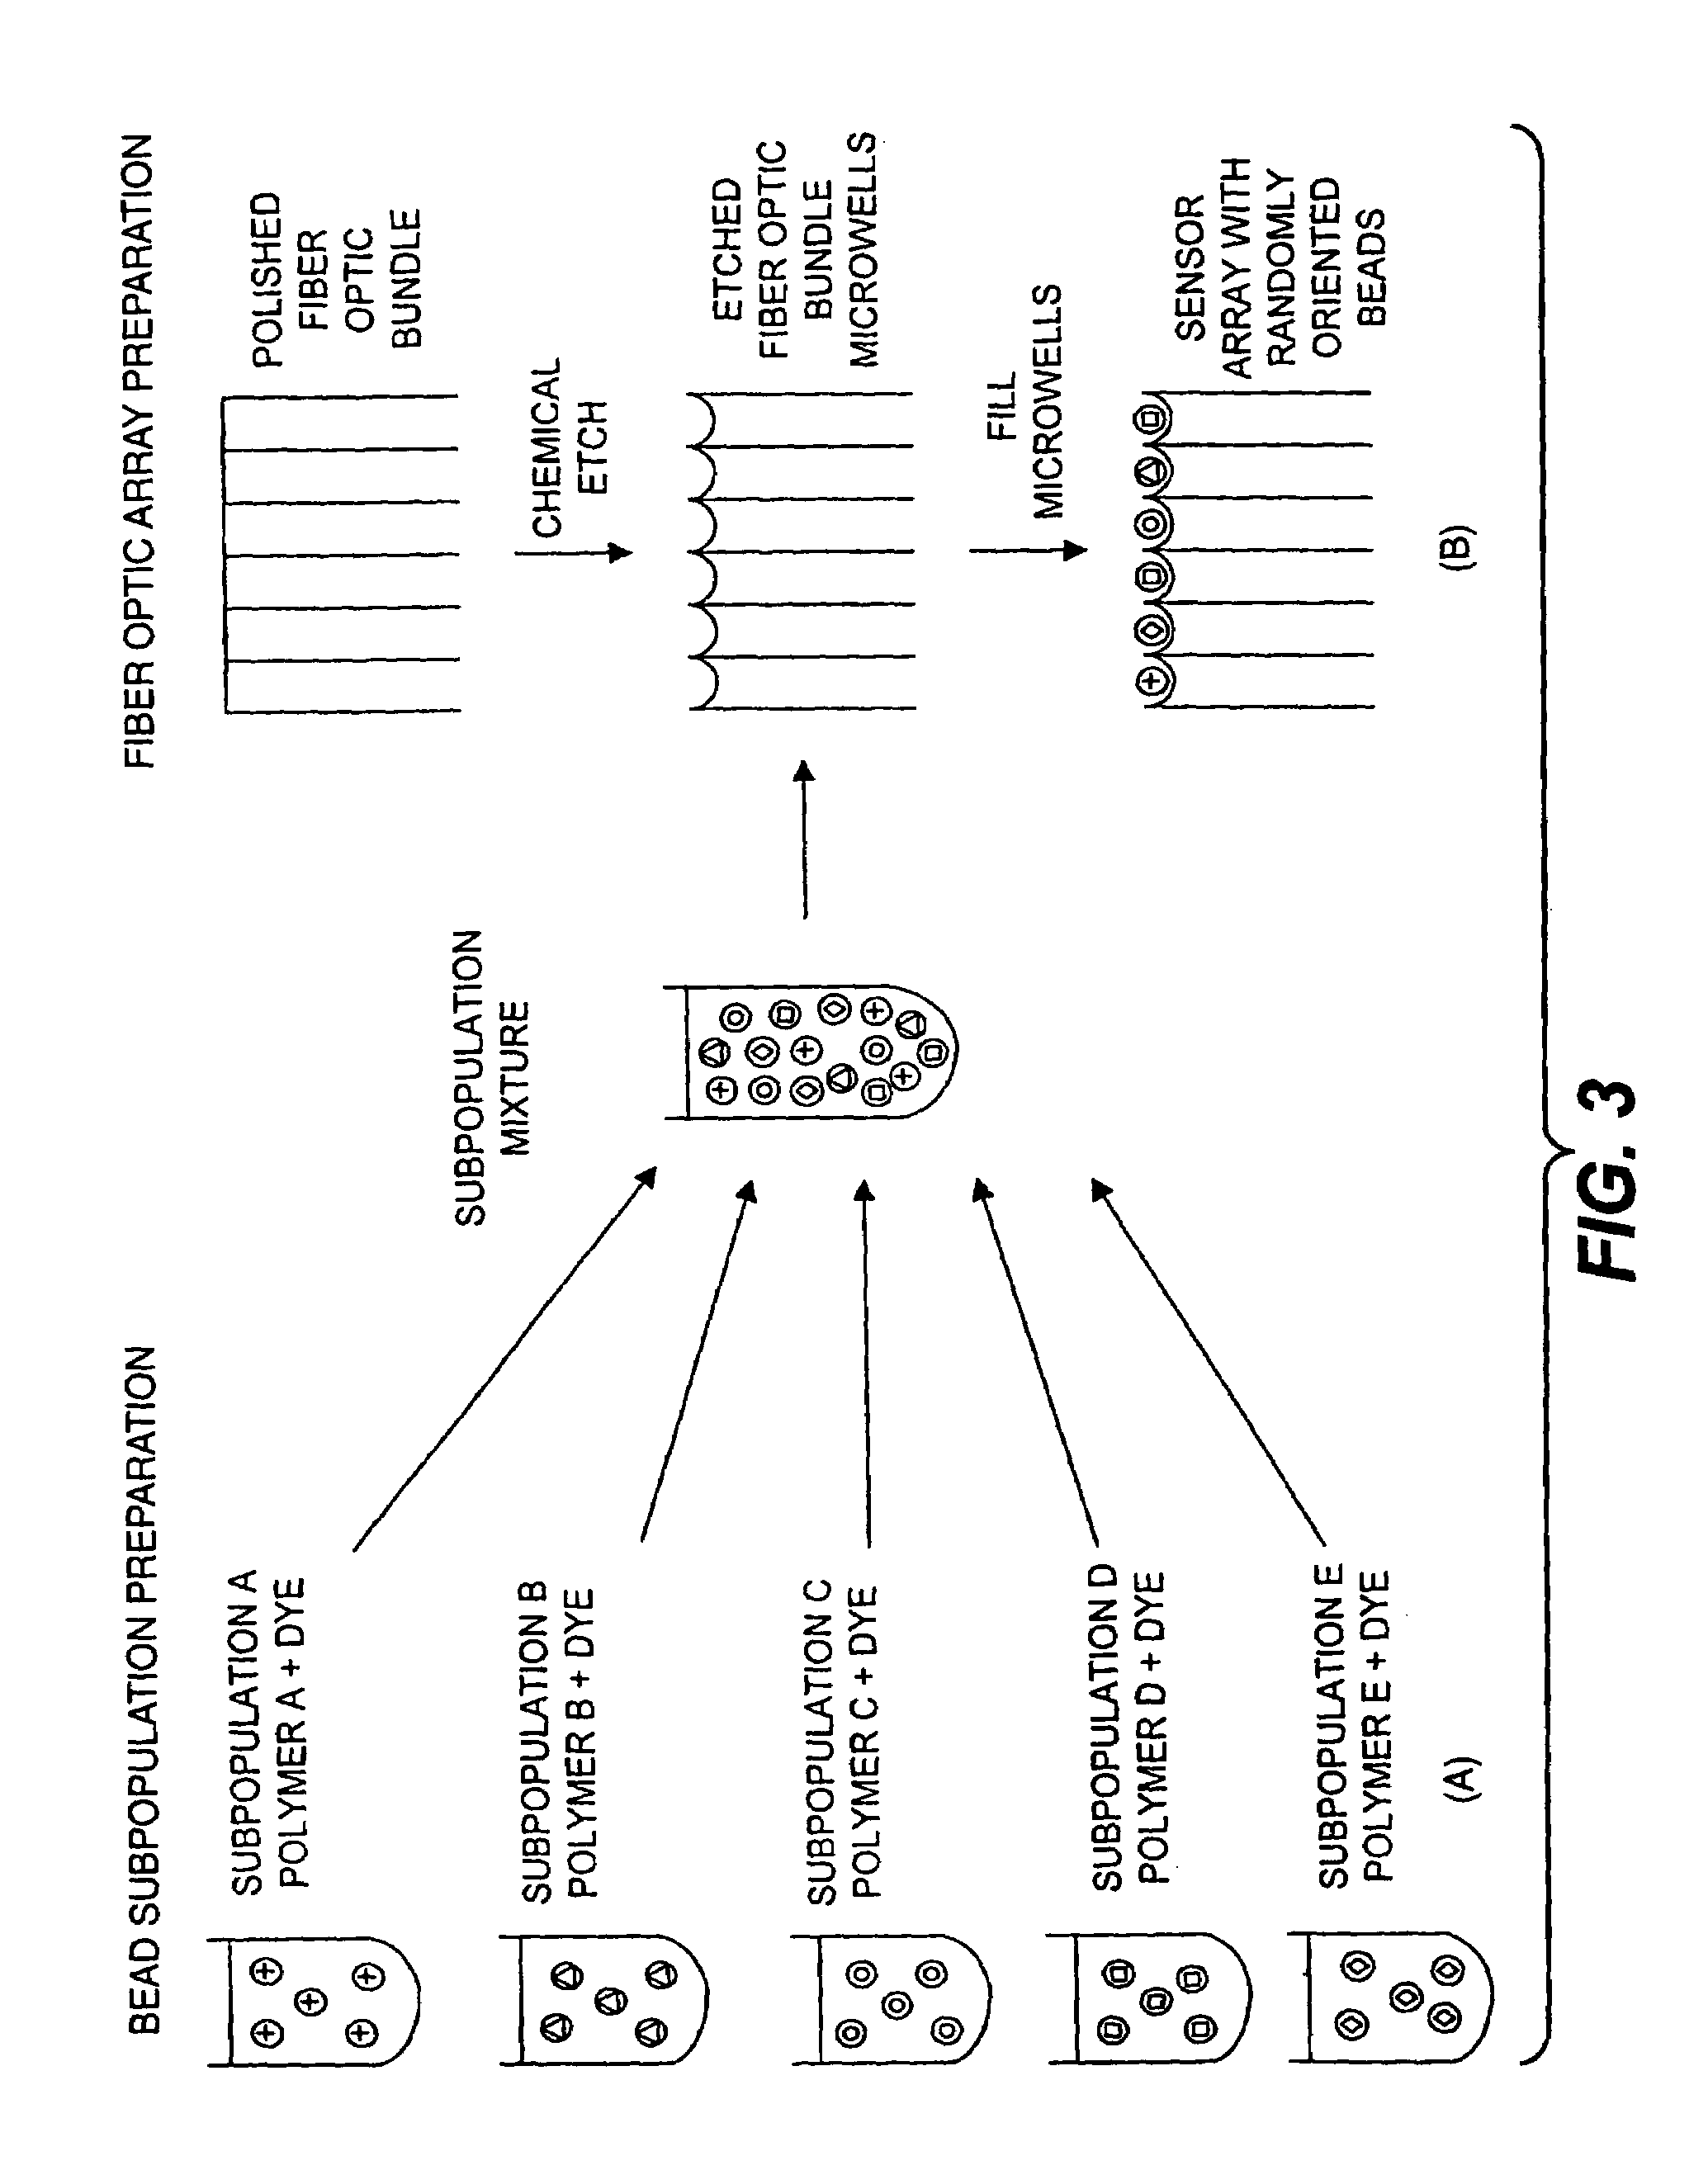
[0098]Approximately 0.5 cm3 of nominally 3.2 micro meters diameter commercial porous silica beads were removed from a LUNA column (Phenomenex, Torrance, Calif.). Sample of beads were placed onto a filter paper and, using vacuum filtration, 0.5 mL of NILE RED dye (Eastman Kodak, Rochester, N.Y.) solution (1 mg / mL in toluene) was poured over beads. NILE RED dye was immediately taken up by silica beads, turning them a deep purple color. The beads were washed repeatedly with toluene to remove any excess, non-adsorbed NILE RED dye. The beads were dried on a watch glass overnight. Beads were then placed into microwells formed by etching a fiber optic bundle according to the method of the present invention.

example 2

Preparation of PDPO Polymer Coated Porous Silica Beads:

[0099]A silanizing solution was prepared from 20 μL N-octadecyl-triethyoxysilane in 980 μL of ethanol / water (95% ethanol, 5% ultrapure water with pH adjusted to 4.9 with acetic acid). The LUNA porous silica beads of Example 1 were dispersed in an excess of silanizing solution for approximately 10 minutes, vortexing continuously. The particles were rinsed three times with ethanol and dried in a 120° C. oven, overnight for approximately 12 hours.

[0100]Stock solution of PDPO, poly(2,6-dimethyl-1,4-phenylene oxide),(Aldrich, Milwaukee, Wis.) and Nile Red was prepared from 0.09 g PDPO and 1.0 mL chloroform. After complete dissolution of the polymer, a 100 μL aliquot of 1 mg / mL NILE RED dye in chloroform was added. The resultant solution was vortexed continuously for uniform dispersion.

[0101]Excess PDPO / NILE RED dye was added to a small fraction of the silanized porous beads, approximately 100 μL polymer / dye solution to approximately ...

example 3

Preparation of Non-Porous Silica / NILE RED Dye Beads Coated With Polysiloxane Polymer:

[0102]Commercially available non-porous 3.1 Nm silica beads (Bangs Laboratory, Fishers, Ind.) were first silanized in excess silanizing solution, a 10% solution by volume of 3-(trimethoxysilyl)propyl methacrylate (Aldrich, Milwaukee, Wis.) in acetone, overnight. Excess silanizing solution was decanted and the beads were rinsed repeatedly, two to three times, with ultrapure acetone, vortexing and centrifuging between washes. The beads were soaked in excess NILE RED dye solution (1 mg / ml in toluene) for approximately 3 hours while vortexing so as to fully saturate the surface. The bead solution was centrifuged and excess dye solution was decanted. A mixture of 7.9 mg benzoin ethyl ether (Polysciences Inc., Warrington, Pa.), 250 microliters stock Ni RED dye in toluene and 250 microliters (15–20% acryloxypropyl-methylsiloxane) 80–85% dimethylsiloxane copolymer (Gelest Inc., Tullytown Pa.) were then adde...


PUM

PropertyMeasurementUnit
sizesaaaaaaaaaa
sizesaaaaaaaaaa
timeaaaaaaaaaa

Abstract

Self-encoding microspheres having distinct characteristic optical response signatures to specific target analytes may be mixed together while the ability is retained to identify the sensor type and location of each sensor in a random dispersion of large numbers of such sensors in a sensor array using an optically interrogatable encoding scheme, resulting in a microsphere-based analytic chemistry system. Individual microsphere sensors are disposed in microwells at a distal end of a fiber bundle and are optically coupled to discrete fibers or groups of fibers within the bundle to form an optical fiber bundle sensor. The identities of the individual sensors in the array are self-encoded by exposing the array to a reference analyte while illuminating the array with excitation light energy. A single sensor array may carry thousands of discrete sensing elements whose combined signal provides for substantial improvements in sensor detection limits, response times and signal-to-noise ratios.

Description

[0001]This invention was made with government support under N00014-94-1-0312 awarded by the Department of the Navy, Office of Naval Research. The government has certain rights in the invention.FIELD OF THE INVENTION[0002]The present invention is generally concerned with chemical sensors, sensor arrays and sensing apparatus for the detection of gaseous and liquid analytes. More particularly, the invention is directed to optical chemical sensors and the detection and evaluation of optical data generated by sensing receptor units.BACKGROUND OF THE INVENTION[0003]The use of optical fibers and optical fiber strands in combination with light absorbing dyes for chemical analytical determinations has undergone rapid development, particularly within the last decade. The use of optical fibers for such purposes and techniques is described by Milanovich et al., “Novel Optical Fiber Techniques For Medical Application”, Proceedings of the SPIE 28th Annual International Technical Symposium On Opti...

Claims


Application Information

Patent Timeline
Patent Type & Authority Patents(United States)
IPC IPC(8): G01N21/64G01N21/62C12M1/34C40B60/14G01N21/77G01N33/00
CPCG01N21/6428G01N21/6452G01N21/7703G01N33/54313G01N33/54373G01N33/54393B01J2219/00317B01J2219/00524B01J2219/00648B01J2219/00659C40B60/14G01N33/0031G01N2021/6484G01N2021/7786
Inventor WALT, DAVID R.DICKINSON, TODD A.
Owner TRUSTEES OF TUFTS COLLEGE
Why Eureka
Try Eureka