
Calibration verification for optical particle analyzers

a technology calibration verification, which is applied in the field of optical particle analyzer calibration verification, can solve the problems of difficult calibration process, high cost, and long total sampling time of over an hour, and achieve the effect of increasing the probability of an instrument being successfully tested and sensitive and accura

Active Publication Date: 2021-11-23
PARTICLE MEASURING SYST
View PDF86 Cites 3 Cited by
  • Summary
  • Abstract
  • Description
  • Claims
  • Application Information

AI Technical Summary

Benefits of technology

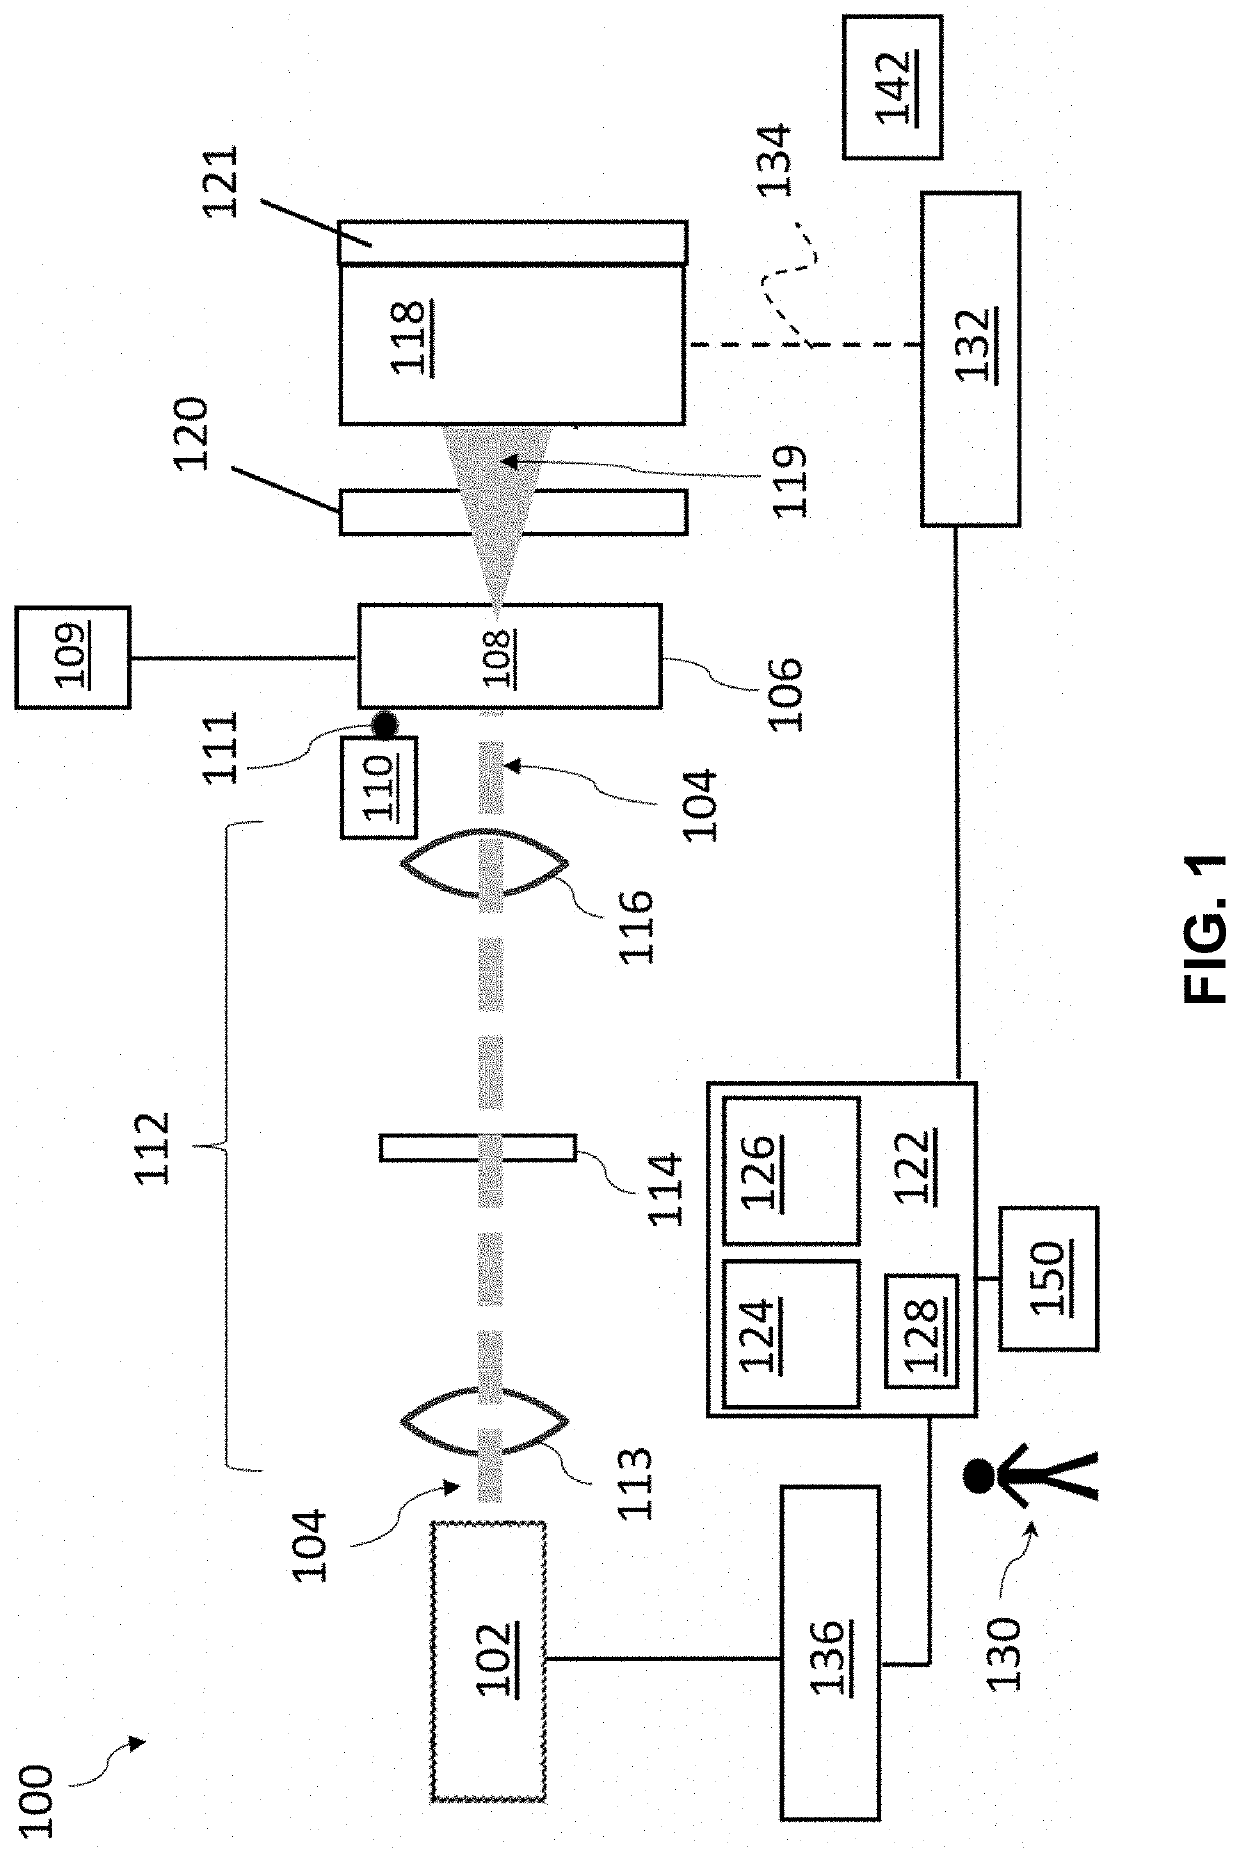
[0016]Disclosed herein are methods and systems enabling self-diagnostic features to verify calibration status for optical particle analyzers, including determining components' functional health, such as for the responsivity of the photo-detector and subsequent amplification circuitry, amount of laser pulse light collected by the collecting optics, scattered particle light collecting optics output, and laser power level. Verifying optical particle analyzer calibration status and determining components' functional health may be accomplished by cycling (e.g., modulating) laser power and then detecting particle gain stage pulse activity on high gain detector circuit (e.g., referred to herein as amplification circuitry). By modulating applied laser power (e.g., a single cycle of which may be referred to as a “check pulse” herein), and the detecting particle gain stage AC coupling pulse activity on the high gain detector circuit (e.g., the amplification circuitry), the disclosed systems and methods are sensitive and accurate. The disclosed systems and methods may be implemented as a calibration verification self-diagnostic system for optical particle analyzer instruments, and they may be used to increase the probability of an instrument successfully completing as-found calibration verification at the end of its calibration use cycle (e.g., annual).

Problems solved by technology

The calibration process for an optical particle analyzer is complicated and usually requires trained representatives from the optical particle analyzer manufacturer to perform the calibration.
This test is very time consuming and may require an extended total sampling time of over an hour.
A full optical particle analyzer calibration is complicated and, thus, generally must be performed by a trained representative from the particle analyzer manufacturer.
A full calibration typically requires a large amount of test equipment which is not portable.
If an aerosol optical particle analyzer drifts out of calibration in one of these clean areas, the particle analyzer may over- or under-count the particle level in the clean area.
If the particle analyzer is under-counting, the clean area may be dirtier than the user believes.
In a worst case scenario, the user may experience a drop off in wafer yield due to this undetected particle contamination.
An out of calibration particle analyzer also presents significant problems to a pharmaceutical user.
If a particle analyzer is under-counting, the clean process area may be dirtier than the user believes.
For example, if a liquid source includes particle levels higher than expected, this may result in an end product, of which this liquid which is a component, having contamination levels higher than expected.
As above, this may pose a significant problem, for example if the end product is a pharmaceutical composition.
Alternatively, if the liquid is utilized, for example, as a rinse, wash or solvent during the processing of a semiconductor device, particle contamination of the semiconductor device may result, resulting in decreased semiconductor device yield.
If it is determined that the particle analyzer sufficiently under-counted so as to place the actual clean area it monitored above the allowed FDA specified contamination limit, all product produced in that area for the entire year becomes suspect.
Optical particle analyzers may become mis-calibrated for a number of reasons including drift in the detection electronics; such a mis-calibrated particle analyzer may still properly count the total number of particles but may misidentify the real sizes of particles.

Method used


Image

  • Calibration verification for optical particle analyzers
  • Calibration verification for optical particle analyzers
  • Calibration verification for optical particle analyzers

Examples


example 1

[0123]Check Pulses Effectiveness Investigation

[0124]An IsoAir®-310P instrument equipped with the laser as the source of EMR 102 (30 mW laser power) was used as a test instrument to perform the following experiments in Example 1 to determine what percentage of post-Bessel filter laser-on pulse is derived from light collection mirrors and what percentage is derived from a source other than the mirrors.

[0125]FIGS. 7A-7C are plots of detector signal waveforms for Example 1 of the disclosure. The plots shown in FIGS. 7A-7C depict detector signal waveforms for three laser-on pulses with mirrors (2.0Vp). As shown by the plots of FIGS. 7A-7C, the three measured laser power-up pulses indicate a stable and repeatable peak value of 2.0 Vdc and a laser power-up event rise-time of approximately 1.25 ms.

[0126]FIGS. 8A-8C are plots of detector signal waveforms for Example 1 of the disclosure. The plots shown in FIGS. 8A-8C depict detector signal waveforms for three laser-on pulses with black paint...

example 2

[0130]Study of Allowed LASAIR-IV Signal Loss to Maintain Passing as-Found Calibration Results

[0131]Example 2 was a study of a manufacturing cell calibration program data-base typical first channel size resolution results calculated for each instrument model type (Particle Measuring Systems, Inc.). Minimum ISO-21501-4 allowed size error was determined from sizing and counting efficiency as-found test limits. Gaussian distribution sizing distribution size error was then converted to amplitude error by applying the LASAIR-III theoretical sizing calculations. The final result was calculated to represent the maximum amount of particle signal loss that could be observed while the instrument would theoretically pass the as-found calibration requirements of ISO-21501-4.

[0132]Summary table of Example 2 study results:

[0133]

First30%30%CH# of10%C.E.C.E.FirstSizeUnitsSizeSizeSizeAmplitudeInstCHResinErrorErrorErrorErrorModelSizeStudyStudyLimitLimitLimitLimit310C0.3um7.4%147730nm12.1nm4.0%20.2%310...

example 3

[0136]Description of Detector Board Low Speed, Check Pulses, Peak and Hold ADC Circuit

[0137]FIG. 11 is a schematic diagram (LT-Spice) of a frequency-tuned closed loop peak and hold circuit with reset 1900 in accordance with an embodiment of the disclosure.

[0138]Stage 1 of circuit 1900: Voltage gain amplifier with bandwidth limiting (Q=4.0). Allows gain scaling and low pass filtering of check pulses signal. Signal originated from the high gain Bessel filter output. Primary components: (1 stage) AD8034 FET op amp, + / −12Vdc PS.

[0139]Stages 2 & 3 of circuit 1900: Classical closed-loop peak-and-hold circuit, with reset feature. Primary components: (2 stages) AD8034 FET op amp, (1) PMEG3002AEB Schottky Barrier diode, hold charge capacitor, isolation resistor to buffer first amp output from charge capacitor, ADG1402 and ADG1401 CMOS SPST peak-and-hold reset switches, SN65LVDS2DBVR differential line receiver to drive reset switches from main PCB, isolation resistor to buffer switch from cha...


PUM

PropertyMeasurementUnit
timeaaaaaaaaaa
wavelengthsaaaaaaaaaa

Abstract

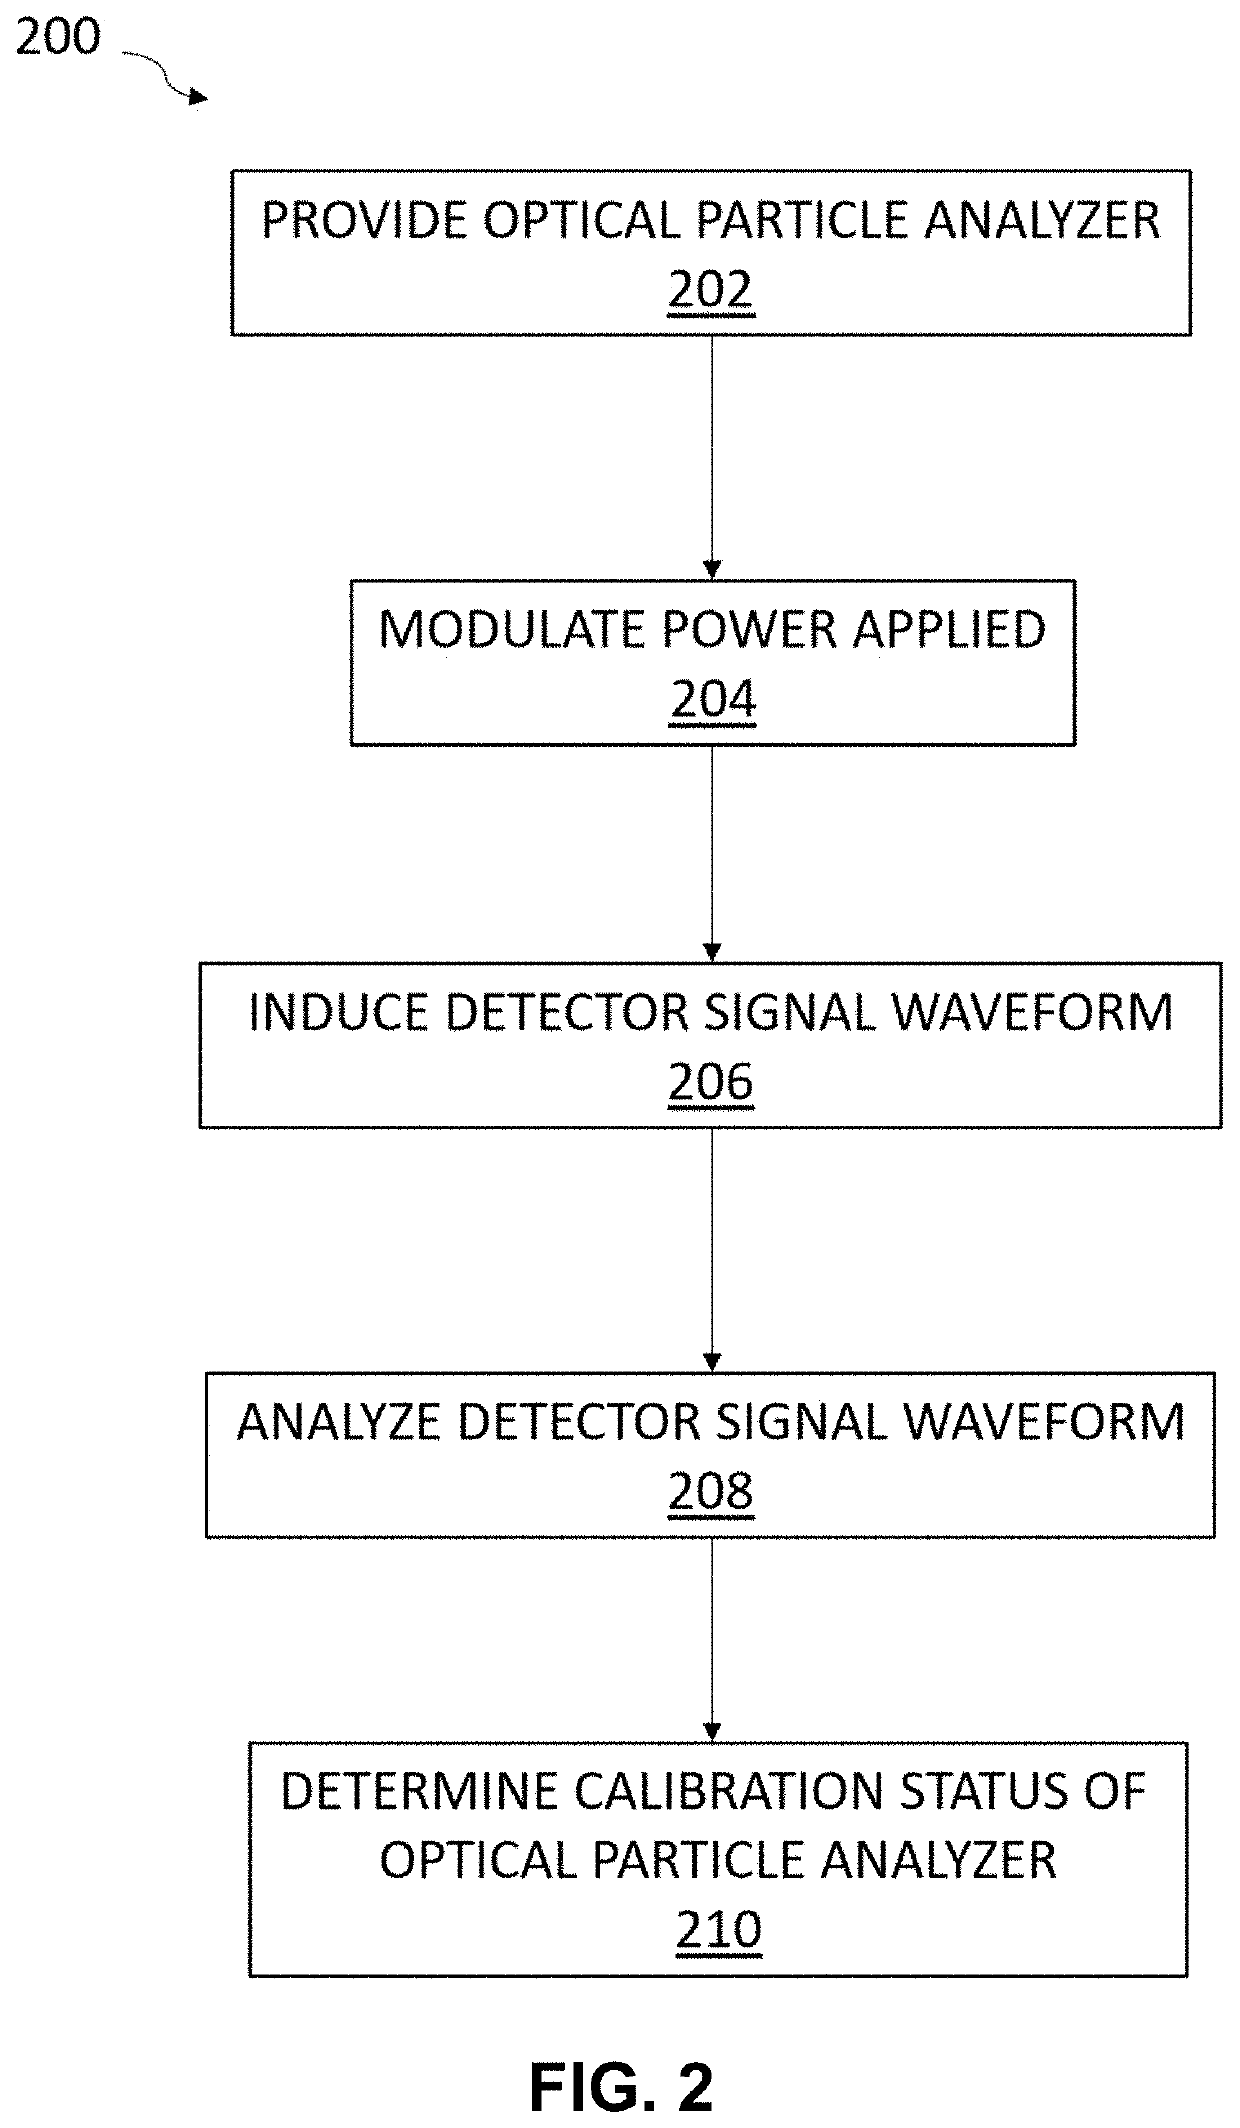
Provided are particle analyzers and related methods for verifying calibration status of the particle analyzer. The method includes the steps of providing an optical particle analyzer and modulating a power applied to a source of EMR. The method includes the steps of, in response to the modulating step, inducing a detector signal waveform and analyzing the detector signal waveform to determine a value of at least one diagnostic parameter associated with one or more of the source of EMR, an optical assembly, a chamber, a detector, and an optical collection system of the optical particle analyzer. The method includes the step of determining a calibration status of the optical particle analyzer based on the one or more determined values of the at least one diagnostic parameter.

Description

CROSS-REFERENCE TO RELATED APPLICATIONS[0001]This application claims the benefit of priority to U.S. Provisional Patent Application No. 62 / 759,953, filed Nov. 12, 2018 which is hereby incorporated by reference in its entirety.BACKGROUND OF INVENTION[0002]This invention is in the field of optical particle analyzers. This invention relates generally to calibration verification systems and methods for verifying the calibration status and performance of optical particle analyzers.[0003]A large portion of the micro-contamination industry is reliant on the use of optical particle analyzers, such as are described in various U.S. patents, including U.S. Pat. Nos. 3,851,169, 4,348,111, 4,957,363, 5,085,500, 5,121,988, 5,467,188, 5,642,193, 5,864,399, 5,920,388, 5,946,092, and 7,053,783. 4,728,190, 6,859,277, and 7,030,980, also disclose optical particle analyzers and are hereby incorporated by reference in their entirety. Aerosol optical particle analyzers are used to measure air-borne parti...

Claims


Application Information

Patent Timeline
Patent Type & Authority Patents(United States)
IPC IPC(8): G01N15/02G01N15/06H01S3/00
CPCG01N15/0205G01N15/0612H01S3/0007G01N2015/0693G01N2015/0046G01N15/1459G01N15/1012
Inventor BATES, THOMAS A.MICHAELIS, MATTHALEY, BRETT
Owner PARTICLE MEASURING SYST
Learn More