
Apparatus and methods for analyzing and improving agricultural products

a technology for agricultural products and apparatus, applied in the field of agricultural products analysis devices and methods, can solve the problems of poor signal-to-noise, inability to distinguish characteristics of individual seeds, and offer a poor approach for single-seed analysis, etc., to achieve the effect of reducing sample size, reducing processing costs, and reducing processing costs

Inactive Publication Date: 2006-06-01
MONSANTO TECH LLC
View PDF1 Cites 64 Cited by
  • Summary
  • Abstract
  • Description
  • Claims
  • Application Information

AI Technical Summary

Benefits of technology

[0026] The present invention includes and provides a method for optimizing the field-of-view parameters and gradients in a magnetic resonance imaging instrument used to measure characteristics of a sample comprising seeds, comprising: (A) selecting a field of view that covers the entire sample; (B) selecting a number of image layers; (C) selecting an image layer thickness; (D) selecting a number of image pixels within each image layer, wherein the number of image layers multiplied by the image layer thickness is greater than about the height of the sample to be imaged, the image layer thickness is less than about the thickness of the seeds, and the number of image pixels is sufficient to prevent inter-pixel crosstalk.

Problems solved by technology

Non-imaging NMR-based technology for measuring characteristics such as oil content in intact seeds requires measurement of bulk samples and is unable to distinguish characteristics of individual seeds.
But low-field NMR methods are performed at low magnetic field strengths, which yields poor signal-to-noise relative to the MRI experiment, and consequently, these methods offer a poor approach for single-seed analysis.
However, absolute oil numbers have been shown to be less precise for comparing relative oil levels between seeds.
These instruments typically have a bore size of a few centimeters, and consequently can only be used to study samples that are smaller than the bore size.
But the larger diameter detection coils in traditional superconducting instruments, as well as newer permanent magnet systems, make these clinical instruments ill-suited for imaging small samples such as seeds.
The large distance of the detection coils from a small sample and the inherently weak signal emanating from a small sample conspire to make conventional approaches to quantitative imaging of small samples using clinical MRI instruments impractical.
But the small volumes of small bore size research MRI instruments do not allow the simultaneous imaging of as many seeds as a clinical MRI instrument would allow if the larger MRI instruments were amenable to detecting signals from small samples.
Conventional non-invasive methods for bulk seed analysis, such as infrared (IR) spectroscopy, suffer from the disadvantage of being rather time-intensive and producing results that may not be fairly representative of the sample analyzed.
Time-intensive techniques for finding desirable characteristics are especially disadvantageous to selective plant breeding programs, where many single seeds need to be screened rapidly in order to allow seed selection before the next planting generation.
Delays in providing the breeder with the analytical results can cause the loss of an entire breeding cycle.
Non-imaging techniques such as IR spectroscopy suffer from the further disadvantage of collecting information from only a subset of a total sample by spot sampling only portions of only a few seeds out of the hundreds of seeds in the bulk sample.
Furthermore, since spot sampling interrogates arbitrary portions of the seed, different tissues of the seeds in the samples can be misrepresented by the analytical data.
Since qualities like oil content are often present in different amounts in different tissues, non-imaging techniques can fail to accurately assess the desired quality.
Non-imaging techniques disregard spatial information, and thus provide no information to a plant breeder about the size, shape, mechanical damage, insect infestation, or fungal damage.
Conventional seed analysis techniques also fail to provide an efficient method for single seed analysis, which can greatly accelerate the rate of varietal development.
Other conventional analytical techniques, such as gas chromatography, also often fail to provide an efficient method for single seed analysis.
Because of the manual sample preparation and the low throughput of this analytical technique, only a small number of samples can be run per hour using this process.
Furthermore, this technique allows for the possibility of destroying analyzed seeds' potentials to grow into mature, seed bearing plants.
Although single seed analysis is desirable, conventional approaches and sampling methods do not allow for efficient processing of single seeds.
Conventional techniques require extensive manual input, which limits the rate of development of plants with improved characteristics.
Conventional spectroscopic analysis techniques do not allow for the localization of chemical component levels within different tissues of seeds.
Conventional approaches, such as manual dissection of the seed followed by chemical analysis by traditional analytical techniques, are not only laborious and destructive, they also result in poor resolution of the components and poor quantitation, since the sample size resulting from dissection of individual seeds is below the sample size at which most traditional techniques produce reliable results.

Method used


Image

  • Apparatus and methods for analyzing and improving agricultural products
  • Apparatus and methods for analyzing and improving agricultural products
  • Apparatus and methods for analyzing and improving agricultural products

Examples


example 1

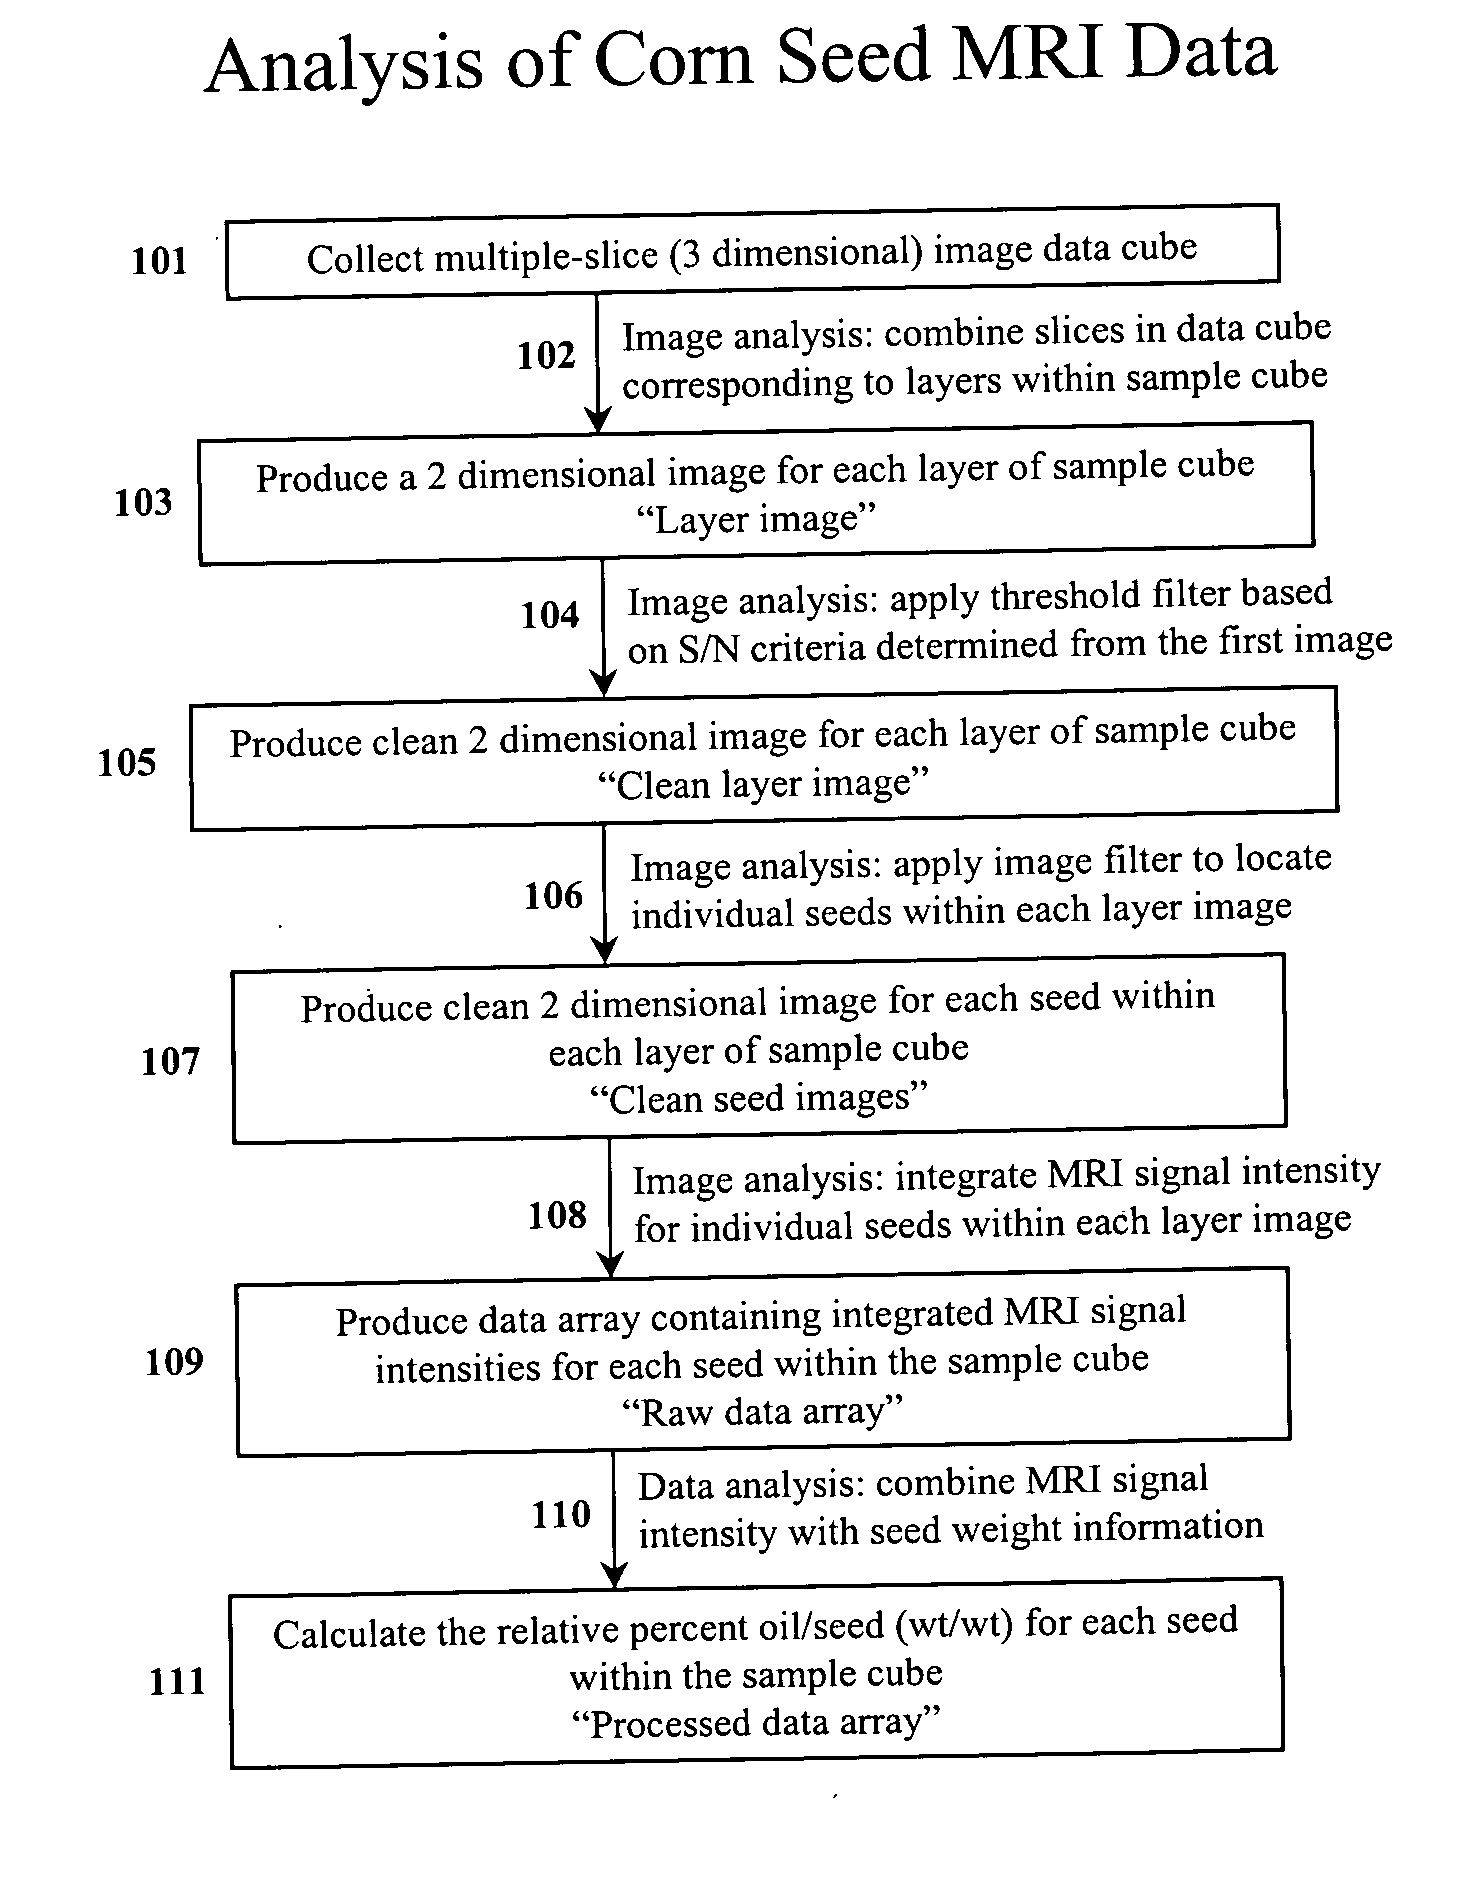
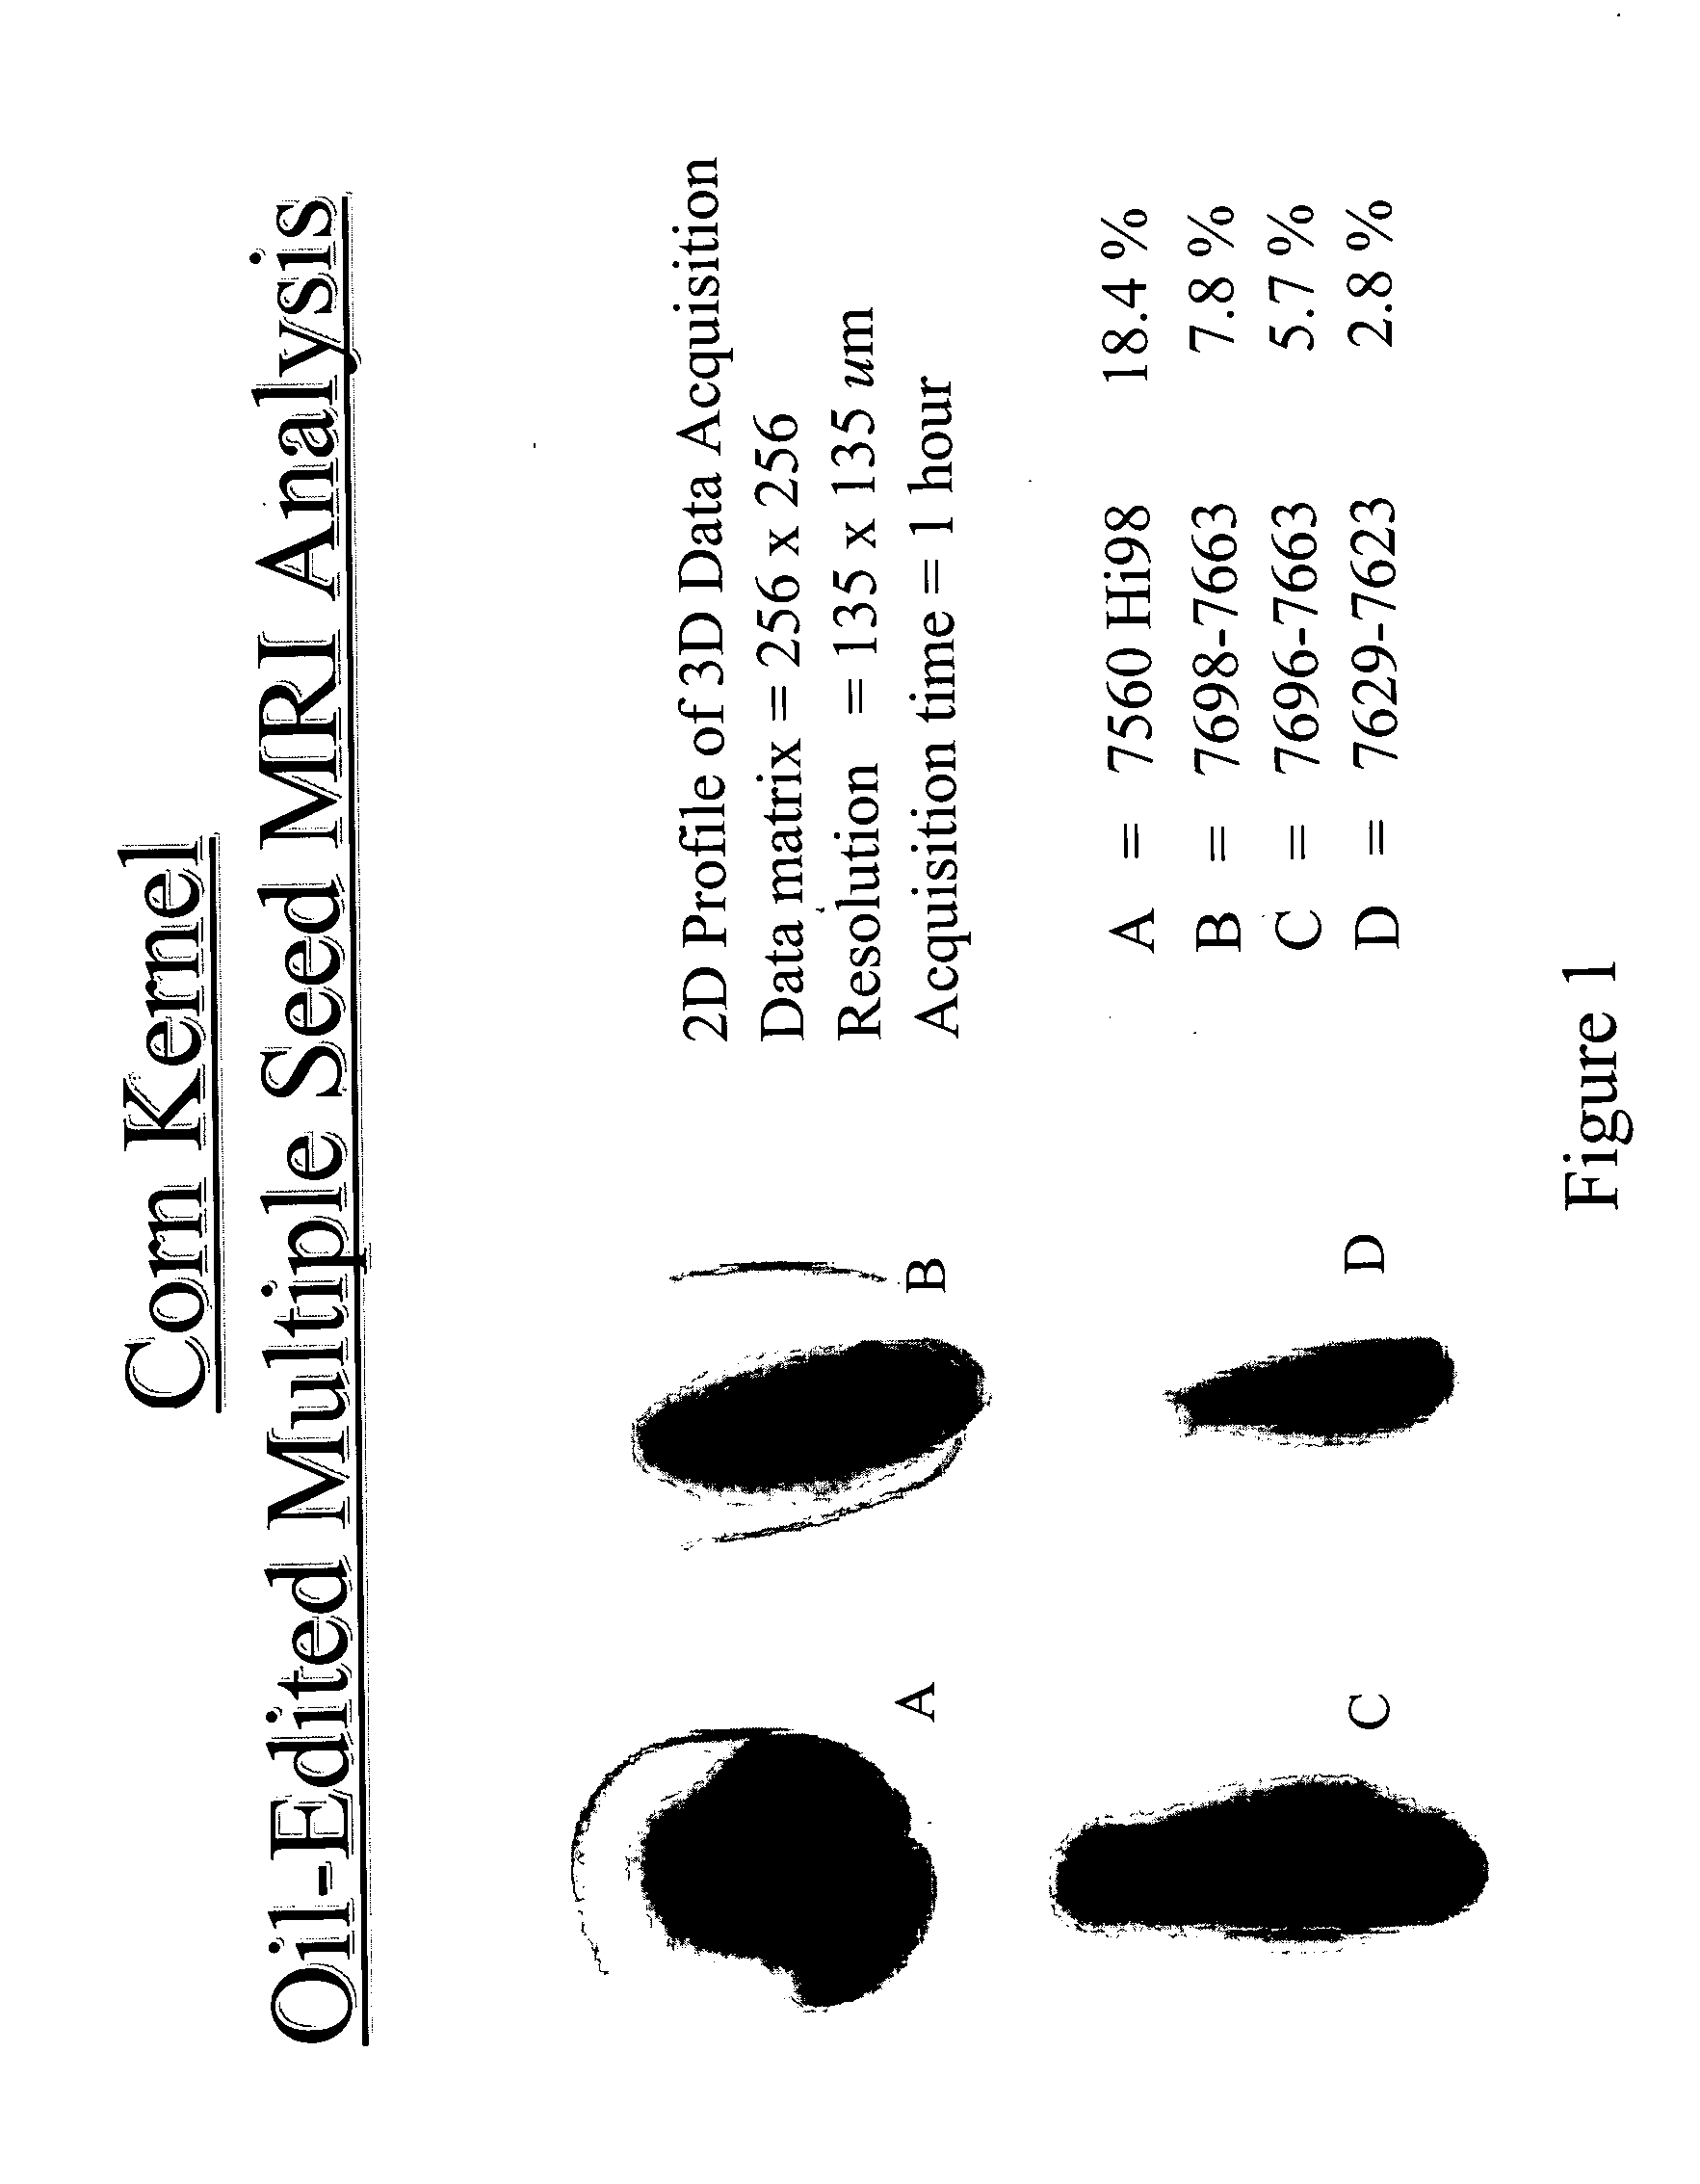
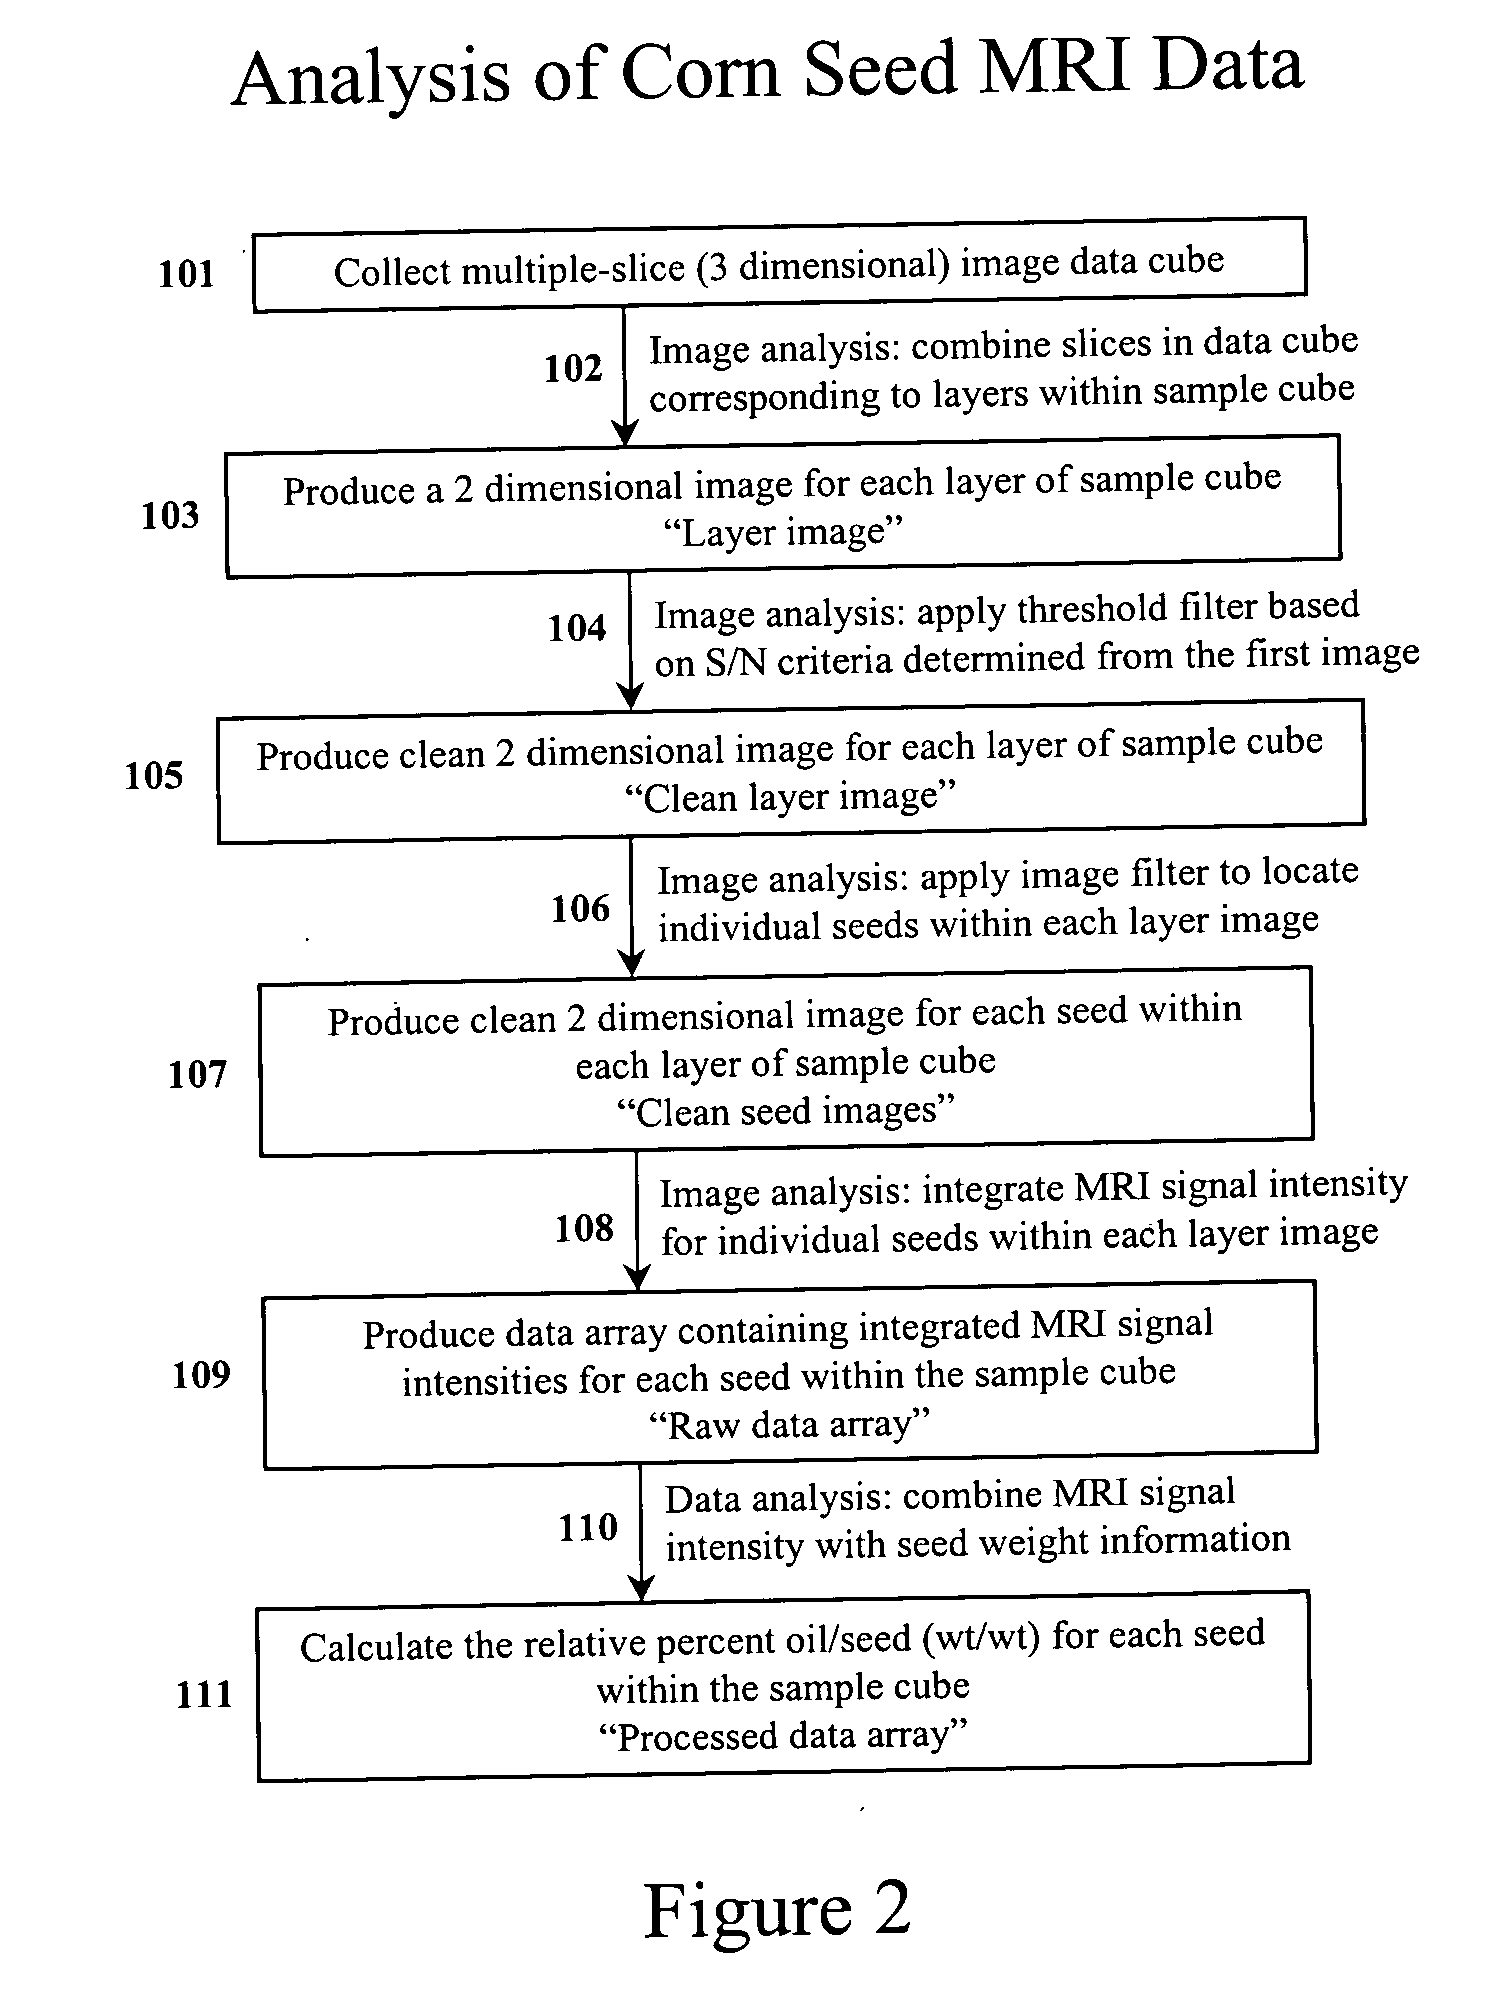
[0111] Images of corn kernels are obtained using a 1.5 tesla Magnetom™ Vision MR scanner (Siemens, Erlangen) using the standard whole-body resonator. The gradient strength is set to 25 mT / m on all axes. With the gradient booster, the full strength ramp time was 312 μs. The full gradient capabilities of the gradient set are not used in the seed imaging sequence. A spin-echo sequence is used (tr / te=1920 / 17 ms) with an excitation flip angle of 90° and refocussing flip angle of 180°. The receiver bandwidth is 130 Hz / pixel. The field-of-view is set to 450×450 mm. The data matrix obtained is 256×256. The images obtained from each sample cube consist of 50 contiguous coronal slices, acquired using the interleaved option, positioned so that there is at least one non-sample-bearing slice between each layer of samples in the cube. For the corn oil calibration standards, two scans are obtained, with the receiver gain set to 97.98 dB, and FFT scale factor set to 0.1. For the corn-seed samples, ...

example 2

[0118] 48-well sample trays are loaded with oil seeds including corn, soybean, and canola. Two stacks of 5 plates containing individual seeds are placed in plexiglass sample holders to make an array comprising a total of 480 seeds. An array of seeds is inserted into a commercially available MRI detection coil that is large enough to accommodate the sample holder. An MRI coil containing the seeds is inserted into the MRI magnet for data collection using standard, non-proprietary data acquisition techniques. MRI data is sent to a computer, where it is processed using a custom macro in Varian ImageBrowser™ (Varian, Inc., Palo Alto, Calif.) software to obtain MRI signal intensities for each of the individual corn kernels in the sample. The resulting data is used to calculate the percentage of oil by weight in each of the 480 seeds within the sample.

example 3

[0119] A 1.5 tesla clinical grade MRI scanner is used to analyze a sample of 3456 seeds organized in 12 layers of 12 24-well trays. The experiment is conducted according to the protocol set forth in Example 2, above.


PUM


Abstract

The present invention relates to a device and method for analyzing agricultural products. More particularly, the present invention relates to a device and method for rapid, non-destructive analysis of the physical and chemical characteristics of one or more seeds.

Description

FIELD OF THE INVENTION [0001] The present invention relates to devices and methods for analyzing agricultural products. More particularly, the present invention relates to devices and methods for rapid, non-destructive analysis of the physical and chemical characteristics of one or more seeds, and methods for breeding plants to produce new plants with desirable physical and chemical characteristics. BACKGROUND OF THE INVENTION [0002] Breeding for compositionally enhanced agricultural products can require the analysis of a large number of seed samples from plants to identify those plants with the desired compositional and agronomic properties for use or advancement to the next generation. Analysis of bulk seed batches for certain traits, such as high oil or protein content, on a single plant or ear, in conjunction with an appropriate breeding methodology such as recurrent selection, often allows for the selection and introduction of such traits into a commercial population. Although ...

Claims


Application Information

Patent Timeline
IPC IPC(8): A01C1/00B01L3/00G01R33/465G01R33/48G01R33/56
CPCB01L3/5085G01R33/465G01R33/48G01R33/56
Inventor KOTYK, JOHN J.DEPPERMANN, KEVINL
Owner MONSANTO TECH LLC
Learn More