Computer powered wire(less) ultra-intelligent real-time monitor

a real-time monitor and computer technology, applied in the field of universal electronic data monitoring, can solve the problems of not being able to detect the condition in time, affecting the accuracy of the diagnosis, and using the chart in a way that is not statistically valid, so as to facilitate proper analysis and diagnosis, prevent proper and/or accurate diagnosis of human biological conditions, and increase the heart rate

Active Publication Date: 2005-05-24
RIDLEY ALFRED DENNIS
View PDF23 Cites 14 Cited by
  • Summary
  • Abstract
  • Description
  • Claims
  • Application Information

AI Technical Summary

Benefits of technology

[0040]t) To provide dual quality control charts, correcting for the effects of autocorrelation in each variable being monitored, and cross correlation with other variables. At least three embodiments of this feature for applications in biomedical, manufacturing and auditing applications are as follows:
[0041]The meaning and the importance of the new dual chart system is summarized as follows by considering its application to biological vital signs data such as heart rate and oxygen saturation. The principle of the dual chart system applies similarly to other data. Unlike a simple machine, the human body has natural internal self-correcting mechanisms. Biological data collected serially over time are therefore related to each other. That is, they are systematic and correlated. They are not independent data. They cannot be represented and analyzed by the existing method of standard control charts because such charts are valid only for independent data. Even a simple visual analysis is misleading. Biological data also contain a component that is not correlated. That is, a random and independent component. When the data are represented by the existing method of a single chart, the systematic and random effects are confounded, preventing proper and / or accurate diagnosis of the human biological condition.
[0042]The invention splits the data into systematic (correlated) and random (independent) components. It creates and uses the common cause effects chart to represent the part of the data that is systematically related, and the special cause effects chart to represent the part of the data that is randomly independent. The common cause chart identifies what is systematically occurring, internally, inside the body, due either to normal health, healing or failing health. The special cause chart identifies what is occurring in the external environment, and impacting on the body. For example the effects of a one of a kind loud noise that is startling, raises heart rate temporarily but does not repeat in a systematic way. Dual charts permit and facilitate proper analysis and diagnosis of the human biological condition as far as can be determined from the data. The dual chart system also reduces the number of false alarms or false positives that distract the attention of valuable personnel away from real and important problems, and reduces the number of false negatives when real and important problems go unnoticed. These features are greatly needed.
[0043]This new method of splitting the data and the notion of the presence of the elements of the new dual chart system are both initially counter intuitive, and are therefore unobvious to any person who has ordinary skill in the specific technologies involved in the invention.
[0044]Consider next, the application to an industrial process. The common cause effects chart for this type of data may be a recurring cyclical pattern caused by, for example, a worn machine bearing, internal to the process. By examining the common cause effects chart, the pattern can be associated with its probable cause and the defective bearing identified and located. All parts must wear, and must wear out eventually. The defective bearing can be changed during the next scheduled plant maintenance shut down. Otherwise, the bearing wear may reduce product quality. It will eventually fail, forcing an unscheduled shut down, a new bearing anyway, and all attendant costs of a forced shut down. The special cause effects chart for this type of data may reveal for example, a random one-time raw material departure from what is required. This is, an external effect due to a bad batch of raw material. In that case, the supplier must be contacted to rectify the problem.
[0054]aa) To copy and paste the charts into another computer program, such as a word processor, so as to prepare a more extensive report that incorporates information from the chart.

Problems solved by technology

However, the chart is used in a way that is not statistically valid.
However, correlation is limited to autocorrelation in a single variable.
Varying limits, all existing on the same chart, make the chart far more complicated, very difficult to read and very confusing.
This patent shows software that to function, requires an expensive and dedicated medical prescription sensor / monitor, currently used in hospitals.
U.S. Pat. No. 5,505,199 to Kim requires a combination of pulse oximeter, motion detector, and video camera connected to a central unit, making it cost prohibitive for most home users.
Any external motion detector is likely to alarm when it is too late to take corrective action.
None of these patents employs wireless transmission of data.
This limits the mobility of the person being monitored.
Movement can cause wires to come loose.
Wires can also be hazardous, especially to babies.
Transmission in the 900 MHz band is very demanding on the battery.
Because of the charger port, the sensor cannot be sealed for water proofing.
Therefore, continuous monitoring is not possible for any appreciable length of time.
In any case the patent is limited to babies that are asleep.
However, a baby can experience respiratory and / or cardiac difficulties while awake.
Therefore, the signal is either altered so that the monitor receives incorrect and dangerously misleading values, or it becomes lost altogether between the transmitter and the receiver in the monitor.
This patent is limited to monitoring a single vital sign in actual units.
Therefore, there is no way to get a picture, pattern or any other sense of how the data is developing over time.
Therefore, there is no continuous monitoring.
They all require expensive prescription sensor / monitors.
None of them does multivariate data analysis designed to collectively support diagnosis, decision making and corrective action.
None of them provides long duration independent sensors that can be connected to a monitor either by wire or wireless means.
None of them provides universal ability to read data formats from different sources containing various combinations of variables.
None of them provides graduated progressive sound, color, print and world wide, fax, email and telephone alarm signals when the chart values exceed predetermined or user specified limits, either in terms of actual units or standard deviations, or when any particular pattern occurs.
However, it shows no wireless means or graduated alarms.
However, it shows no charts and no graduated alarms.
They cannot be represented and analyzed by the existing method of standard control charts because such charts are valid only for independent data.
Even a simple visual analysis is misleading.
When the data are represented by the existing method of a single chart, the systematic and random effects are confounded, preventing proper and / or accurate diagnosis of the human biological condition.
All parts must wear, and must wear out eventually.
Otherwise, the bearing wear may reduce product quality.
It will eventually fail, forcing an unscheduled shut down, a new bearing anyway, and all attendant costs of a forced shut down.
This is, an external effect due to a bad batch of raw material.
They may simply be obscured if the systematic effects are large.
Even if the unusual expenditures would have eventually been found by a manual search, the special cause effects chart saves valuable time and effort.u) To create separate disk files of common cause variations and the special cause variations data that can be read by other computer programs and used to manipulate and control other devices and processes.
Consider an industrial application wherein as an after thought, a new variable is to be monitored, but where no wiring currently exists, or where installing wires is not immediately technically feasible.
However, it is very difficult not to notice a combination of full screen color, print, fax, email and pager / beeper or telephone alarms, especially when the telephone and fax machine are elsewhere in a quiet location.

Method used


Image

  • Computer powered wire(less) ultra-intelligent real-time monitor
  • Computer powered wire(less) ultra-intelligent real-time monitor
  • Computer powered wire(less) ultra-intelligent real-time monitor

Examples


Embodiment Construction

Automatic Data Acquisition and Hardware

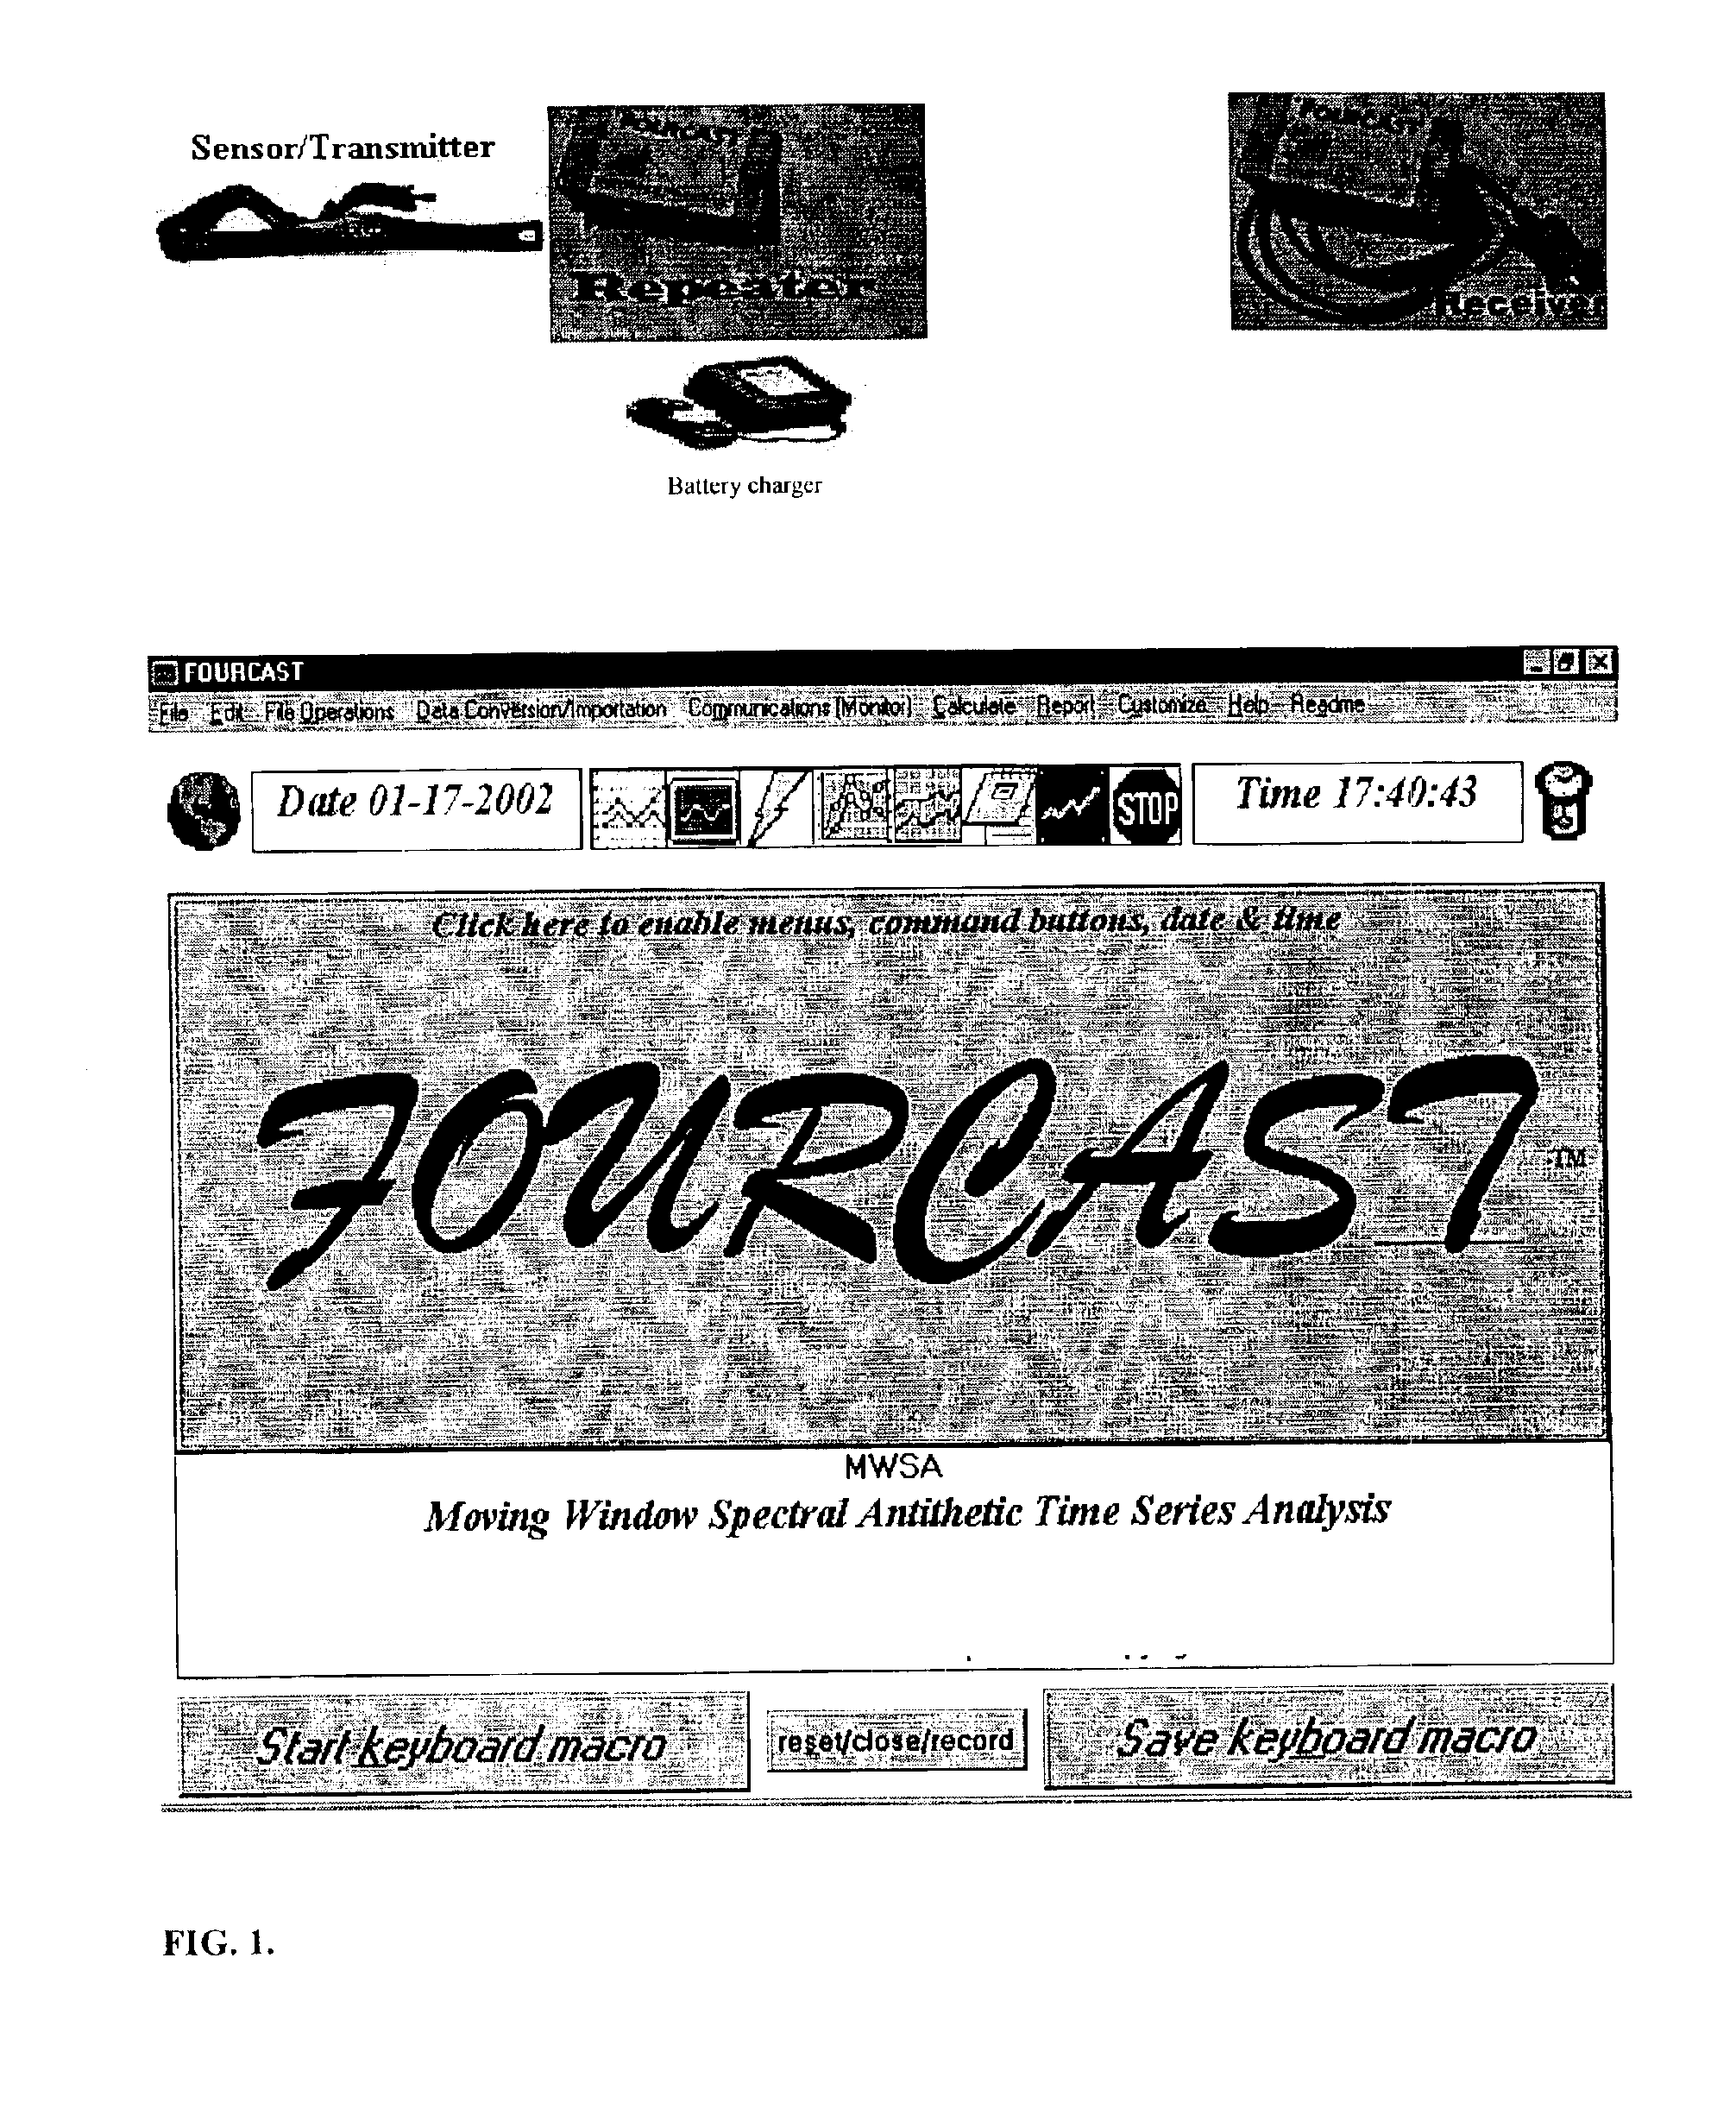
[0122]FIG. 1 is a picture of a working prototype of a computer powered wire(less) ultra-intelligent real-time monitor. This monitor is comprised of a high speed electronic sensor / transmitter, a new battery operated repeater and battery charger, a receiver, and a new computer software program named FOURCAST SPControl / BioMediControl / SleepAnalyzer / Auditor (the main menu screen is shown). The object code (FOURCAST.ZIP) is included in this provisional patent application on a single 3.5″ floppy disk. The sensor measures voltage pulses on the skin of a human being or animal. Any combination of separate clothing may be worn over the sensor / transmitter. Each pulse corresponds to a heartbeat. Various sensors can be used to measure different variables, including but not limited to biological heart rate, oxygen saturation, blood pressure, blood sugar, brain waves, temperature, industrial electrical voltage, electrical current, temperature, speed etc., and ...


PUM


Abstract

A device (1)(2) and method to monitor, in real time, one or more variables by an at least 2500 hour water proof sensor/transmitter, not requiring recharge, placed at the source where data are automatically collected and transmitted by wire or wireless means (2A)(2B) to a battery-free computer-powered (2C) receiver connected to a computer, where software continuously analyzes and charts the data. The software auto and cross correlates the variables, continuously updates and displays the data on simple aggregate charts (4A) or decomposes the data and displays them on newly created common cause charts (4B)(4C) of internal systematically related effects and newly created special cause charts (4D)(4E) of external random unrelated effects, including summary data, and creates graduated progressive sound, color, print and world wide, fax, email and telephone alarm signals when the chart values exceed user specified limits, either in terms of actual units (4B)(4D) or standard deviations (4C)(4E), or when any particular pattern occurs. The device helps determine ahead of time, when the source of the monitored variables is functioning abnormally. Advance warning thus obtained, is used to initiate corrective action (3A)(3B)(3C)(3D) so as to prevent failure at the source that is generating the variables. Examples of failure that it helps prevent include but are not limited to, sudden infant death due to sudden infant death syndrome in human babies, heart or respiratory failure in any human being who is either at rest or moving around within a specified area, failure in industrial machines or measuring equipment, manufacturing defects and financial irregularities.

Description

CROSS-REFERENCE TO RELATED APPLICATIONS[0001]This application is entitled to the benefit of Provisional Patent Application Ser. No. 60 / 352,096 filed Jan. 25, 2002.BACKGROUND[0002]1. Field of Invention[0003]This invention relates to universal electronic data monitoring including their collection, wire or wireless transmission, computer analysis, detection and the classification of abnormalities in the data, where such abnormalities result in automatic alarms that are transmitted to recipients locally or world wide, thereby providing a basis for taking corrective action at the source of the data.[0004]2. Discussion of Prior Art[0005]Methods Using Hard Wired Transmission:[0006]The prior art U.S. Pat. No. 4,583,524 to Hutchins (1986) shows a instructional system for reviving the victim of a heart attach. U.S. Pat. No. 5,199,439 to Zimmerman et al. (1993) shows the use of a quality control chart for direct and simple monitoring of data. However, the chart is used in a way that is not sta...

Claims


Application Information

Patent Timeline
Patent Type & Authority Patents(United States)
IPC IPC(8): G08B31/00G08B29/00G08B29/18
CPCG08B31/00
Inventor RIDLEY, ALFRED DENNIS
Owner RIDLEY ALFRED DENNIS
Why Eureka
Try Eureka