Colorimetric analysis method for detecting kanamycin based on aptamer modified magnetic bead and gold nanoparticle mimic enzyme activity
A technology of gold nanoparticles and kanamycin, applied in the field of analytical chemistry, can solve the problems of large error in results, expensive equipment, complicated operation, etc., and achieve the effects of high specificity, good signal amplification, and easy preparation
- Summary
- Abstract
- Description
- Claims
- Application Information
AI Technical Summary
Problems solved by technology
Method used
Image
Examples
Embodiment 1
[0024] Specific steps are as follows:
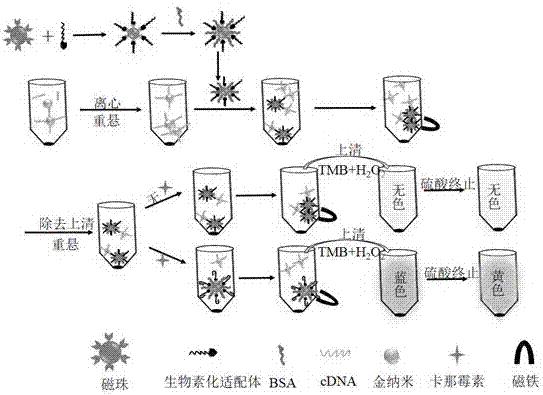
[0025] (1) Preparation of gold nanoparticle-mimicking enzyme AuNPs: prepared by using tyrosine as a reducing agent and capture agent. Gold nanoparticle-mimicking enzyme: 300 mL ultrapure Boil the aqueous solution for 3-5 minutes, immediately add 1.02 mL of chloroauric acid solution with a mass volume ratio of 1%-3%, and keep warm in the boiling water bath for 5-10 minutes; continue to boil in the boiling water bath until the solution volume is reduced to 30 mL, Obtain gold nanoparticle solutions of different particle sizes; dialyze the above gold nanoparticle solution in advance in a dialysis bag with a molecular weight cut-off of 12 kDa treated in boiling water to remove excess KOH, metal ions and tyrosine, and obtain gold nanoparticle simulation Enzyme AuNPs, stored in a 4°C refrigerator for later use;
[0026] (2) Preparation of functionalized gold nanoparticles (AuNPs-cDNA): All reagent bottles and Ep tubes used need to be soaked in...
Embodiment 2
[0033] The detection of embodiment 2 kanamycin standard solution
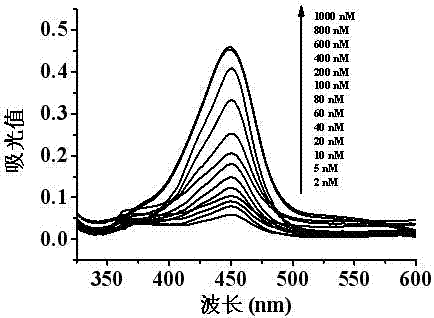
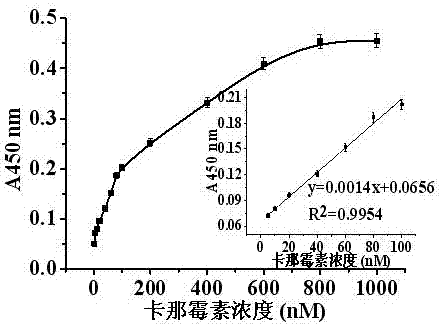
[0034] Different concentrations of kanamycin solutions were selected and added to the reaction system to form a specific structure with the kanamycin aptamer sequence through a displacement reaction to replace AuNPs-cDNA from the magnetic beads. After magnetic separation, the free AuNPs were absorbed, transferred to another Ep tube, and the catalytic reaction substrates TMB and H 2 o 2 After a period of reaction, 2 M H 2 SO 4 Terminate the reaction, centrifuge, test its UV-vis spectral curve in a spectrophotometer, and record the absorbance at 450 nm, according to the relationship between the concentration of kanamycin in the sample solution and the absorbance at 450 nm, Draw the corresponding relationship curve and linear range curve ( figure 2 , image 3 ). In the range of 5-100 nM kanamycin standard solution concentration, there is a good linear relationship between the light absorbance value at 450 n...
Embodiment 3
[0035] Example 3 Detection of Kanamycin Residues in Honey Samples
[0036] Here, the method of artificially polluting honey is prepared by adding standard concentration of kanamycin to honey to obtain honey samples containing 0-1000nM kanamycin residue.
[0037] The artificially polluted kanamycin in acacia honey was detected according to the steps of standard substance detection in Example 2.
[0038] get as Figure 4 UV-vis spectral curves under different kanamycin concentrations shown, and Figure 5 The linear relationship between the light absorbance value and the concentration of kanamycin in the honey sample is shown.
[0039] In the range of 2-1000 nM, the light absorption value is positively correlated with the concentration of kanamycin (nM), and in the range of 5-100 nM, it shows a good linear relationship. The linear equation is y=0.0018x+0.1082, R 2 =0.9877, the detection limit was 18.3 nM. The meaning of letters in the formula is the same as in Example 1. Th...
PUM
 Abstract
Description
Claims
Application Information
 - R&D
- Intellectual Property
- Life Sciences
- Materials
- Tech Scout
- Unparalleled Data Quality
- Higher Quality Content
- 60% Fewer Hallucinations
Browse by: Latest US Patents, China's latest patents, Technical Efficacy Thesaurus, Application Domain, Technology Topic, Popular Technical Reports.
© 2025 PatSnap. All rights reserved.Legal|Privacy policy|Modern Slavery Act Transparency Statement|Sitemap|About US| Contact US: help@patsnap.com


