Problems can include faults, performance degradation, intrusion attempts and other exceptional operational conditions requiring handling.
However, as systems have become more complex, the rate at which observable events occur has increased super-linearly, making
problem management more difficult.
As an example, when the number of computer nodes in a network increases, the
network complexity increases super-linearly with the number of nodes, with a concomitant increase in the
fault rate.
Compounding this problem of network complexity is
fault propagation between both machines and network protocol
layers; these propagated faults can generate additional evens.
Unless events are correlated, a single problem in a single subsystem could result in multiple, uncoordinated corrective actions.
This can lead to wasteful resources spent on duplicate efforts and inconsistent corrective actions which result in an escalation of problems.
Conventional and previously proposed approaches to managing faults in a
system have failed to fully address the increase in complexity and have failed to provide adequate performance for large systems, as outlined more particularly herein.
Although every possible reportable measurement (such as
voltage level, disk error, or temperature level) could be considered to be an “event”, many of these measurements do not contribute to identifying exceptional events in the system.
However, they may not be correlated if they occur on different days, because they would not be related temporally.
These newly updated data can be used to satisfy the conditions of other rules, resulting in a “
chain reaction” of rule executions.
For example, for a very large
knowledge base, the performance of the system can suffer exponentially with the number of condition parts of the rules.
The search associated with rule-based systems can be of exponential complexity in the number of rules (size of
knowledge base).
It is difficult to ensure that firing sequences of a complex rule-based system actually terminate.
The complexity of the search is also exponential in the size of the
working memory.
Such perturbations in the input can have unpredictable or controllable results.
Different orders may lead to different results and time to converge.
There are no techniques to ensure that a
rule based system contains sufficient rules to resolve correlations.
The knowledge base is “brittle” in that if the
problem domain changes in any way, the system will no longer perform.
However, case-based approaches have inherent disadvantages.
It may be necessary for experts to directly enter cases into the system to fully capture their value, and it may be difficult to determine when the
case base is sufficiently large to solve a prescribed range of problems.
The system may not be
usable until a large number of problems have been encountered and solved.
It is difficult to maintain a case-based system through changes in a
networked system.
Changes will invalidate certain cases, leading to inconsistencies.
Like rule based systems, case-based systems can involve significant and slow search, can be difficult to validate and may be sensitive to loss or spurious generation of symptoms (these may be seen as different cases).
For very large and complex systems, the storage and search requirements can be unacceptable.
For a vector a of problems and a vector b of symptoms, the problem of fuzzy backward reasoning can be defined as computing the problem vector a that solves the equation b=a*R. However, this approach has severe disadvantages.
Moreover, a small error in the model (e.g., in the fuzziness indicators of R) can lead to significant errors in the result.
Lost or spurious symptoms may result in no solution to the equation rather than detecting the possible loss.
Moreover, the FBR approach does not permit simple reduction of symptoms to be observed (e.g., reducing a Madness matrix R to a much smaller matrix R′).
Finally, the complexity of FBR can be exponential in the number of problems, because it seeks to compute all possible combinations of problems that could yield a particular observation.
In short, the FBR approach does not solve the problems outlined above with respect to complexity and performance.
However, it may be difficult or impossible to accurately model the underlying system, particularly if it is complex.
Moreover, for complex phenomena, an FSM representation can quickly grow to unmanageable size because of the simplicity of the model.
Thus, the integration task can be enormous.
Furthermore, it may be impossible to decide which KS should be scheduled without special knowledge about what is contained in the KS's themselves.
However, this would cause a large load on the system whether or not the OVERLOAD event was of interest.
However, it may be difficult to implement because there must be a mapping from the
query language to actual queries to the objects in the network.
Moreover, when a new query is produced, it may be difficult to determine the cost of producing the event to which the query maps; not all queries which can be generated are capable of an efficient implementation.
Therefore, the complexity of this approach could be difficult to predict.
However, as with other object-oriented approaches, the performance of the system can be poor.
Moreover, this model only provides one component of an
event correlation system (i.e., the knowledge base); it does not address how to correlate events and provide a problem diagnosis.
Simulation techniques, however, do not generally address the problem of correlating events and producing a diagnosis of underlying problems.
Although each of these approaches has certain advantages, these approaches generally fail to address four key problems: (1) general
extensibility of the approaches to very large and complex systems having many components with interrelated events; (2) performance difficulties encountered when implementing any of the approaches to perform event correlation in real-time or near real-time; (3) extremely large data storage requirements when implemented for very large and complex systems; and (4) difficulty in capturing knowledge about relationships among events in the system being monitored.
Additionally, these related approaches have failed to recognize that significant
data reduction can be accomplished prior to decoding of symptoms to thereby increase overall performance and reduce complexity.
Finally, the related approaches fail to overcome difficulties encountered in translating relationships among objets, symptoms and problems in a system into data structures which can be used for decoding symptoms in the system.
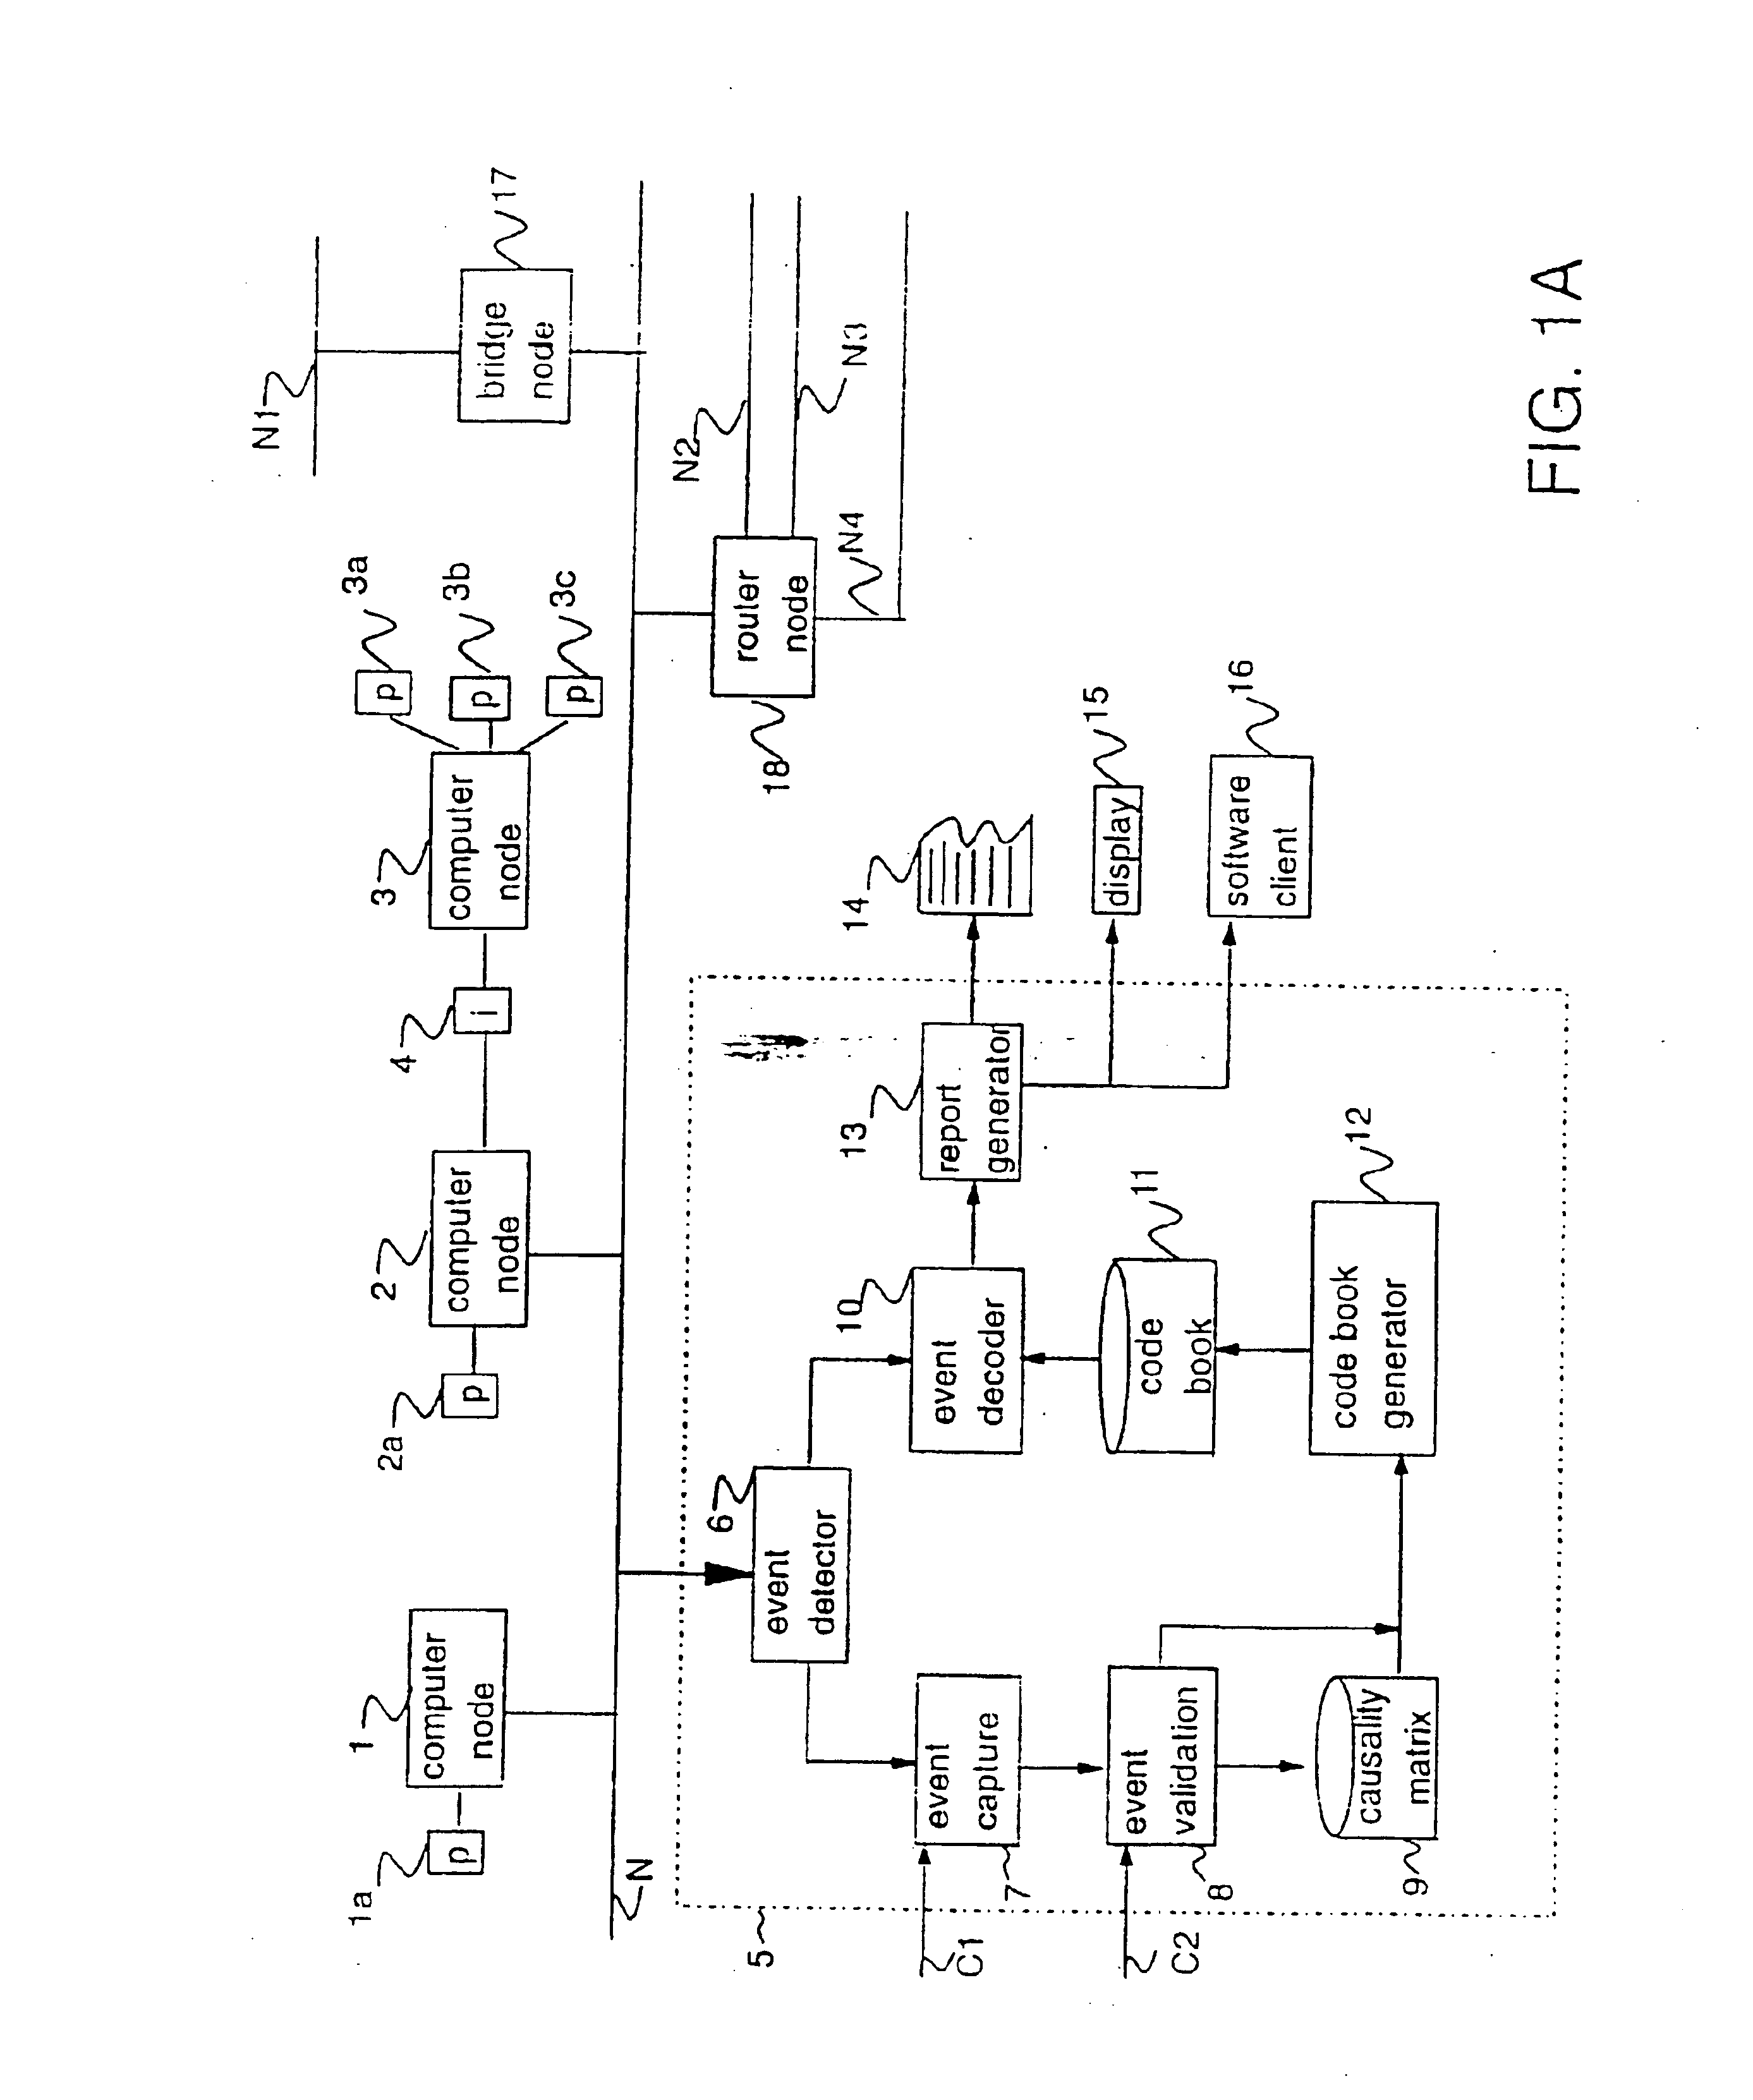
(1) Specifying an
event model and a propagation model for classes of components in the stem. This specification can be provided as early as component design time or later. The specification may include the exceptional events associated with each class of component, their corresponding local symptoms, and the potential relationships with other component along which evens can propagate. An exceptional event may be an event that requires some handling action (e.g., a problem such as a defective disk drive, or adding a
workstation to a LAN) while a symptom may be an observable event (e.g., excessive read / write errors for the disk, or a change in routing tables) caused by the exceptional event. Events may propagate between objects along relationships associated with their classes. For example, components of a type “LINK” may have an exceptional event “LINK FAILURE”. Links may have a relationship “connected-to” with components of type NODE. Link failure can propagate from a LINK to a NODE along this “connected-to” relationship, being observed in NODE via the symptom “NODE-UNREACHABLE”.
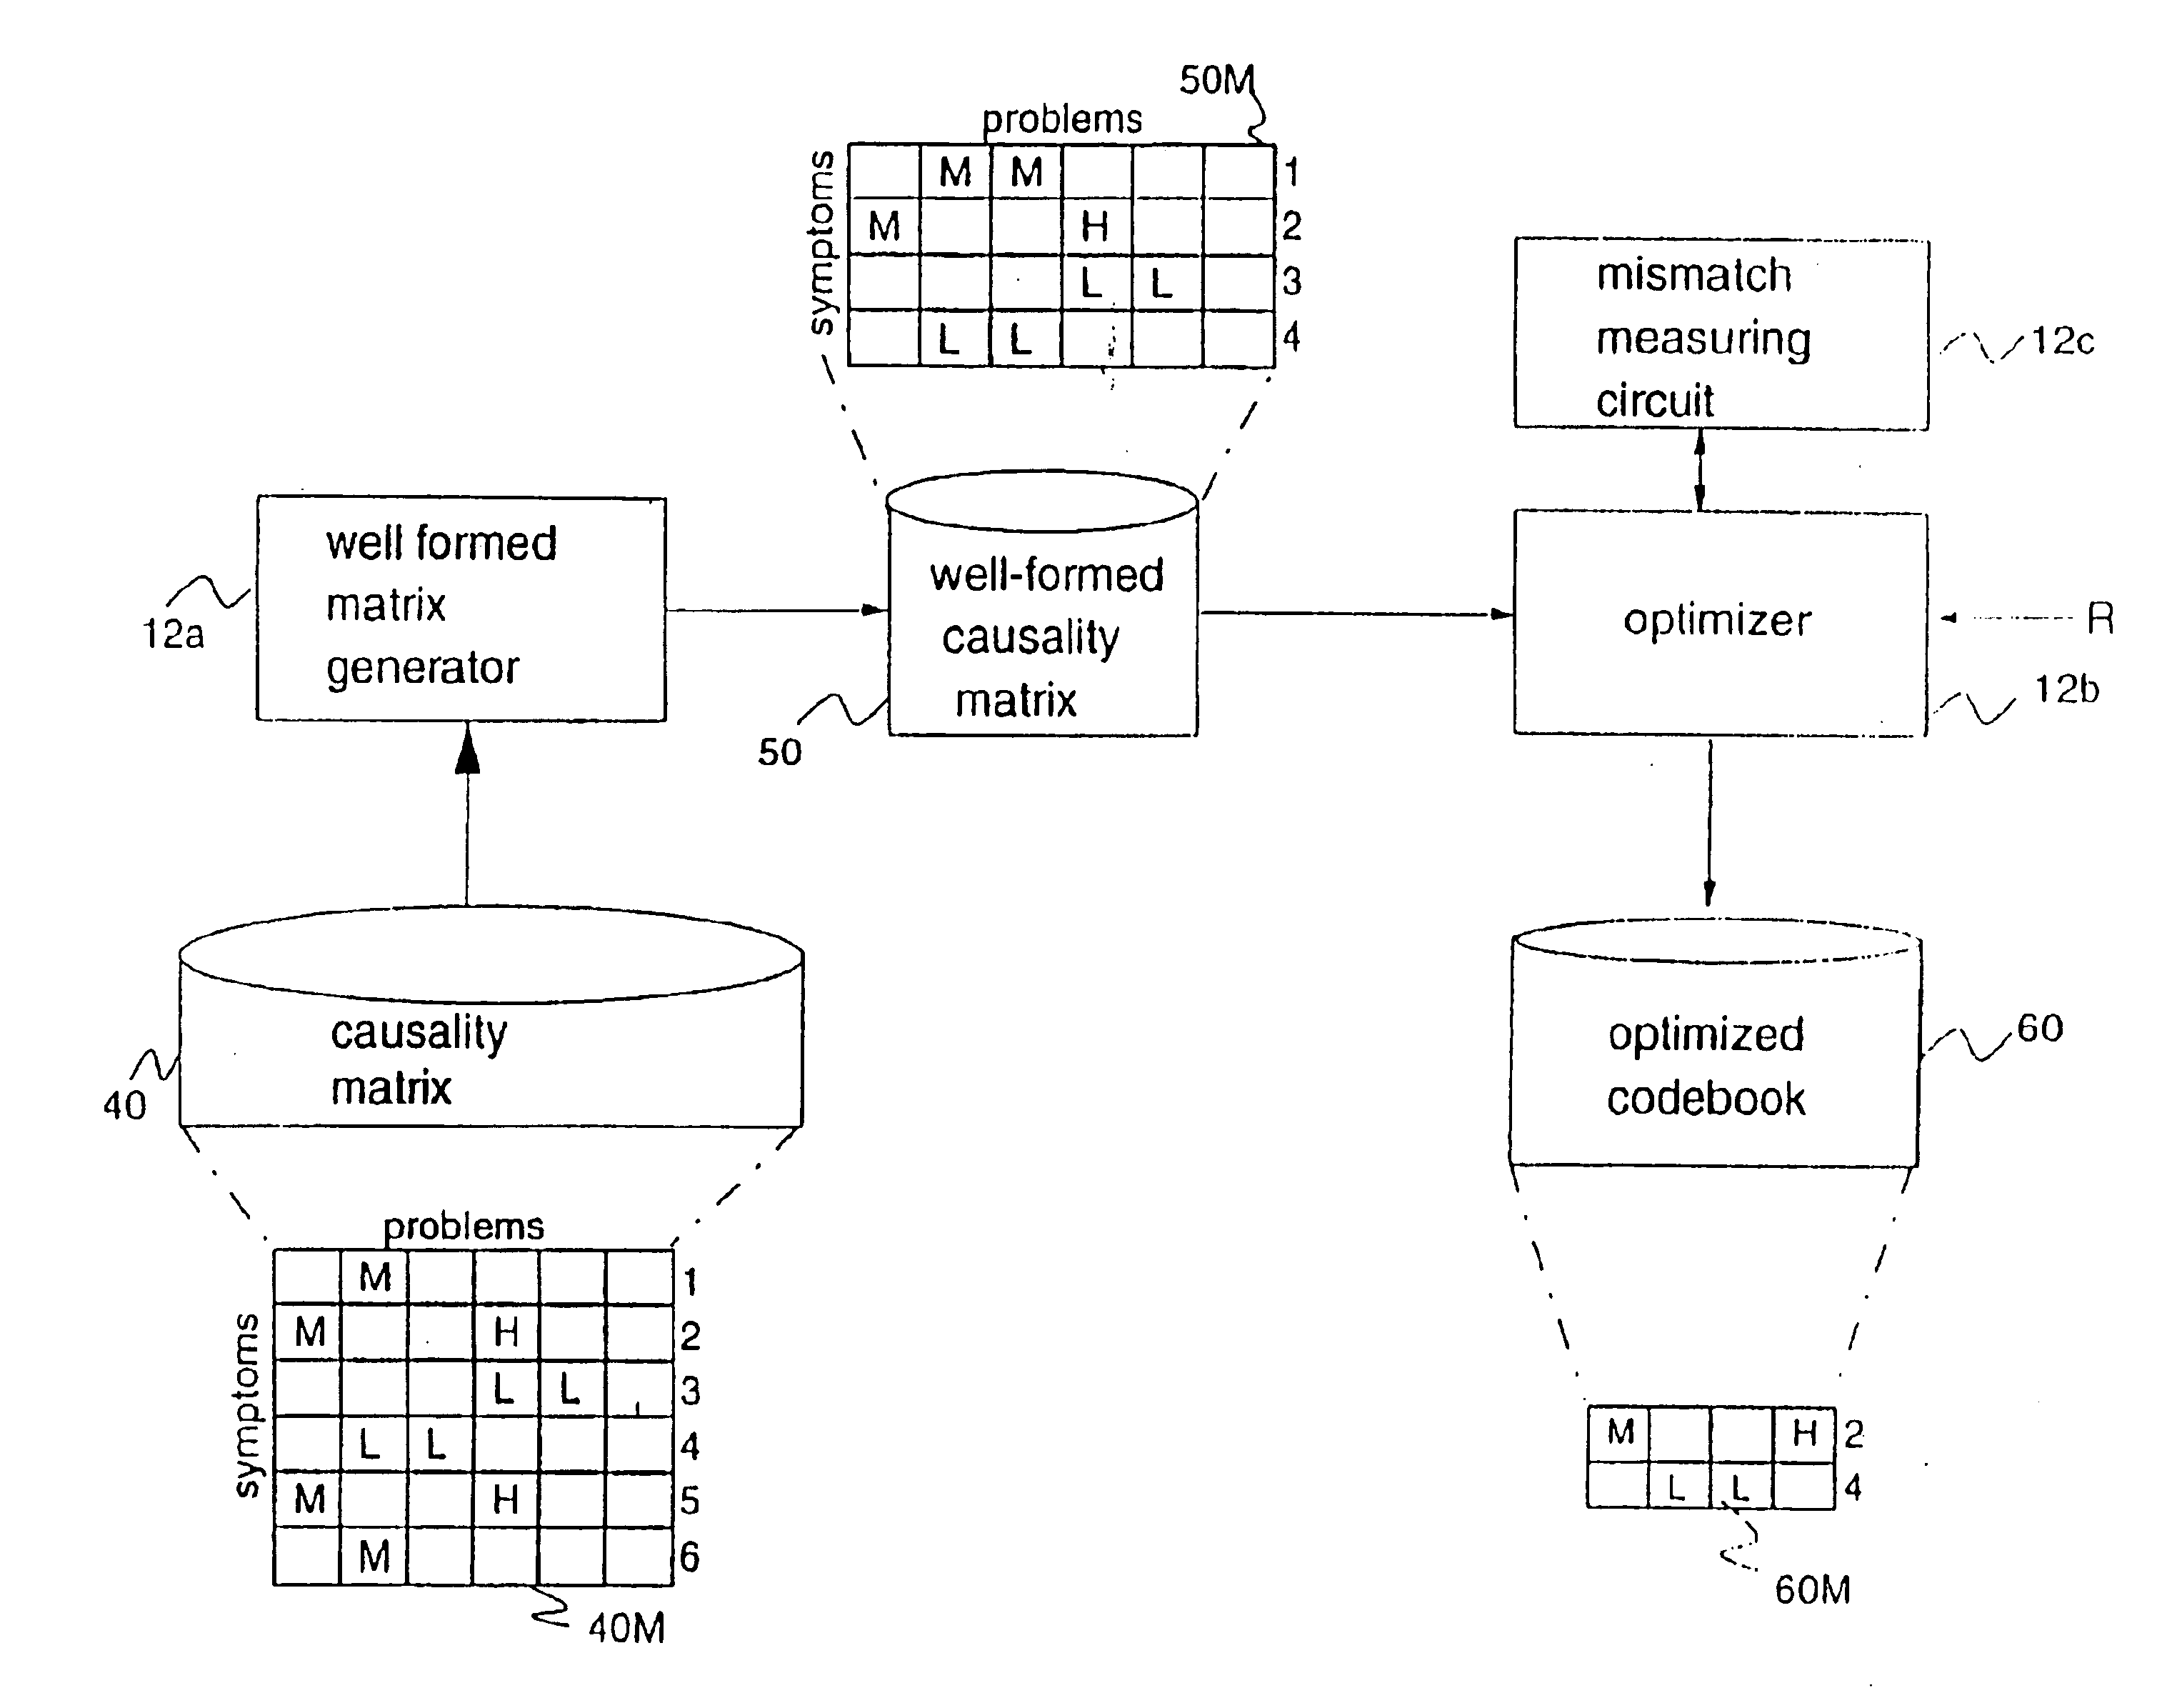
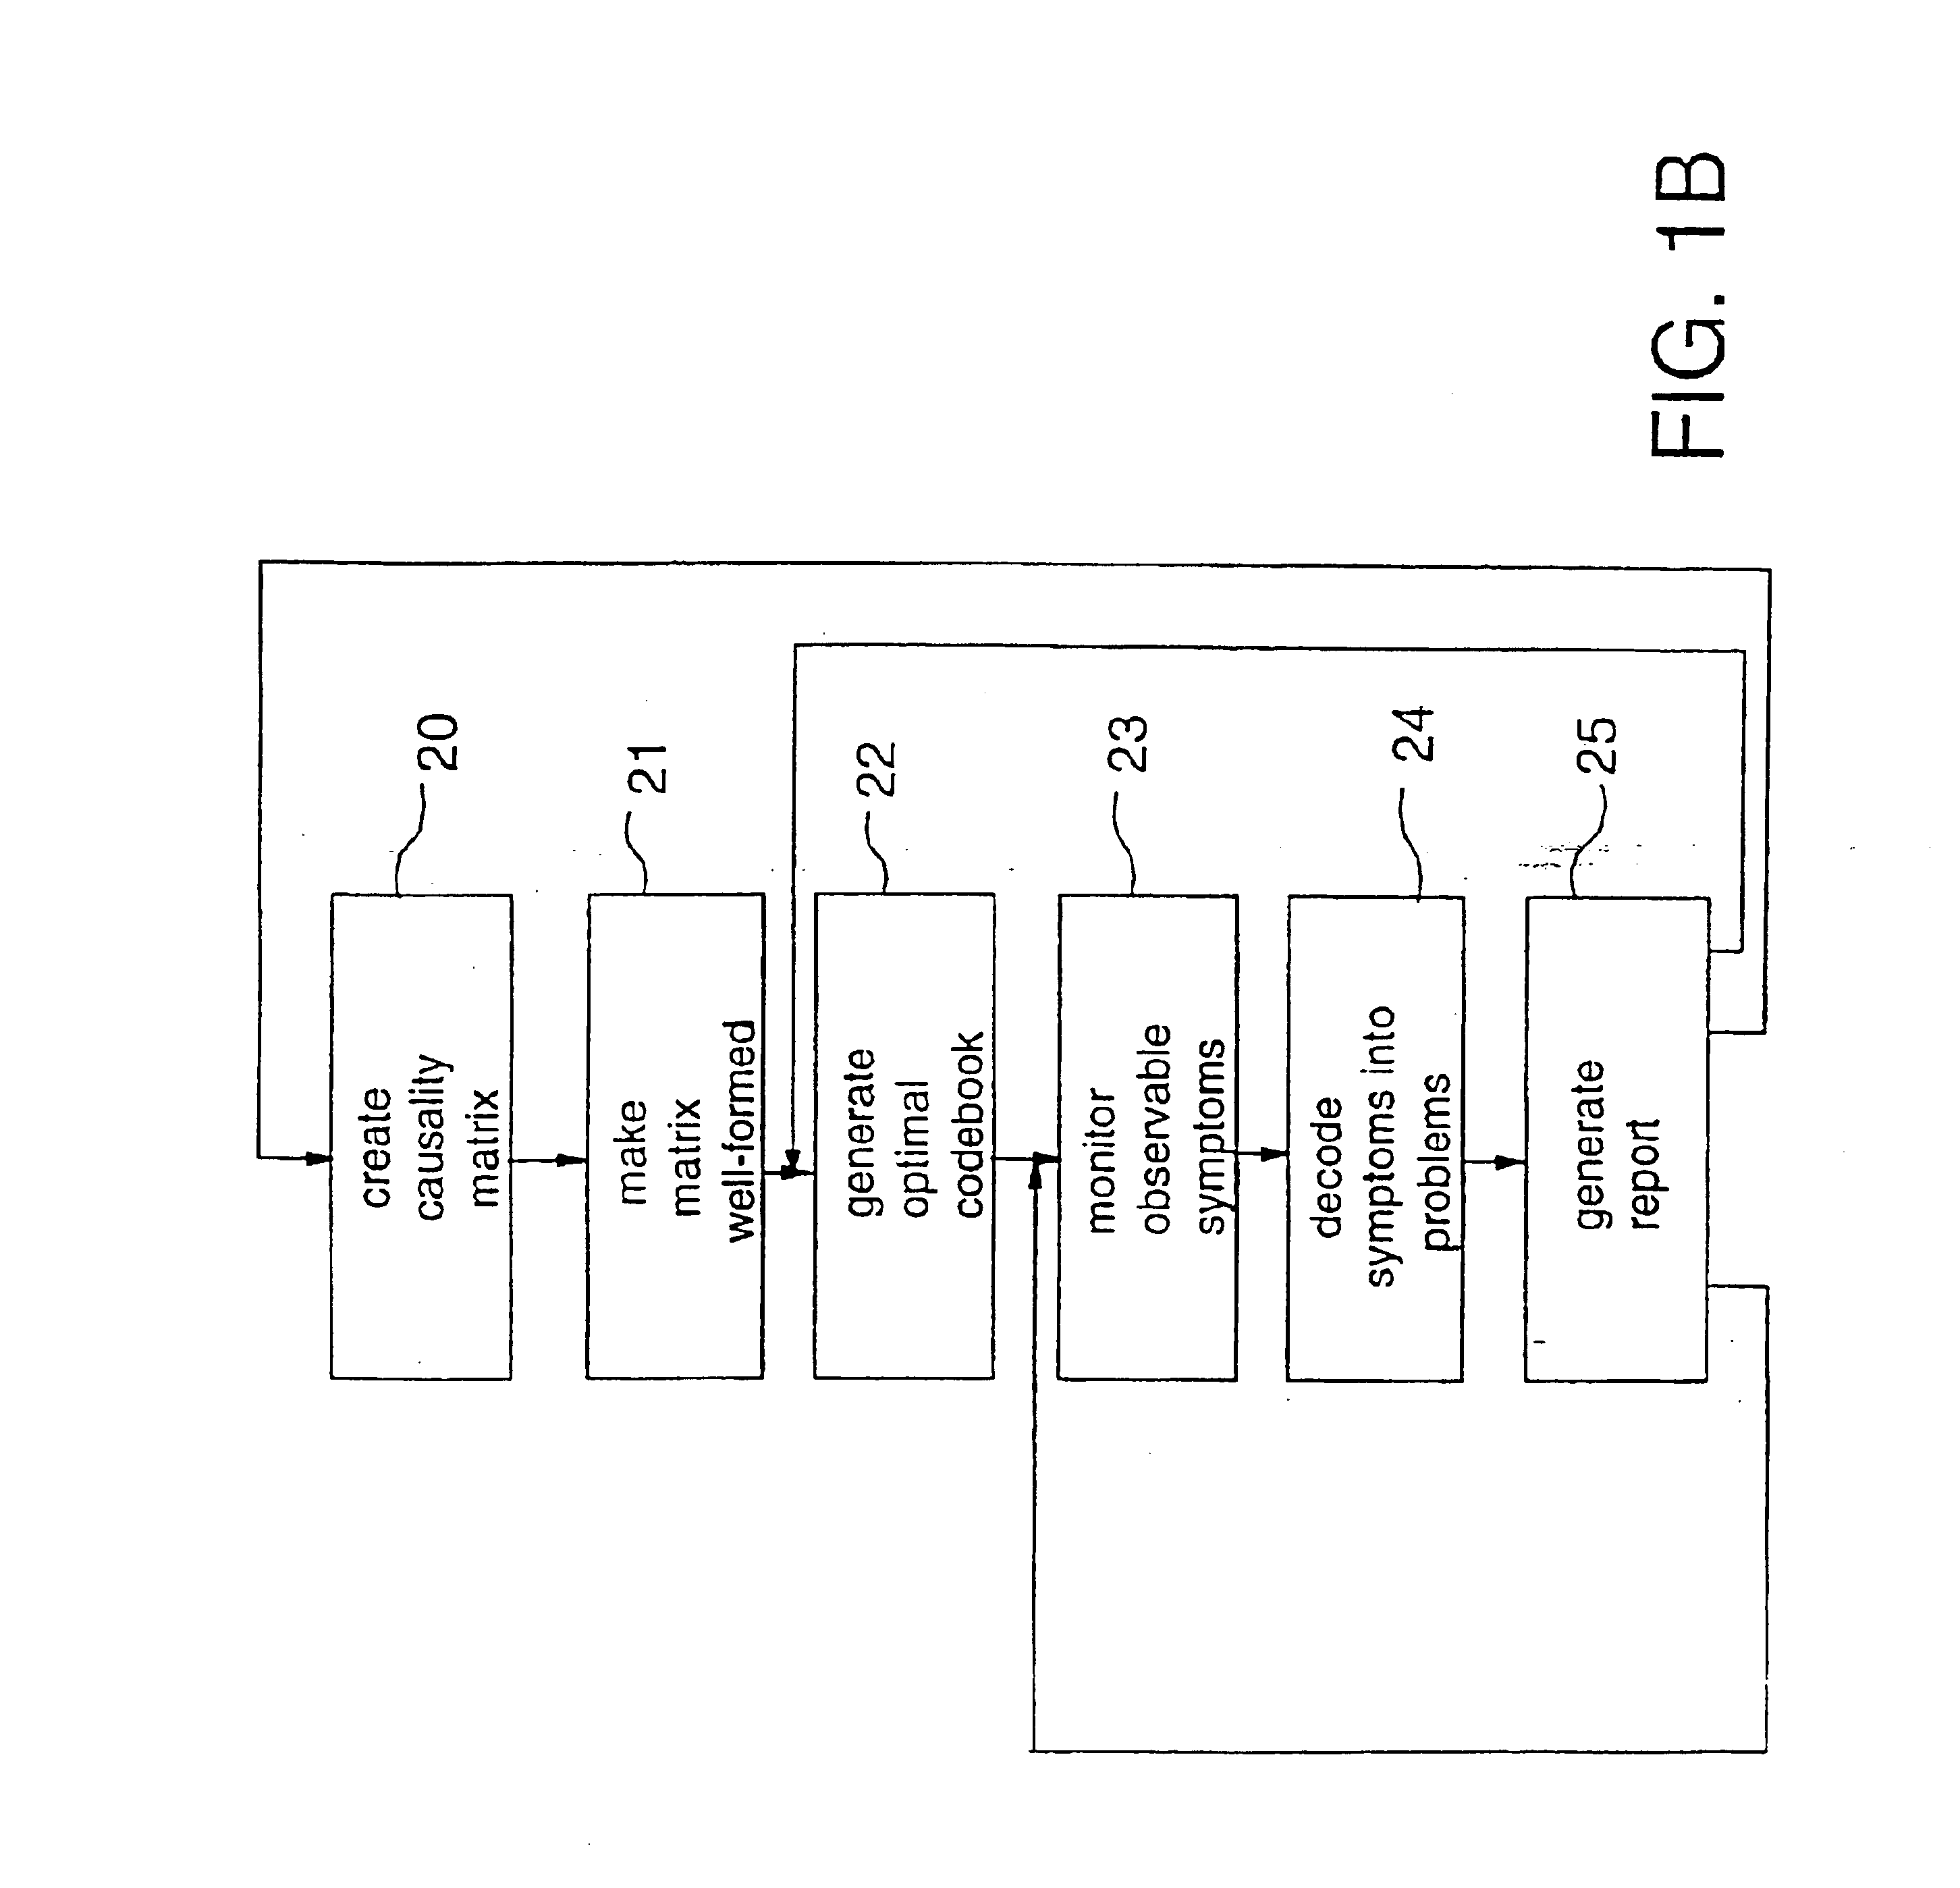
(2) Creating a
causality data representation of problems and symptoms for the system to be monitored (the term “problem” as used in this specification will be understood to mean any exceptional event). The causality data representation includes data to describe problems, events and their
causal relations both within a component and across components. This representation may associate with
causal relations probabilities, or other measures of likelihood, that certain events cause each other. It may also associate other performance measures that may be useful in correlating events, such as the expected time for the
causal relations among events to happen. In a preferred embodiment the causality data representation utilizes a matrix. This causality matrix contains a mapping of symptoms to likely problems in the systems, with probabilities for each
cell of the matrix. The matrix is manipulated to ensure that columns are sufficiently distinguishable from one another (i.e., no two problems are close to one another under a defined distance measure). A distance measure, which can be defined arbitrarily, adds robustness by allowing the invention to tolerate a loss of events or spurious symptoms. (In a rule-based system, a large number of combinations of subsets of the rules would need to be tried to get the same effect).
For complex systems, a causality matrix may be very large and unwieldy.
A problem is an event that requires handling, while a symptom is an event that may be observed.
Thus, in keeping with the above example, event 1 is a disk drive failure (problem), and event 3 is an I / O
error message generated by the computer connected to the failed disk drive (symptom of the problem).
However, event 8 is only an “intermediate” event and contributes no new useful information.
For example, various different problems with an
Ethernet™ interface card (e.g., loose connector, defective collision-detection circuits) all lead to similar symptoms.
The problem can therefore be generally abstracted as an “interface problem” and the correlation process will only identify that such a problem exists, but will not be able to determine which specific condition (loose connector or defective circuits) exists.
However, the codebook may still contain a very large number of symptoms which contribute little to detecting or
identifying problems (although the example outlined above is, of course, small).
The complexity of the process is polynomial in the number of problems and symptoms.
In many cases, symptoms may be randomly caused by problem events.
Of course, in the real world, many probabilistic correlations may be unknown, and the model cannot be tailored to take
advantage of these relationships as described above.
Each
satellite may typically comprise numerous
processing components including sensors and devices which may generate symptoms such as low power, device failures, and the like.
In general, this may be very large.
(1) Real-
time correlation computations are reduced significantly by preprocessing event knowledge to generate codebooks prior to real-time event detection and correlation. This is in contrast to typical event correlation systems based on
artificial intelligence techniques which conduct indefinite searches during real time to correlate events. In extremely large and complex systems, the reduction in real-
time processing requirements can significantly reduce the amount of hardware required and can result in faster problem diagnosis.
(2) A wide range of correlation models can be used and tuned (through a choice of correlation indicators, distance and mismatch measures) to achieve different strategies for correlation while using the same generalized process.
(3) The set of events to be monitored can be narrowed to only those that provide the highest information benefit, rather than arbitrarily monitoring all possible events, or an ad hoc set of events. This reduces the complexity of the correlation process and minimizes the waste of
computer processing resources.
(4) The instrumentalities of the invention can be implemented with a relatively small set of code that can be operated on a single computer.
For example, a problem event in the power supply may cause symptom events (as well as problem events) at the CPU board and other objects to which it “provides-power-to”.

