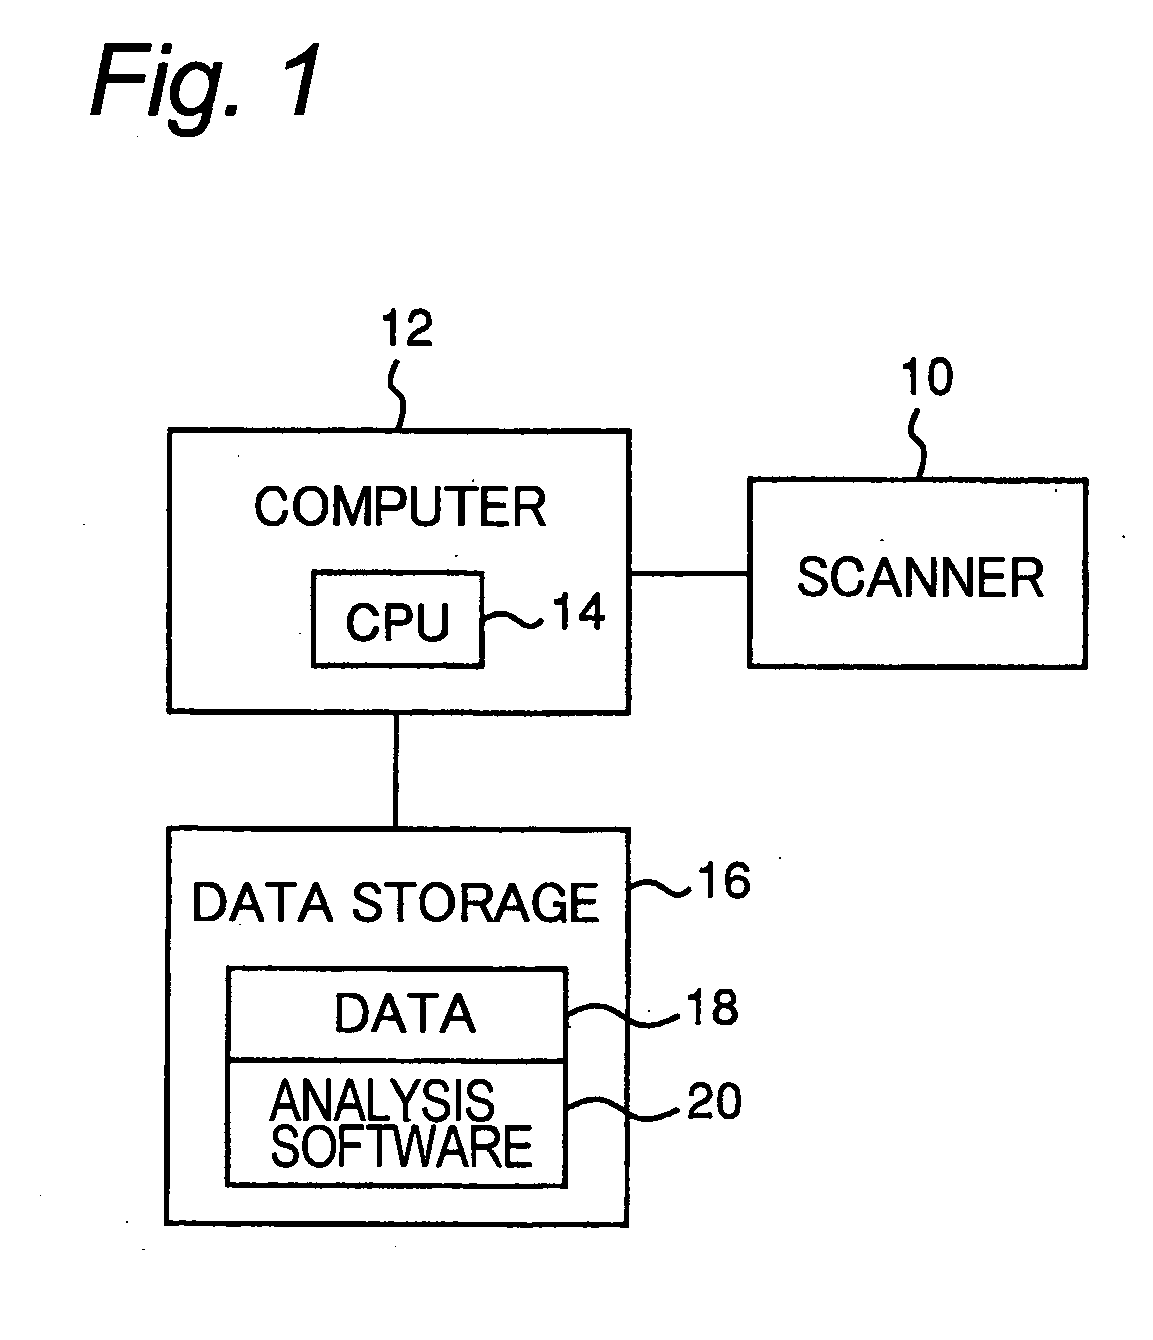
[0055] The inventors find in the field of
medical diagnosis with
gene expression that a good correlation model (e.g., a partial least square model) can be obtained by selecting variables so as to optimize a function having the result of cross-validation used in the
data analysis as at least one of independent variables. In the cross-validation, the data at hand are divided into a plurality of groups, and a model is obtained by fitting for only a part of the divided data groups (a
training set) while
predictive power of the model is examined by predicting a remaining data group (a
test set). The cross-validation has been used for selection of dimensions of the latent variables in the conventional partial least square method (PLS). However, in the partial least square method of the invention the latent dimension is fixed to one, and a function having the cross validation (e.g., a predictable error of a sum of squares) as at least one of the independent variables is optimized while one or more input variables (explanatory variables) are selected successively. However, the
advantage of the invention may be obtained without restricting the dimension of the latent dimension to one. Consequently, it is found that a good and powerfully predictable correlation model can be obtained even when a significant correlation model cannot be obtained by using the full variables. A stable correlation model may be obtained by the
sequential selection of variables with the cross-validation. The inventors also find that a good correlation model based on statistics and
multivariate analysis other than the partial least square method can be obtained by selecting the explanatory variables by appropriately determining a function form, and that a correlation model suitable for an object variable for describing a respective
biological condition can be obtained. “Optimization” as used herein means that the cross validation is improved until no further improvement is possible in the corresponding analysis conditions when the explanatory variables are selected, and it never means that the cross validation can find an optimum combination among the entire combinations of the explanatory variables. By using the variable selection, a small number of factors for determining the diseases can be identified, and an inexpensive diagnostic device such as
a DNA chip, an
antibody chip and
a DNA content vector can be designed, so that the variable selection itself is valuable. This variable selection can be employed together with a various type of variable selection conditions to be set in advance.
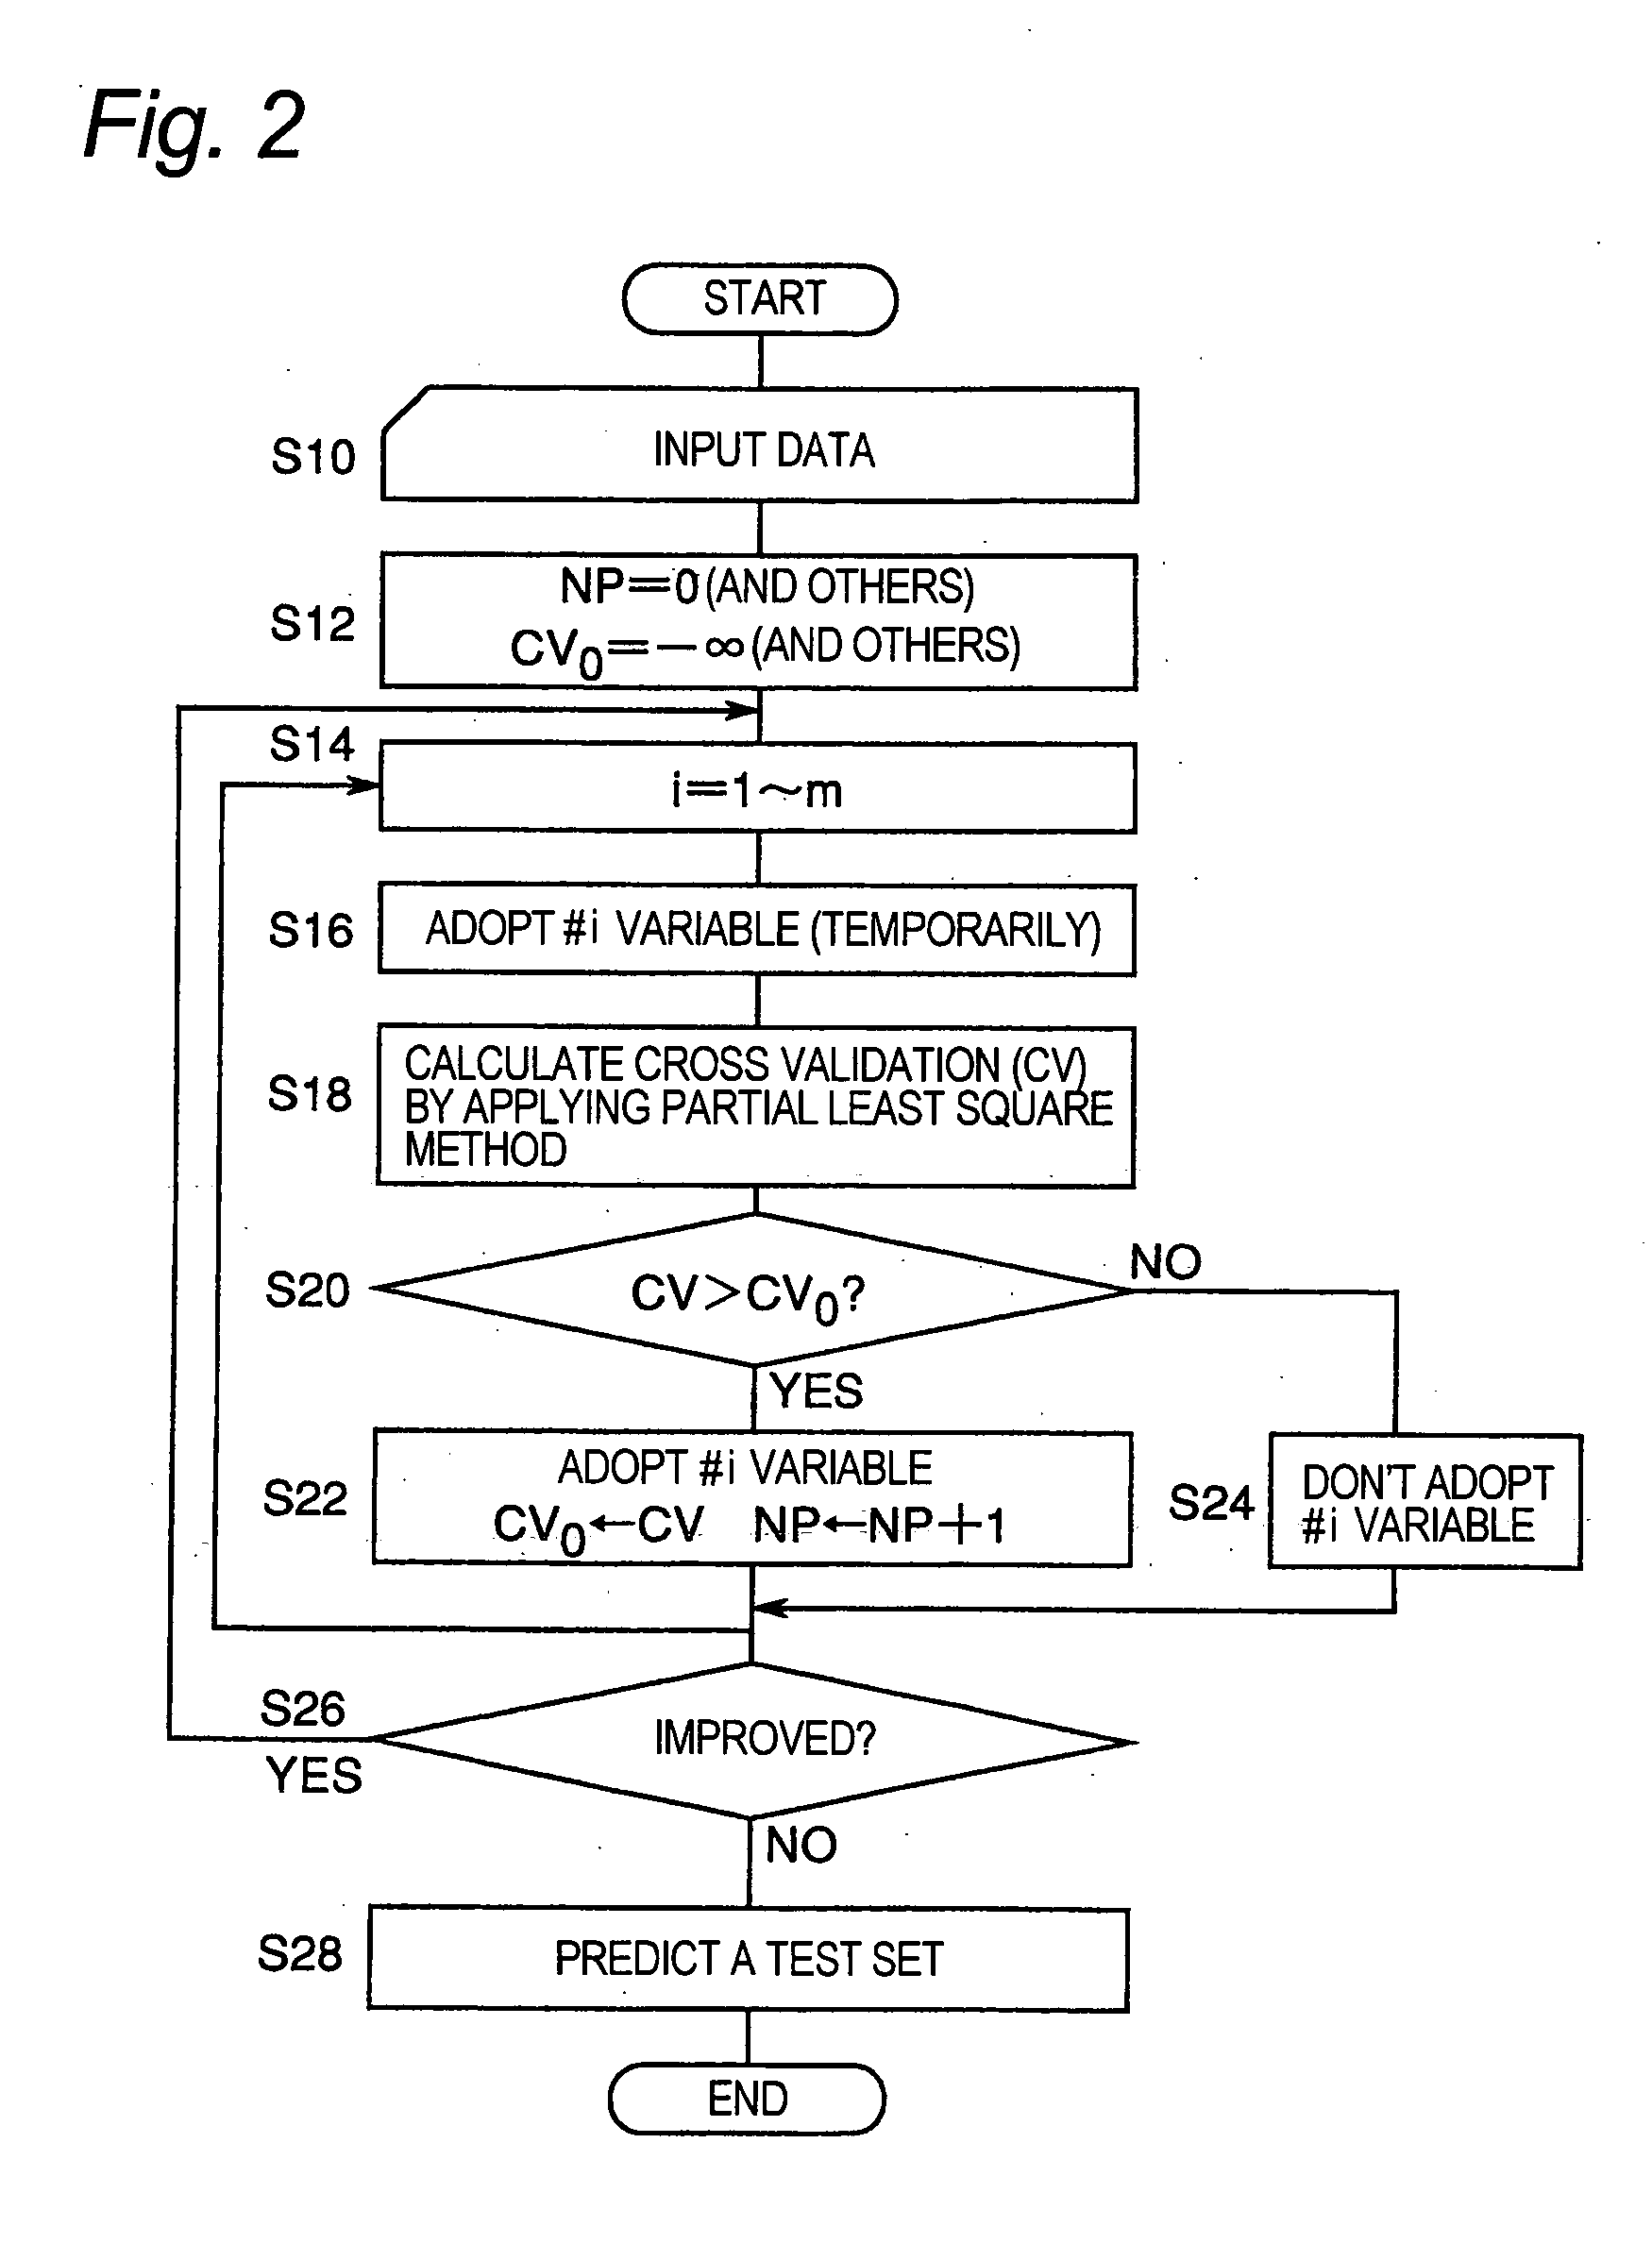
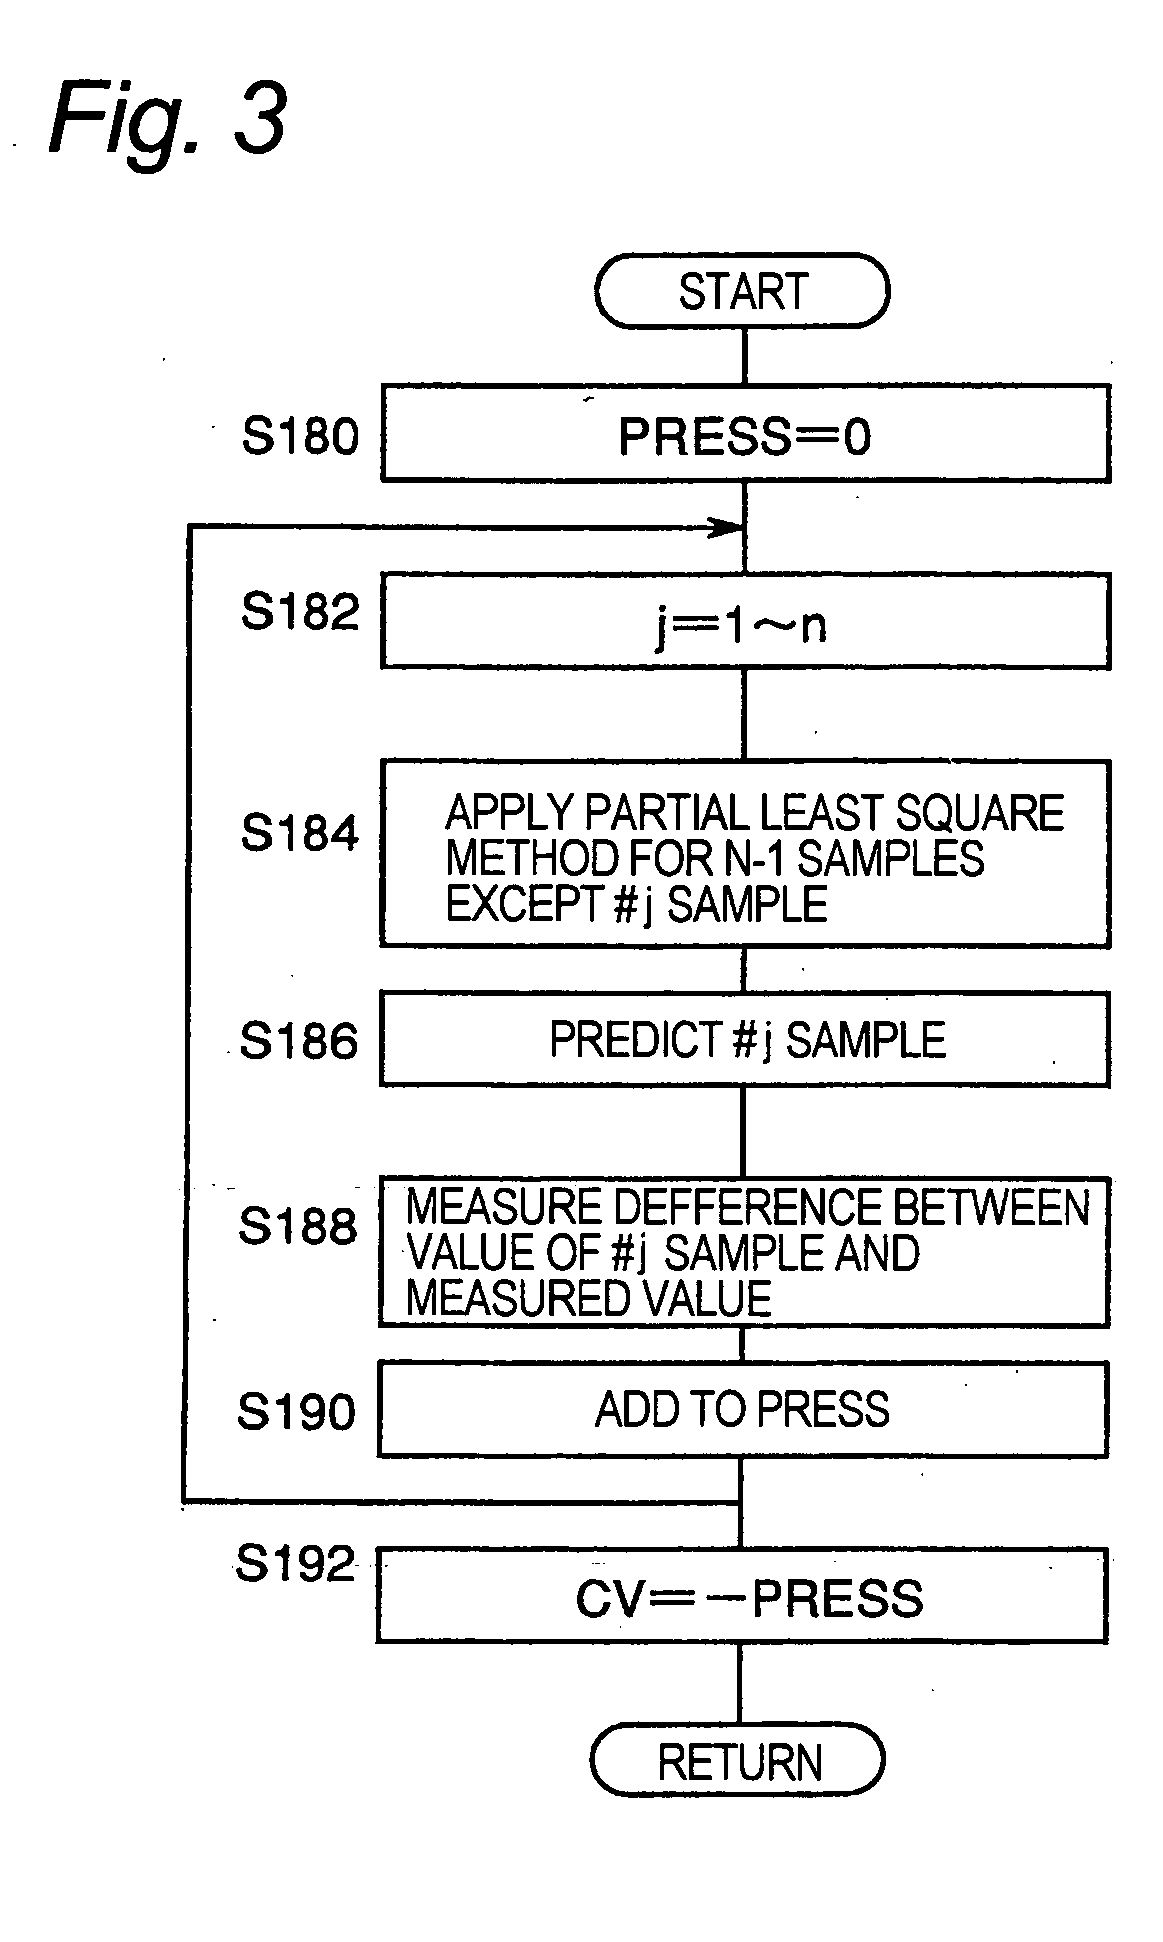
[0056] As mentioned above, the explanatory variables are sequentially selected based on the cross validation. A function having the cross validation as at least one independent variable is used for the selection. When an explanatory variable is added temporarily but the function is judged not to be improved by adding the explanatory variable, the addition of the explanatory variable is canceled. However, the addition of the explanatory variable is accepted when judged that the function is improved. Alternatively, when an explanatory variable is excluded temporarily but the function is judged not to be improved by excluding the explanatory variable, the exclusion of the explanatory variable is canceled, while the exclusion of the explanatory variable is accepted when judged to be improved. When one or more explanatory variables are selected, assessment of the cross validation is performed as follows. Partial least square models are obtained by excluding one or more samples among the n samples sequentially, and in each model the object variable for the
biological condition of the excluded sample(s) predictable from the
gene expression levels of the excluded sample(s) and then a representative value of errors relative to the object variable is determined. The “representative value” as used herein refers to a value characterizing the data such as a sum, an average, a maximum, a median and a mode value. The cross validation is judged to be improved when the value of the function having the representative value of the error as at least one of the independent variables is reduced, so that the corresponding explanatory variable is added or excluded. The function is continuously improved by sequentially assessing the cross validation while the explanatory variable(s) are sequentially selected. The selection of the explanatory variables is completed when no improvement is judged to be observed because the cross validation have been optimized. Consequently, an optimum partial least square model having a limited number of the selected explanatory variables is obtained. Actually, the
processing described above is
executable by employing a predicted residual error sum of squares (PRESS) as the index of the value of the cross validation obtained with a calculation device, and by determining to adopt an explanatory variable when the value of the predicted residual error sum of squares is reduced at a rate equal to or smaller than a threshold for the explanatory variable.
[0057] A
processing for avoiding
overfitting should be devised in an
analysis method for the causal relationship. “
Overfitting” as used herein means that a model has no predictable ability except for the data used for the
model fitting since the model fails to describe a true correlation due to a too large number of the explanatory variables although prediction of the model happen to agree with the data used for the
model fitting. The partial least square method is used as the correlation model here, and it is said relatively powerful against the problem of
overfitting because it is a powerful multivariate
analysis method that can perform both reduction of dimension and model fitting at the same time. However, one is confronted with a situation that a significant result cannot be obtained when a large number of variables are dealt as in the analysis of gene expression. Since the methods used by Alaiya and Khan described in the background art are valid on the premise that a full variables model is significantly valid, they cannot be used generally for selecting the variables. On the contrary, the invention can reduce
overfitting by selecting the variables so as to optimize the result of cross validation prediction. In addition, the invention provides a method not needing a preprocessing such as
principal component analysis. On the contrary, in the prior art methods, since a significant model cannot be obtained when the number of the explanatory variables is quite large, the dimension is compressed with a preprocessing such as the
principal component analysis based on the full explanatory variables, and the explanatory variables obtained by the preprocessing are used for analysis. However, in this method, the full explanatory variables used as the basis of the construction of the model are inevitable for prediction. For example, all the genes used for constructing the model are necessary to be held on a diagnostic gene chip, or the variables should be selected with a different method. On the contrary, in the invention, since the number of the explanatory variables is decreased by selecting them, only the genes corresponding to the selected explanatory variables are required to be held on a diagnostic gene chip as far as they correspond to the
gene expression level.
[0058] Todeschini et al. obtained a multiple
regression analysis model by selecting the variables so as to optimize the cross validation by a
genetic algorithm in order to predict
decomposition of organic compounds in the
atmosphere (P. Gramatics, V. Consonni & R. Todeschini, Chemosphere 38(5), 1371-78 (1999)). The model is constructed by using 53 compounds and 175 descriptors (Q2=0.79) to result in selection of seven variables and prediction of 98 compounds (Q2=0.75). This method is the same as the method in the invention in that the variables are selected so as to optimize the cross validation. However, because a multiple regression model is used, the number of the variables selected among the explanatory variables is forced to be small, and the method cannot be applied to the analysis of the gene expression levels and / or the quantities of intracellular substances. According to the inventors' experience, in a method for optimizing Q2 or PRESS, the number of the selected explanatory variables ranges from hundreds to several hundreds, and multiple regression model cannot be applied to the analysis. Todeschini et al. does not mention any
effective method for selecting the explanatory variables. This is because the number of the candidate of the original explanatory variables is 175 at most, and it is not necessary to select the explanatory variables. However, in the analytical field of gene expression quite different from the method described above, the number of the candidates of the explanatory variables amounts to several hundred and several thousands, even several tens thousands, for several tens to several hundreds of samples. Accordingly, a quite different idea from prior art is required.
[0059] When a correlation model between a biological condition and gene expression levels an / or the quantities of the intracellular substances is determined, a good correlation model is obtained in this embodiment by selecting the explanatory variables by sequentially adding or excluding an explanatory variable so as to optimize a function having the cross validation as at least one independent variable. Advantages of this approach are as follows, as will be apparent from the examples explained below.
[0060] A) Important genes and mechanisms working in the background of a
disease and a
biological phenomenon can be estimated or identified and they can be understood well.
