Modulated excitation fluorescense analysis

Inactive Publication Date: 2007-05-17
RGT UNIV OF CALIFORNIA
View PDF18 Cites 56 Cited by
  • Summary
  • Abstract
  • Description
  • Claims
  • Application Information

AI Technical Summary

Benefits of technology

[0030] The present invention overcomes several limitations of the previous methods. The present invention provides a platform for generating multiple excitation-dependent emission streams (that can be thought of as different “channels”) that can be collapsed into convenient ratiometric and non-ratiometric expressions that report on information including the structure, dynamics, stoichiometry and interactions of the biomolecules of interest, such as nucleic acids, proteins, nucleotides, peptides, fluorophore-chelator conjugates, peptide nucleic acids,

Problems solved by technology

However, Y2H systems have limitations including complications associated with using protein fusions, incorrect protein folding, incorrect post-translational modification, potential toxicity of the proteins of interest in yeast, erratic reproducibility with large fraction of false positives and false negatives [1,3].
Additionally, since the observable of Y2H is based on DNA transcription, the Y2H method is not suited for the study of DNA transcription factors or DNA-binding proteins.
Finally, use of Y2H requires several hours (due to the requirement of growing yeast cells) and cannot provide the accurate and complete characterization available for a homogeneous, solution-based, equilibrium-binding assay.
However, since diffusion times scale proportionally with m1/3 (m is mass), doubling the mass (e.g. due to protein homodimerization) increases the diffusion time only by 20%, a change difficult to measure with single-channel FCS and to use reliably for separating subpopulations.
However, FIDA and PCH do not account for different diffusion times of different species.
As a result, their extracted parameters are often skewed.
Moreover, FIDA/PCH time bins are chosen to be much smaller than diffusion time (to assume that molecules are immobile during the chosen time bin), leading to complete loss of diffusion-time information for all species.
However, FIMDA discards useful temporal information, such as the correlation between photons within a given time bin, as well as the correlation between successive time bins

Method used


Image

  • Modulated excitation fluorescense analysis
  • Modulated excitation fluorescense analysis
  • Modulated excitation fluorescense analysis

Examples


example 1

DNA Model Systems

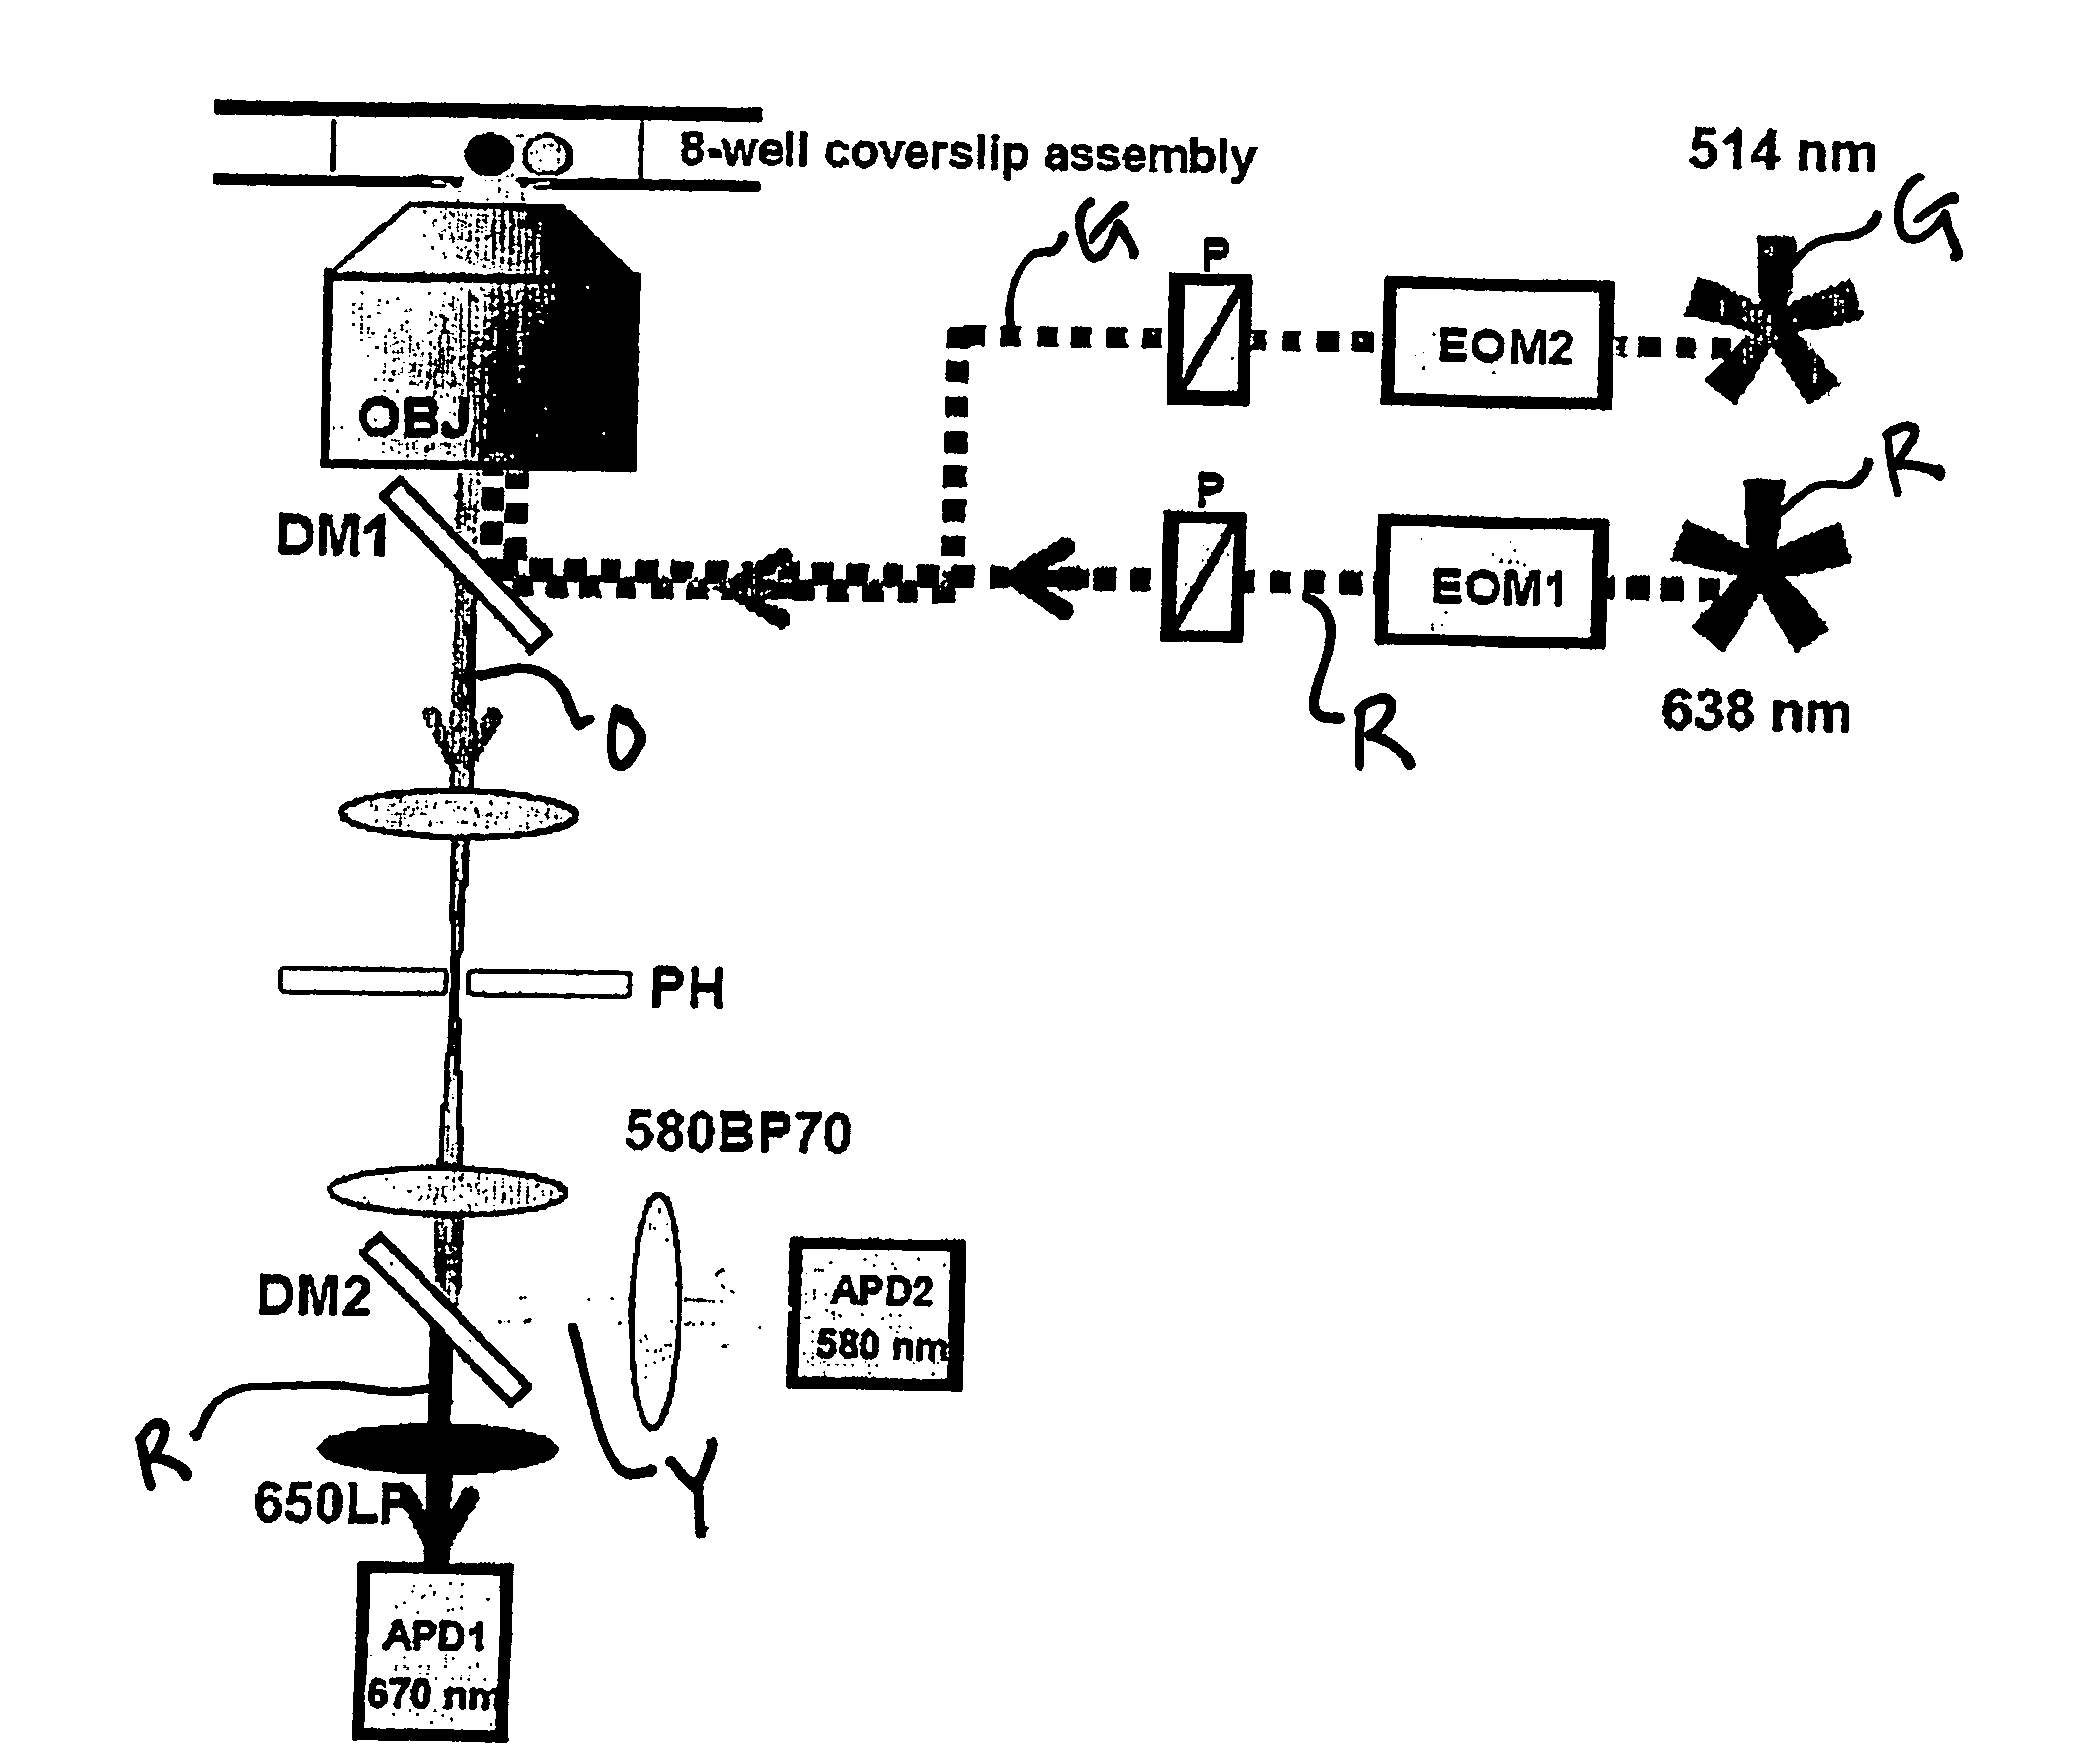
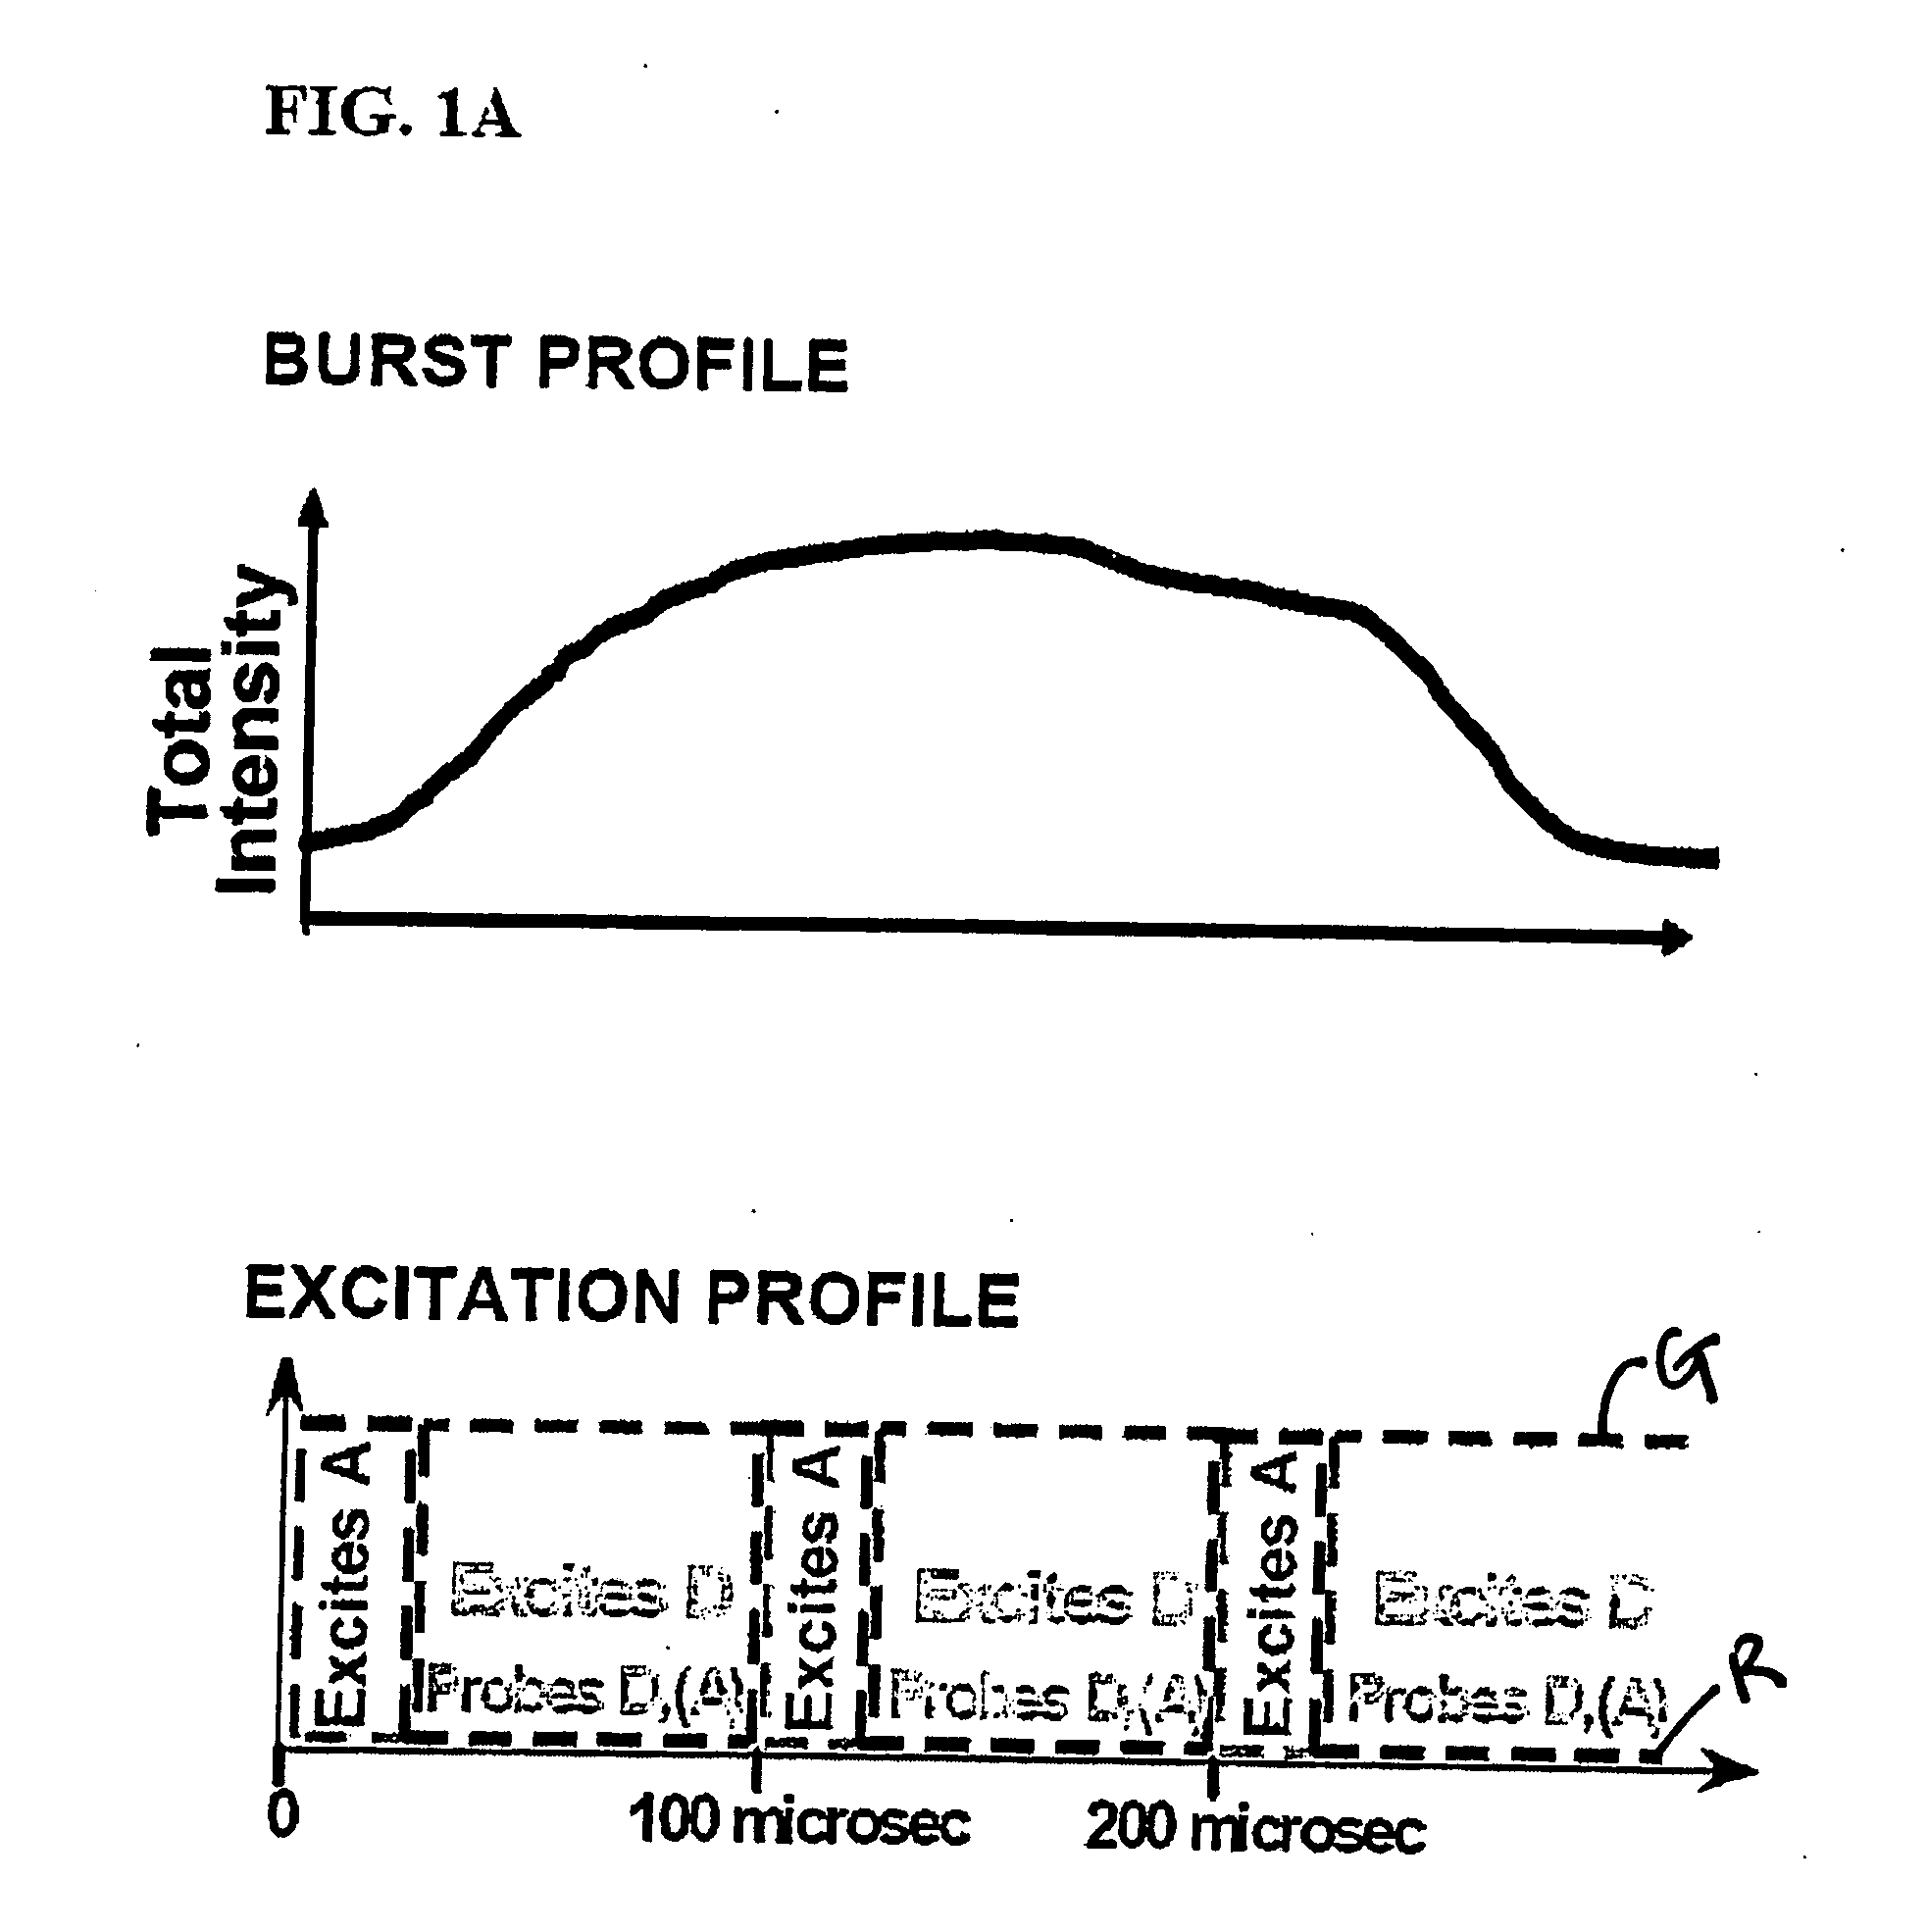
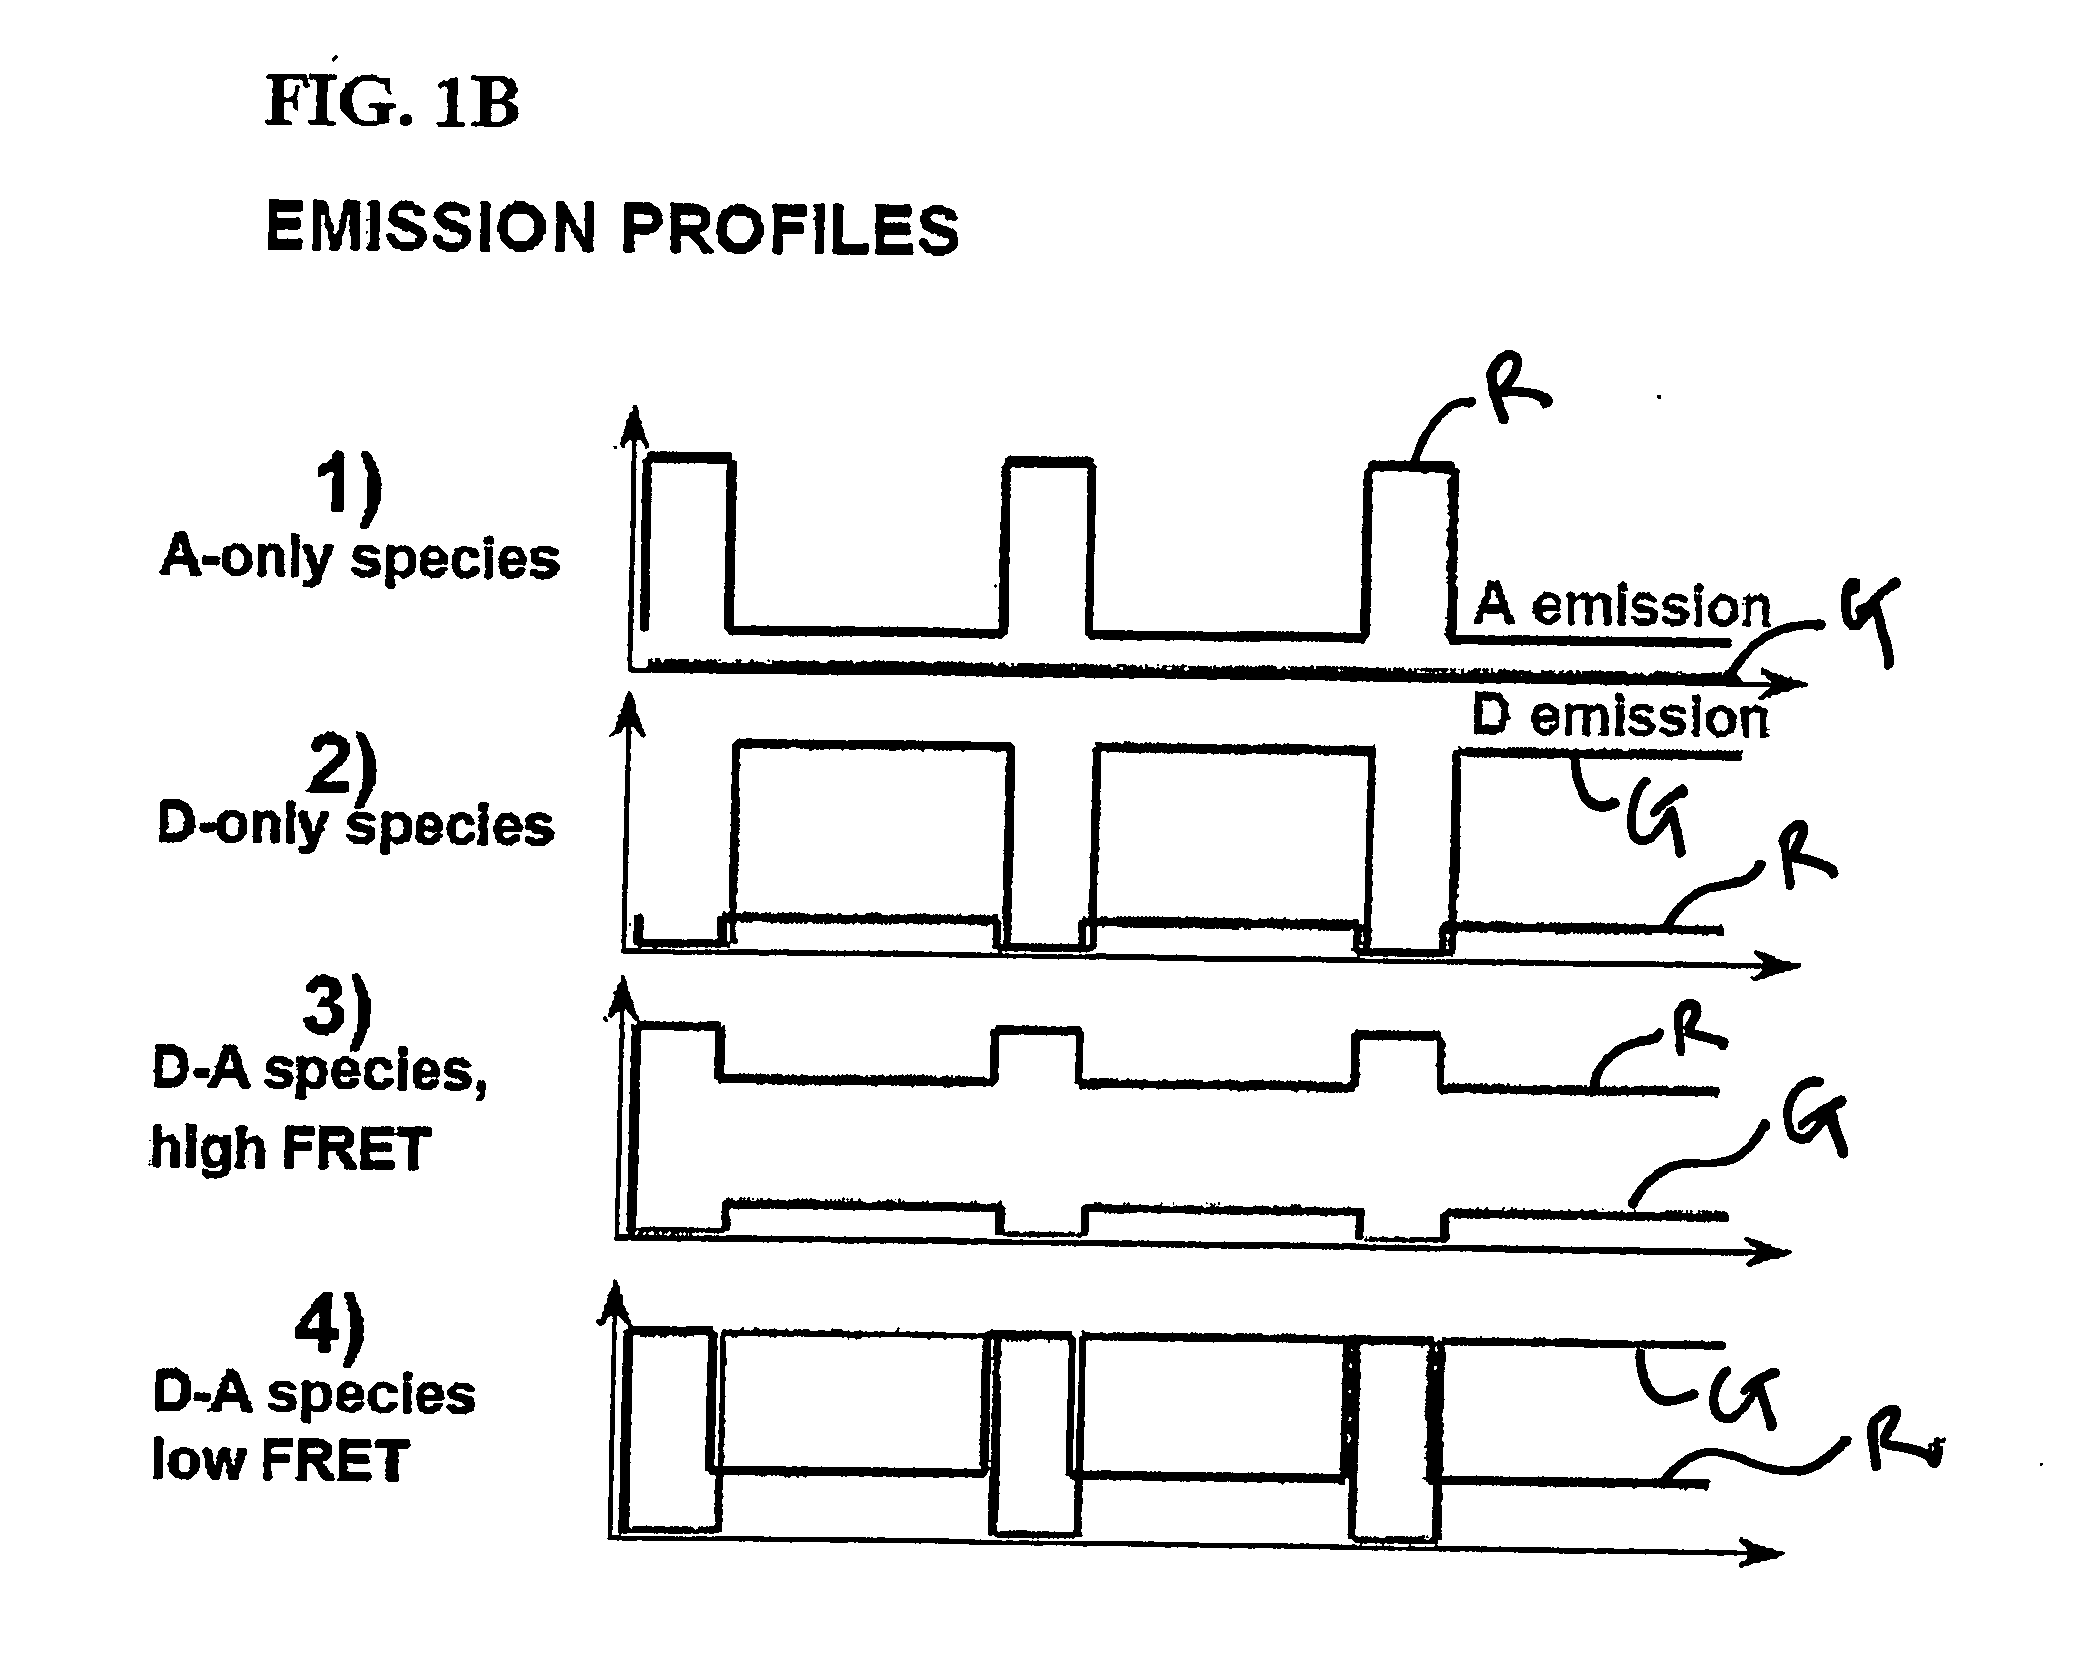
[0067] Using the instrumentation shown in FIG. 3, the ability of the present invention to resolve species containing different numbers of donors and acceptors (and to recover RDonor-Acceptor) was explored by studying fluorescently-labeled DNA fragments carrying donor and acceptor probes separated by approximately 4, 7, and 11 nm, corresponding respectively to high, low and zero-FRET species (FIG. 4A) [39]. 35 base pair DNA fragments were prepared by total synthesis using known-procedures. The sequence of the top strand was similar to one used in Ref. 25 with modifications that ensured identical local environment for the fluorophores used in each sample. We incorporated amino-dT residues (Glen Research, Sterling, Va.) at positions 1 or 5 of the top strand. The sequence of the bottom strand was complementary to the top strand. We incorporated amino-dT residues at positions 10, 20, or 30 of the bottom strand. Trityl-ON DNA fragments were HPLC-purified using a C2 / C18 ...

example 2

Monitoring Oligomerization

[0075] Several protein interactions are characterized by oligomerization of one or more of the interacting components. For example, most transcription factors oligomerize and bind to DNA with variable protomer:DNA stoichiometries. The ALEX ratio is sensitive to the ratio of the number of green fluorophores per complex (equivalent to donor fluorophores in the case of FRET) to the number of green fluorophores per complex (equivalent to acceptor fluorophores in the case of FRET). Specifically, for molecules with fluorophore stoichiometries‘green’2-‘red’,‘green’-‘red’, and‘green’-‘red’2 (separated by a large distance, E=0), the order: ALEX(‘green’2-‘red’)>ALEX(‘green’-‘red’)>ALEX(‘green’-‘red’2) applies. In this example, we evaluated the ability of the present invention to monitor oligomerization by comparing a DNA fragment carrying one ‘green’(Alexa532) and one ‘red’(Alexa647) with a DNA fragment carrying two ‘green’and one ‘red’. The E-ALEX histograms for t...

example 3

Resolving Mixtures of Species with Simulated Variable Environment of the Fluorophores

[0076] The E-ALEX histogram is also sensitive to differences in the brightness and emission spectra of the donors present in donor-acceptor (or ‘green’-‘red’) species. This is important for species labeled by fluorophores with emissions that are not fully resolved. It also allows the differentiation between species of the same composition that experience different local environments that affect molecular brightness (by quenching or photo-brightening). To demonstrate this ability, we prepared 3 DNA fragments, each with a different donor (TMR, Alexa532, or Cy3B), but identical acceptor (Alexa647), separated by the same distance (approximately 7 nm). The fragments were analyzed in the same manner as Example 1. The results show marked E and ALEX differences between samples with the different donors. The discrimination along both E and ALEX axes allows increased resolution of species using double 2D-Ga...


PUM


Abstract

Fluorescence, spectroscopy is used to analyze small numbers of molecules that are present in a relatively small detection volume or zone. Information regarding physical and chemical properties of these molecules is determined by rapidly modulating the wavelength, intensity and/or polarization of laser energy to excite fluorophores that are attached either to the molecule of interest or a molecule that interacts with the molecule of interest. The emission profile of the fluorophores is used to determine useful information about the labeled and/or non-labeled molecules including molecular interactions between th molecules.

Description

BACKGROUND OF THE INVENTION [0001] 1. Field of the Invention [0002] The present invention relates generally to analytical methods where fluorescence spectroscopy is used to analyze small numbers of molecules that are present in a relatively small detection volume or zone. More particularly, the present invention involves determining a wide variety of physical and chemical properties of one or more molecules by rapidly modulating the wavelength, intensity and / or polarization of beams of laser energy to excite fluorophores that are attached either to the molecule of interest or a molecule that interacts with the molecule of interest. The emission profile of the fluorophore is used to determine useful information about various properties of the labeled and / or non-labeled molecules including molecular interactions between the molecules [0003] 2. Description of Related Art [0004] The publications and other reference materials referred to herein to describe the background of the invention...

Claims


Application Information

Patent Timeline
IPC IPC(8): G01J3/30G01N21/64
CPCG01J3/4338G01J3/4406G01N21/6408G01N21/6428G01N21/6445G01N21/6458G01N21/648G01N2021/6419G01N2021/6421G01N2021/6441
Inventor WEISS, SHIMONKAPANIDIS, ACHILLEFSLAURENCE, TED A.LEE, NAM K.
Owner RGT UNIV OF CALIFORNIA
Why Eureka
Try Eureka