Method and apparatus for determining properties of fuels
a technology of fuel properties and methods, applied in chemical methods analysis, instruments, material analysis, etc., can solve the problems of labor intensive, require controlled laboratory conditions, and take 30 minutes or more to perform, and achieve the effect of effective operation
- Summary
- Abstract
- Description
- Claims
- Application Information
AI Technical Summary
Benefits of technology
Problems solved by technology
Method used
Image
Examples
example one
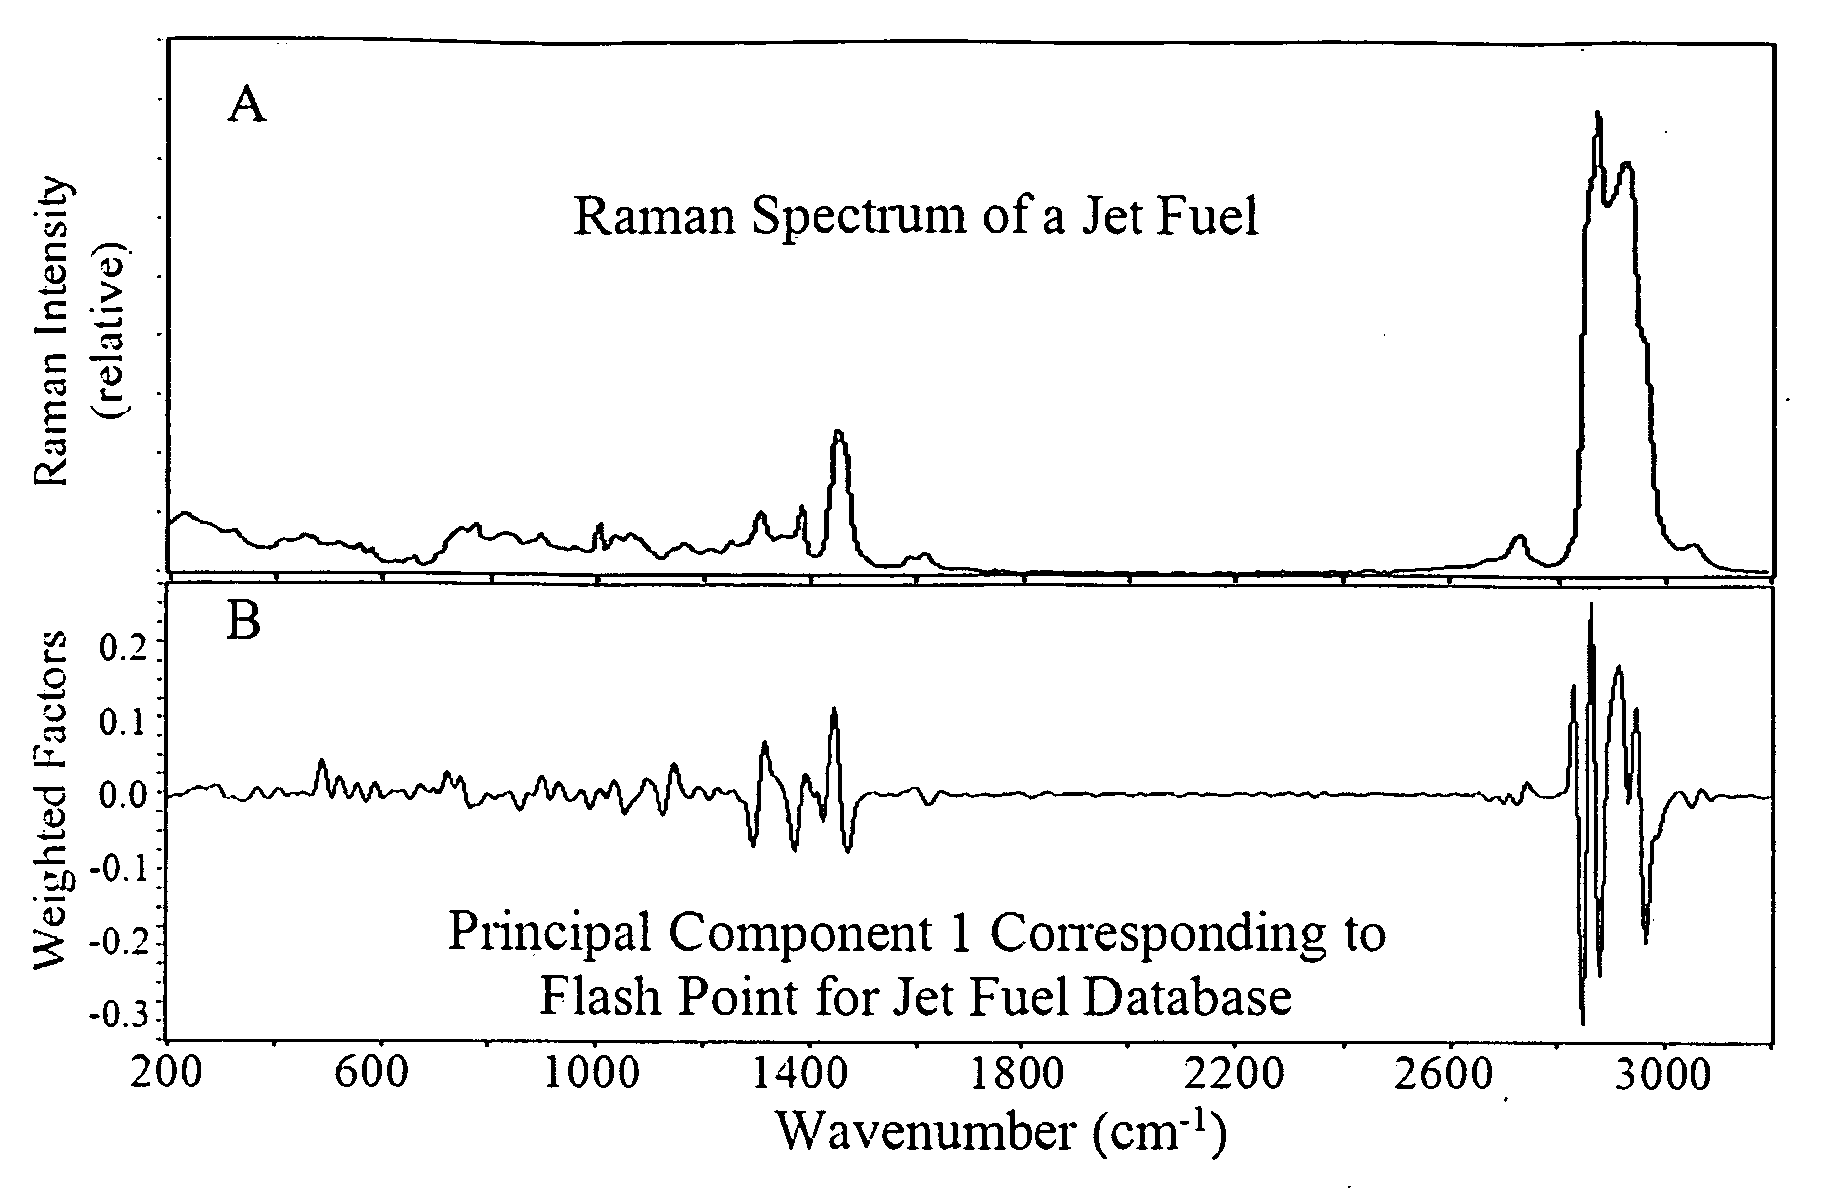
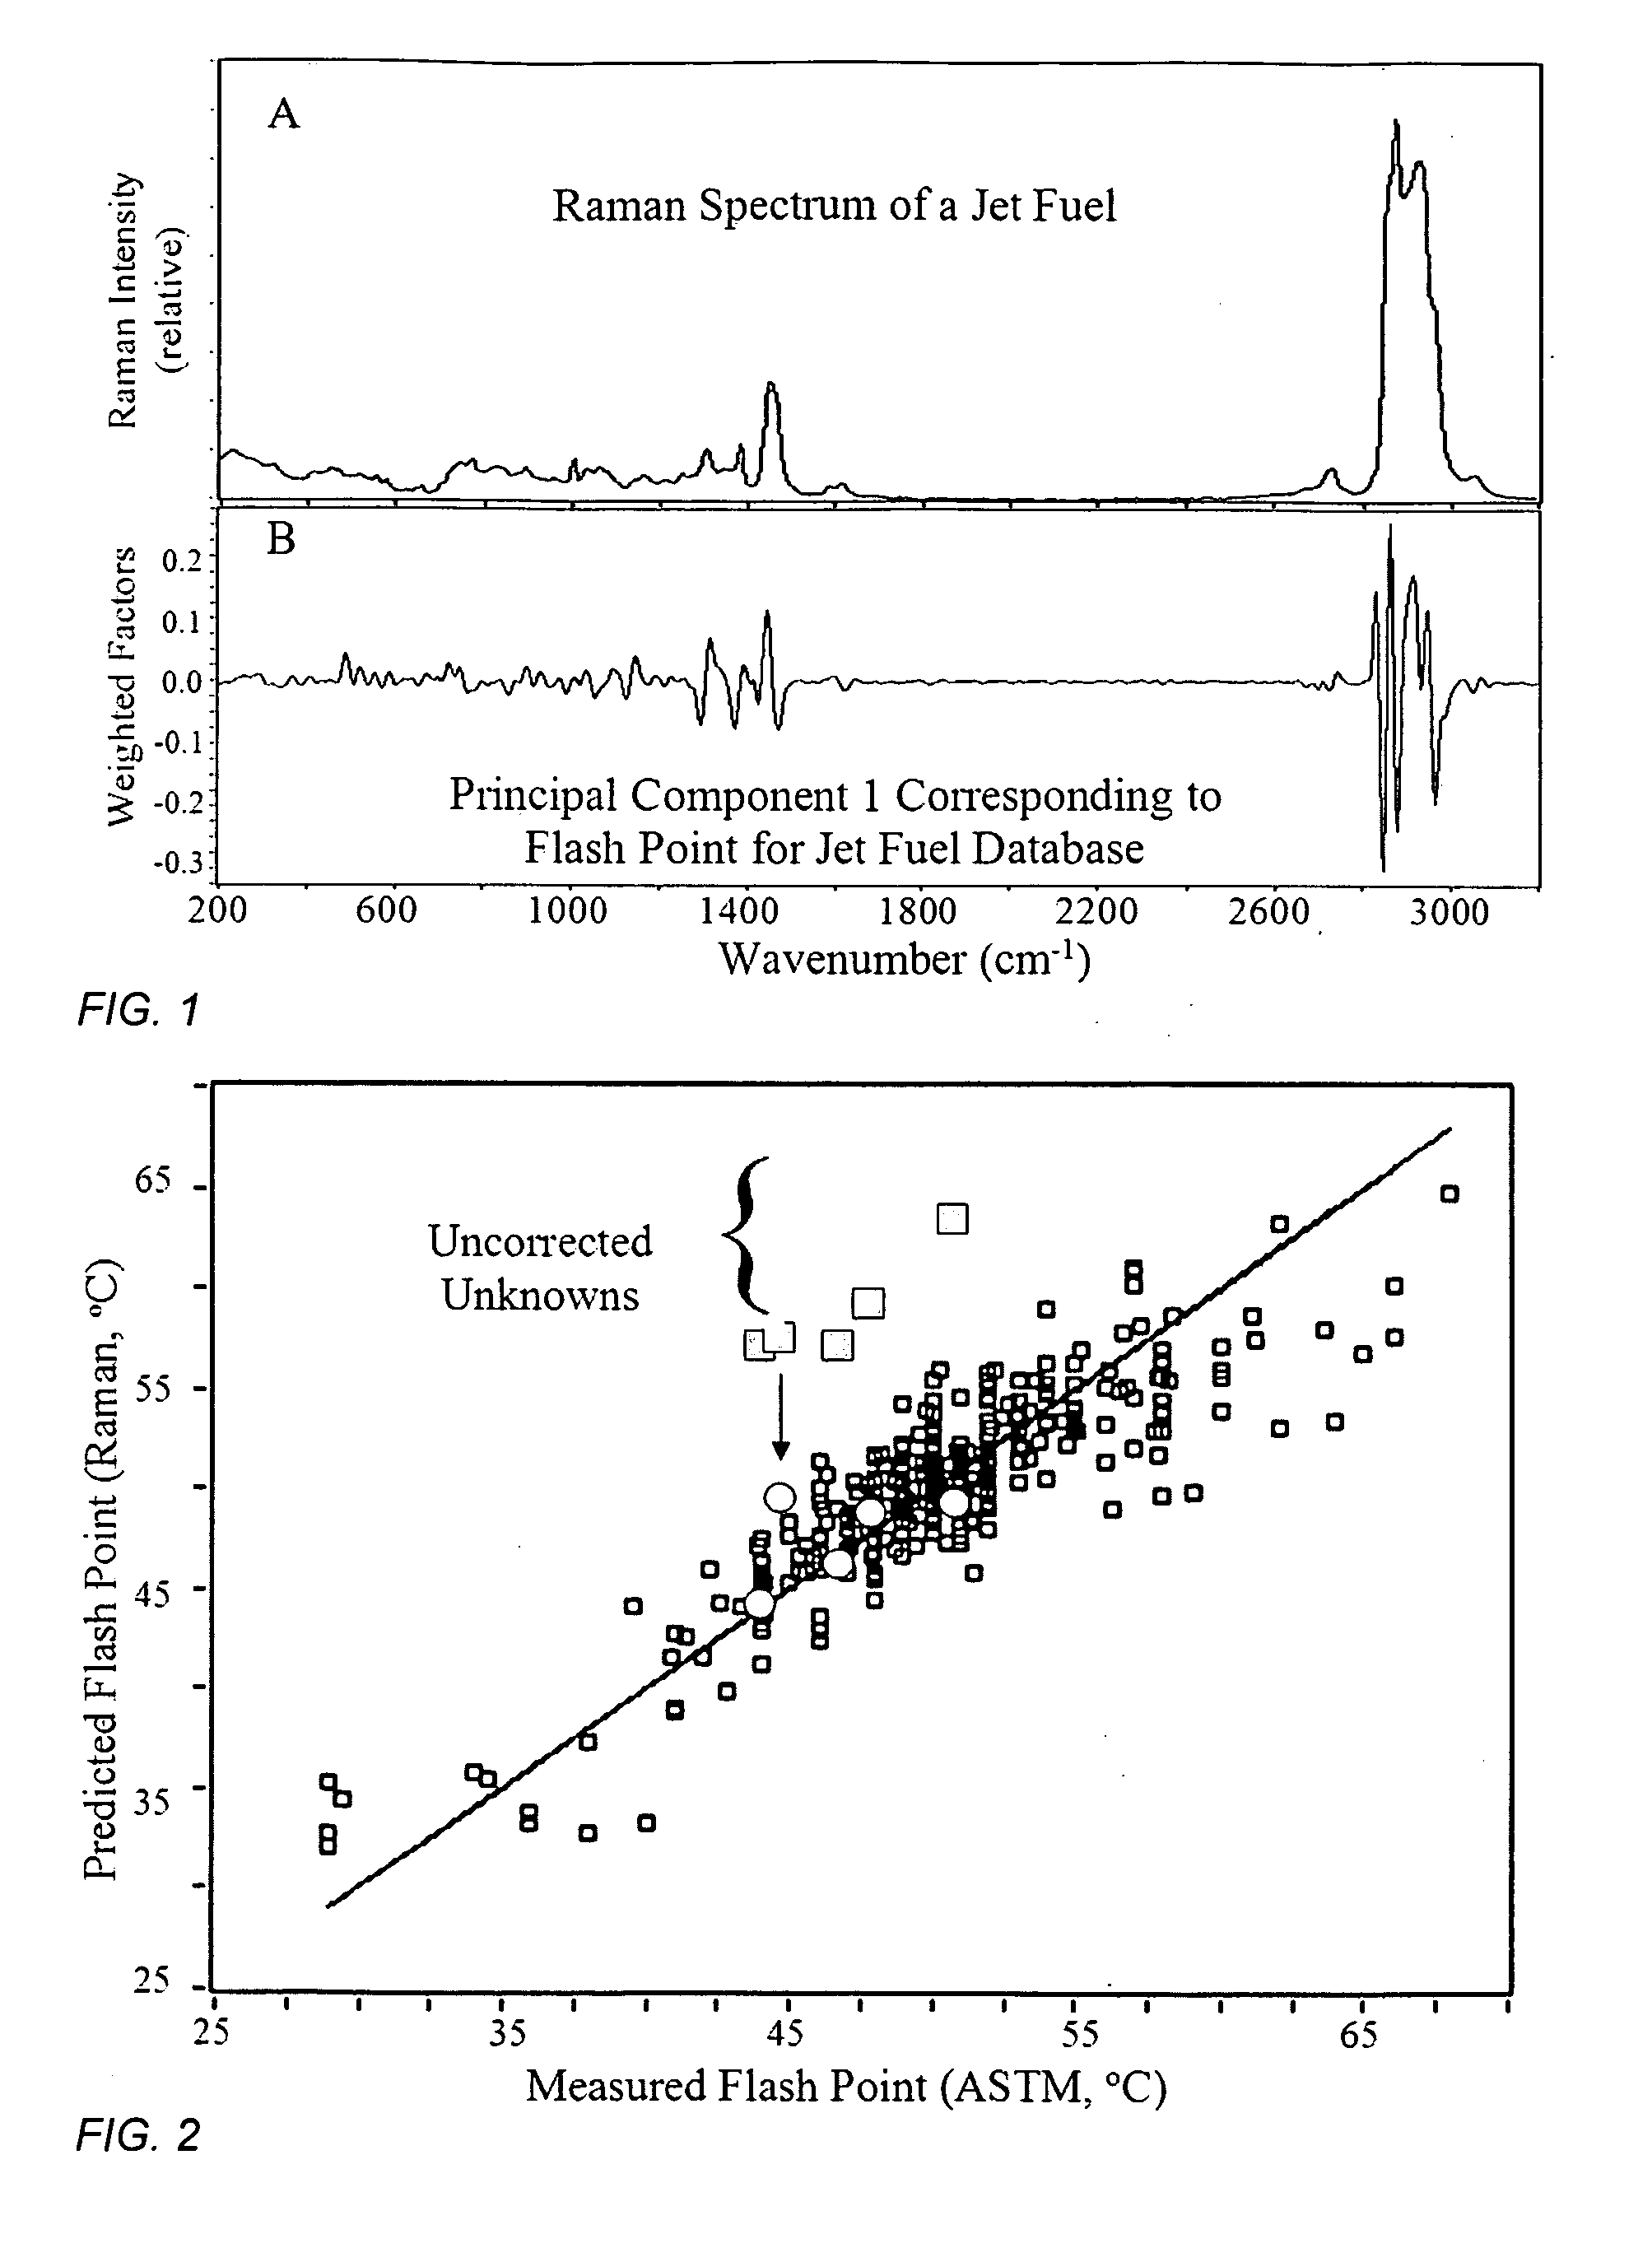
[0067]The flash points of 320 jet fuels were measured manually by numerous people at several laboratories according to the ASTM D93 method, discussed above, which at best is reproducible to a standard deviation of 4.3° C. These 320 samples were placed in 2 mL glass vials and their Raman spectra were measured using a portable FT-Raman spectrometer employing 0.5 W of 1064 nm excitation laser power, 8 cm−1 resolution and a 60 second accumulation time. A typical Raman spectrum is shown in FIG. 1A.
[0068]A correlation model between the measured Raman spectra and flash points was initially developed by first examining the entire spectrum (200 to 3200 cm−1) to determine the regions that correlated most to the flash point values. Principal Component 1 showed that weighted factors, both positive and negative, in the regions from 700 to 1700 cm−1 and 2700 to 3100 cm−1 provided the greatest correspondence (FIG. 1B). The model was then refined by using just these spectral regions, as well as thr...
example two
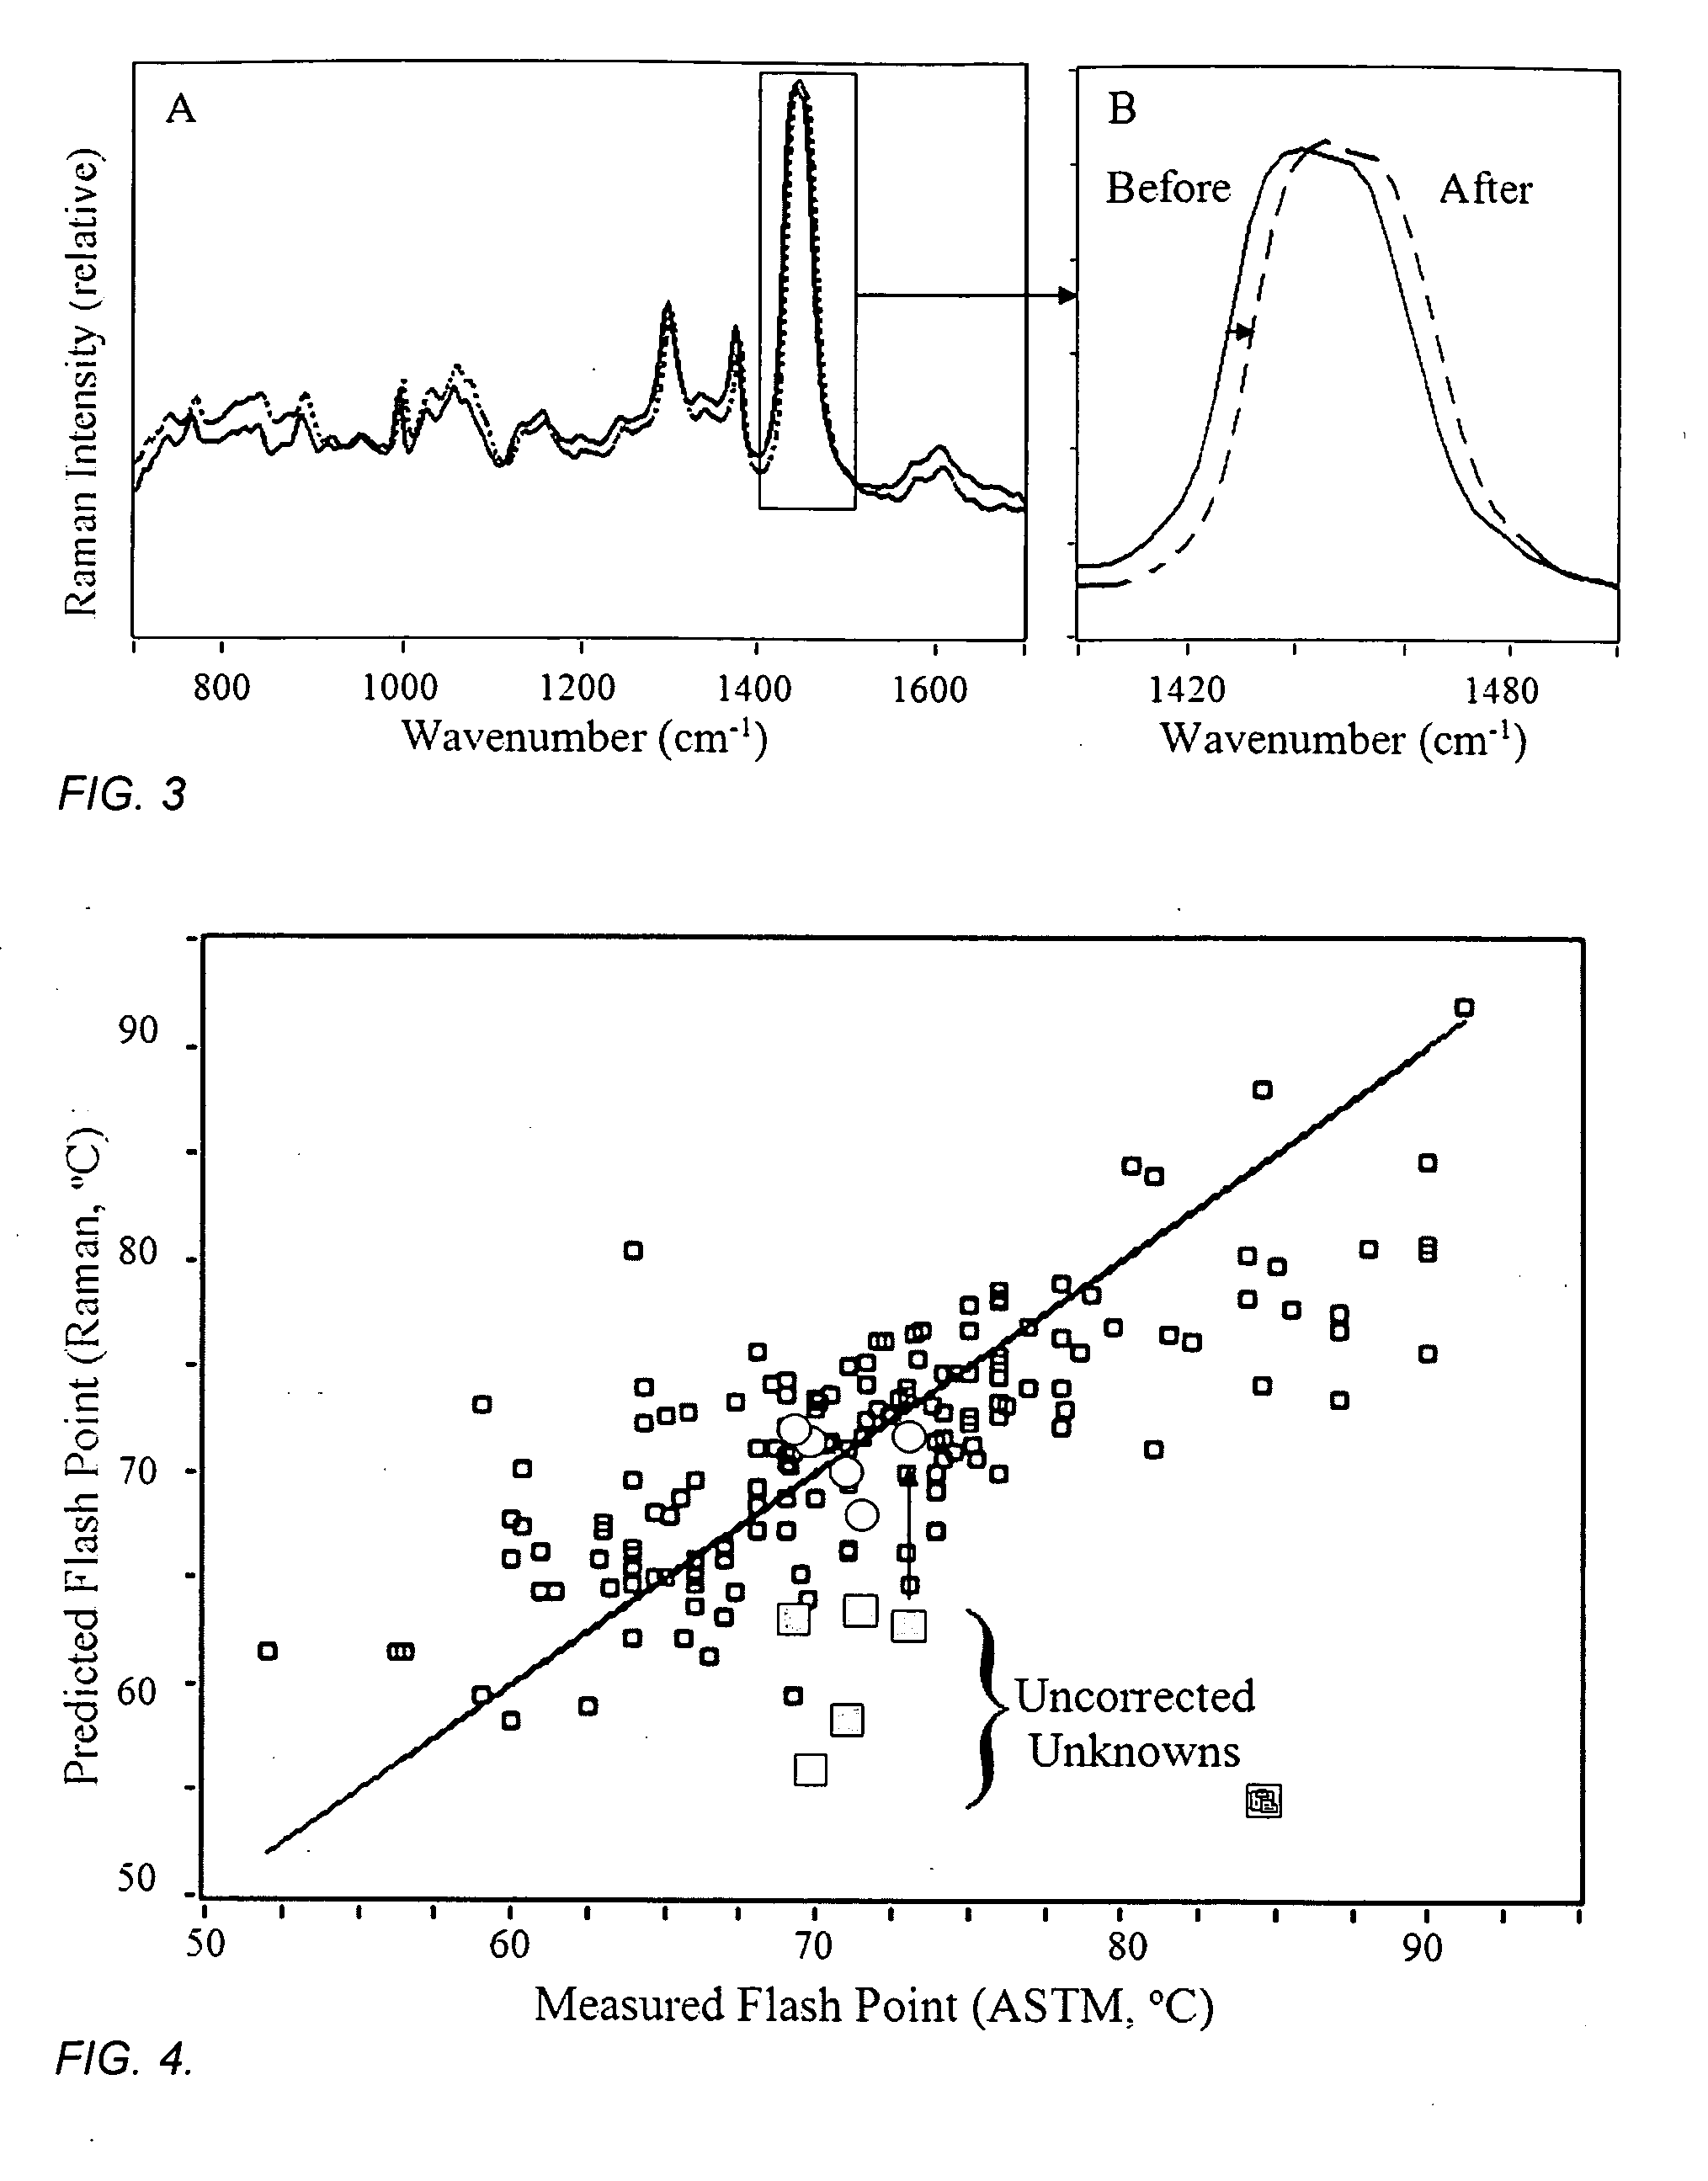
[0072]The flash points for 180 diesel fuels were also determined according to the ASTM D93 method, which has a standard deviation of 5.8° C. for this fuel class. The Raman spectra were recorded for these samples using the measurement conditions described in Example One, and a correlation model between the measured Raman spectra and flash points was developed (FIG. 4). The R2 error for the fit to the data is 0.68 and the standard error of prediction for this data set is 4.83° C. Five diesel fuel samples, not contained in the model data set, were measured by Raman spectroscopy as described above, and the diesel correlation model was used to predict their corresponding flash point values with reasonable accuracy (FIG. 4, circles). The same samples were again measured by Raman spectroscopy, but instead at temperatures of −32 and +52° C. (thermo-couple reading of the sample), and are found to have slightly different Raman spectra from those obtained from room temperature samples, defined...
example three
[0075]It is sometimes important to classify samples of unknown fuels, or even determine the grade of fuel within a class. This can be determined by measuring all of the appropriate properties, chemical, chemical-based, and physical, that define each fuel class and grade. For example, the high aromatic content of gasoline allows it to be differentiated from jet or diesel fuel, while the latter two fuels can be differentiated based on their flash point values. Specifically, if the flash point is below 60° C. it is likely a jet fuel, while above 60° C. it is likely a diesel fuel (see FIG. 2 and FIG. 4). This can also be accomplished by measuring the Raman spectrum of the sample. Aromatic organic chemicals produce two Raman peaks at ˜1000 and 1380 cm−1, corresponding to single and double-ringed groups. The former peak is very intense in the Raman spectra of gasoline, and it can be used to differentiate this class of fuel from the others (FIG. 6). While the present invention can be used ...
PUM
 Abstract
Description
Claims
Application Information
 - R&D
- Intellectual Property
- Life Sciences
- Materials
- Tech Scout
- Unparalleled Data Quality
- Higher Quality Content
- 60% Fewer Hallucinations
Browse by: Latest US Patents, China's latest patents, Technical Efficacy Thesaurus, Application Domain, Technology Topic, Popular Technical Reports.
© 2025 PatSnap. All rights reserved.Legal|Privacy policy|Modern Slavery Act Transparency Statement|Sitemap|About US| Contact US: help@patsnap.com


