

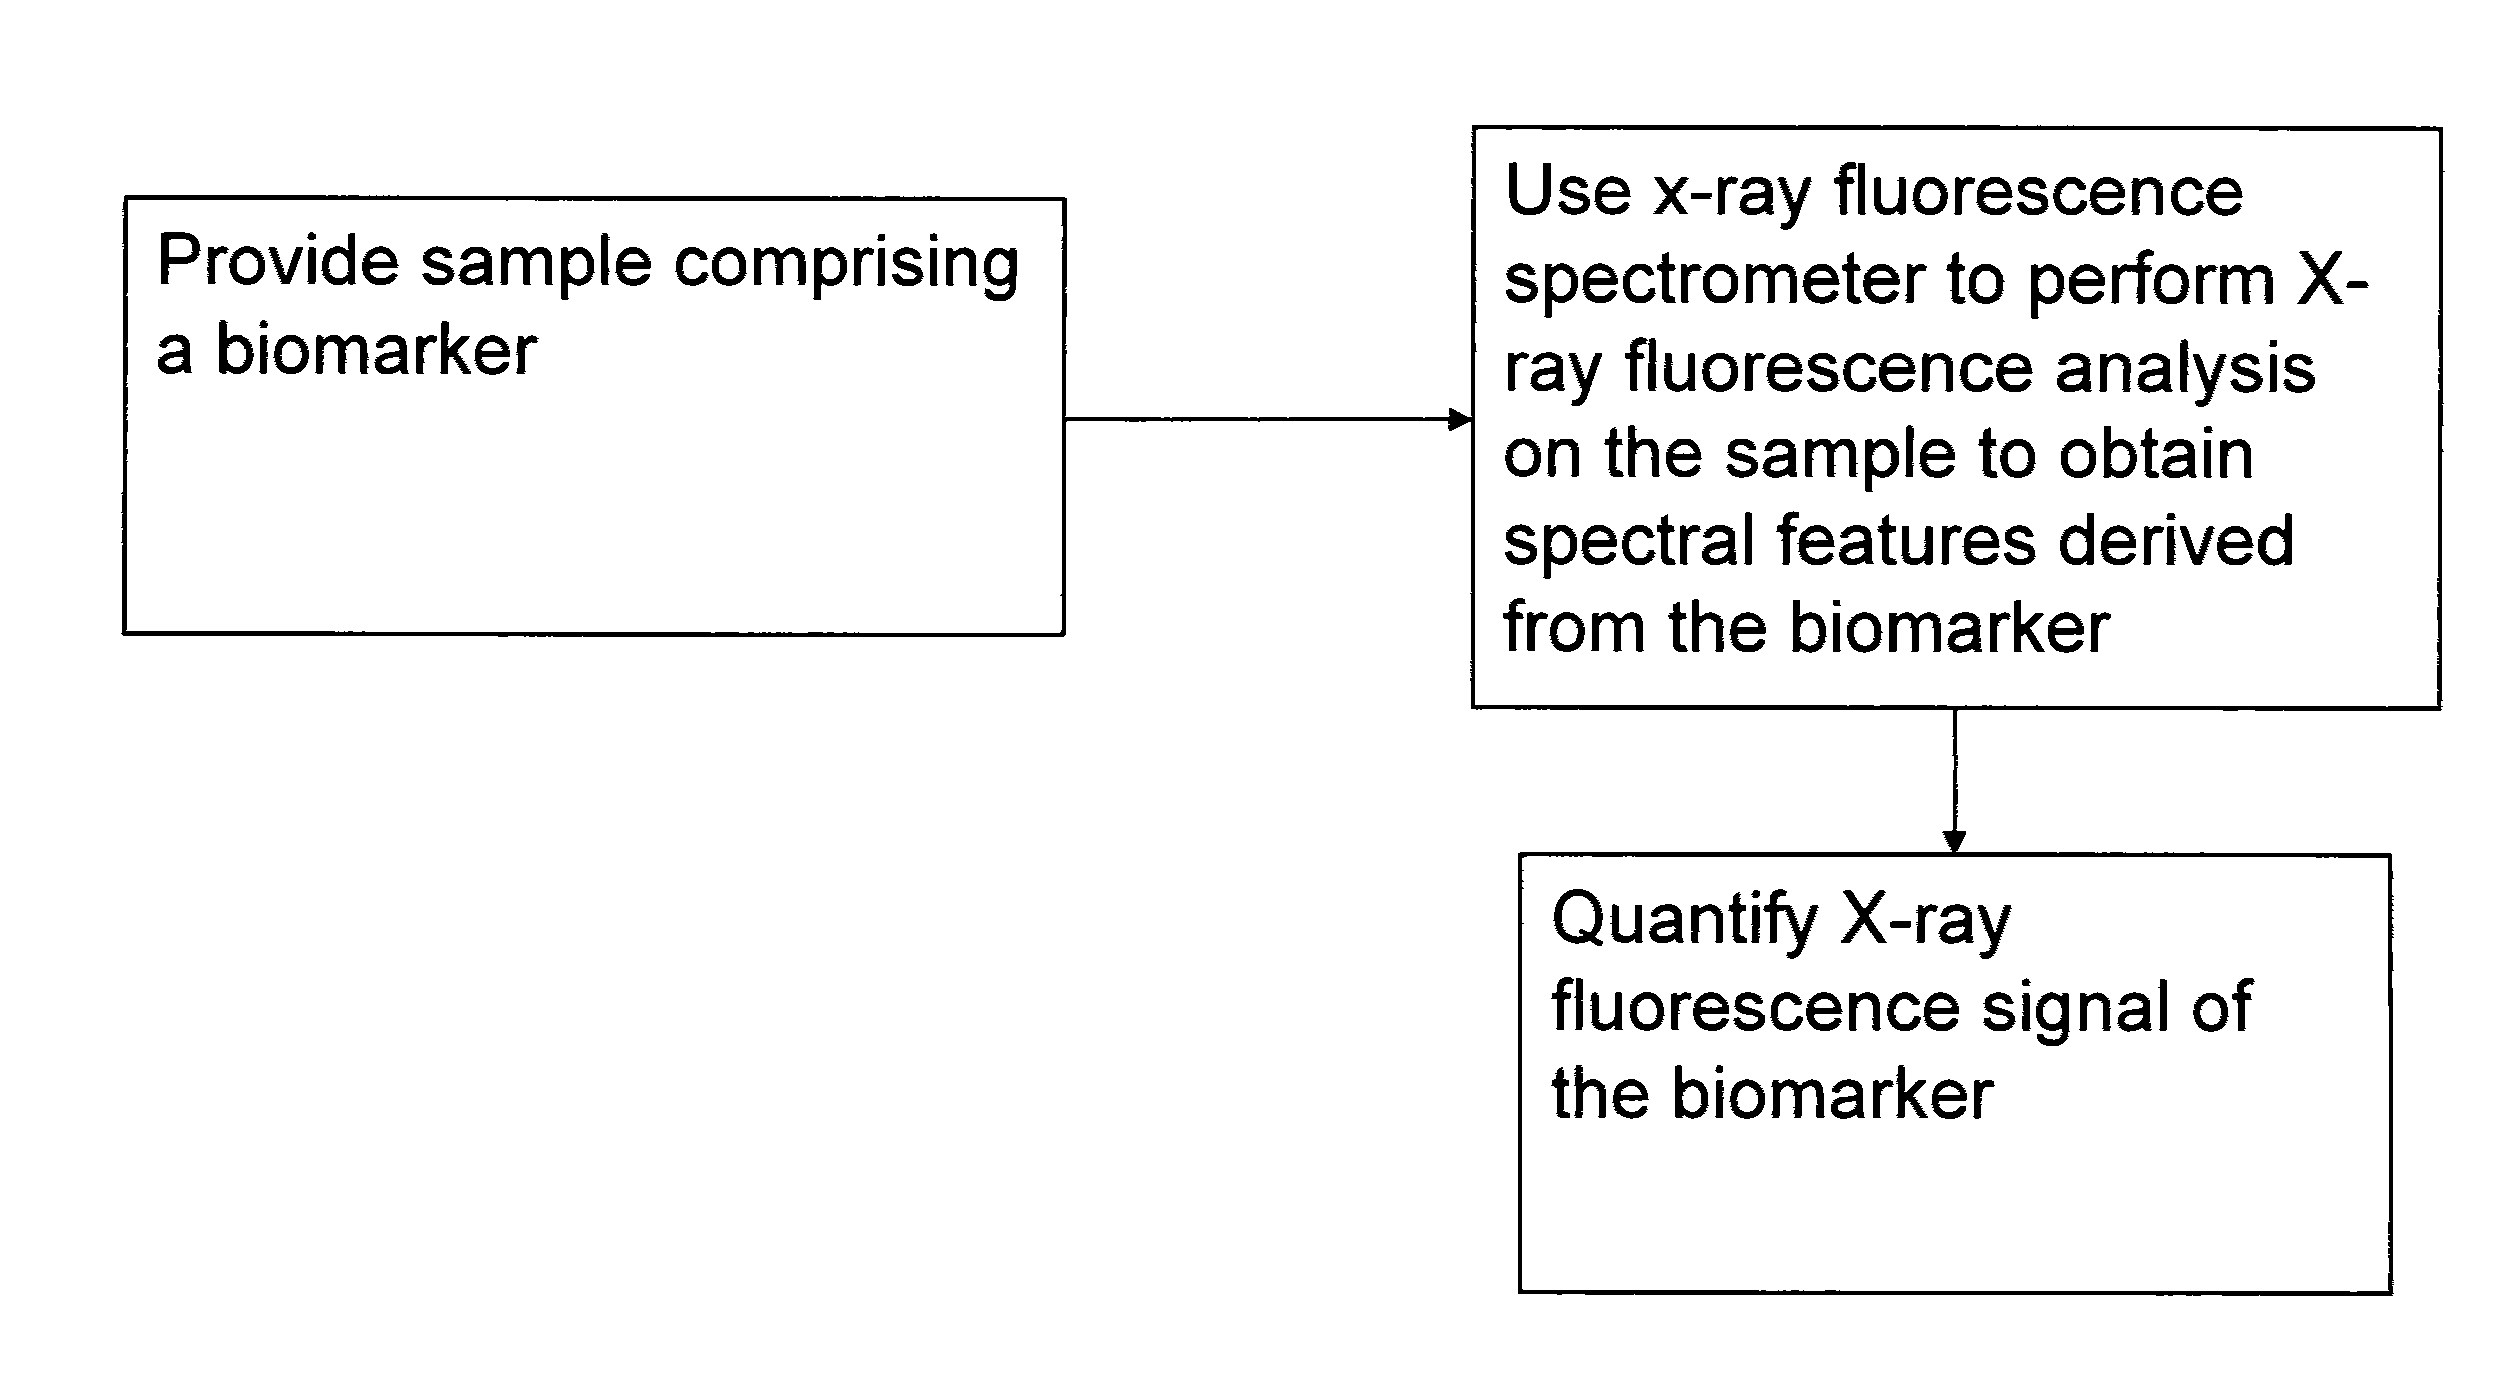
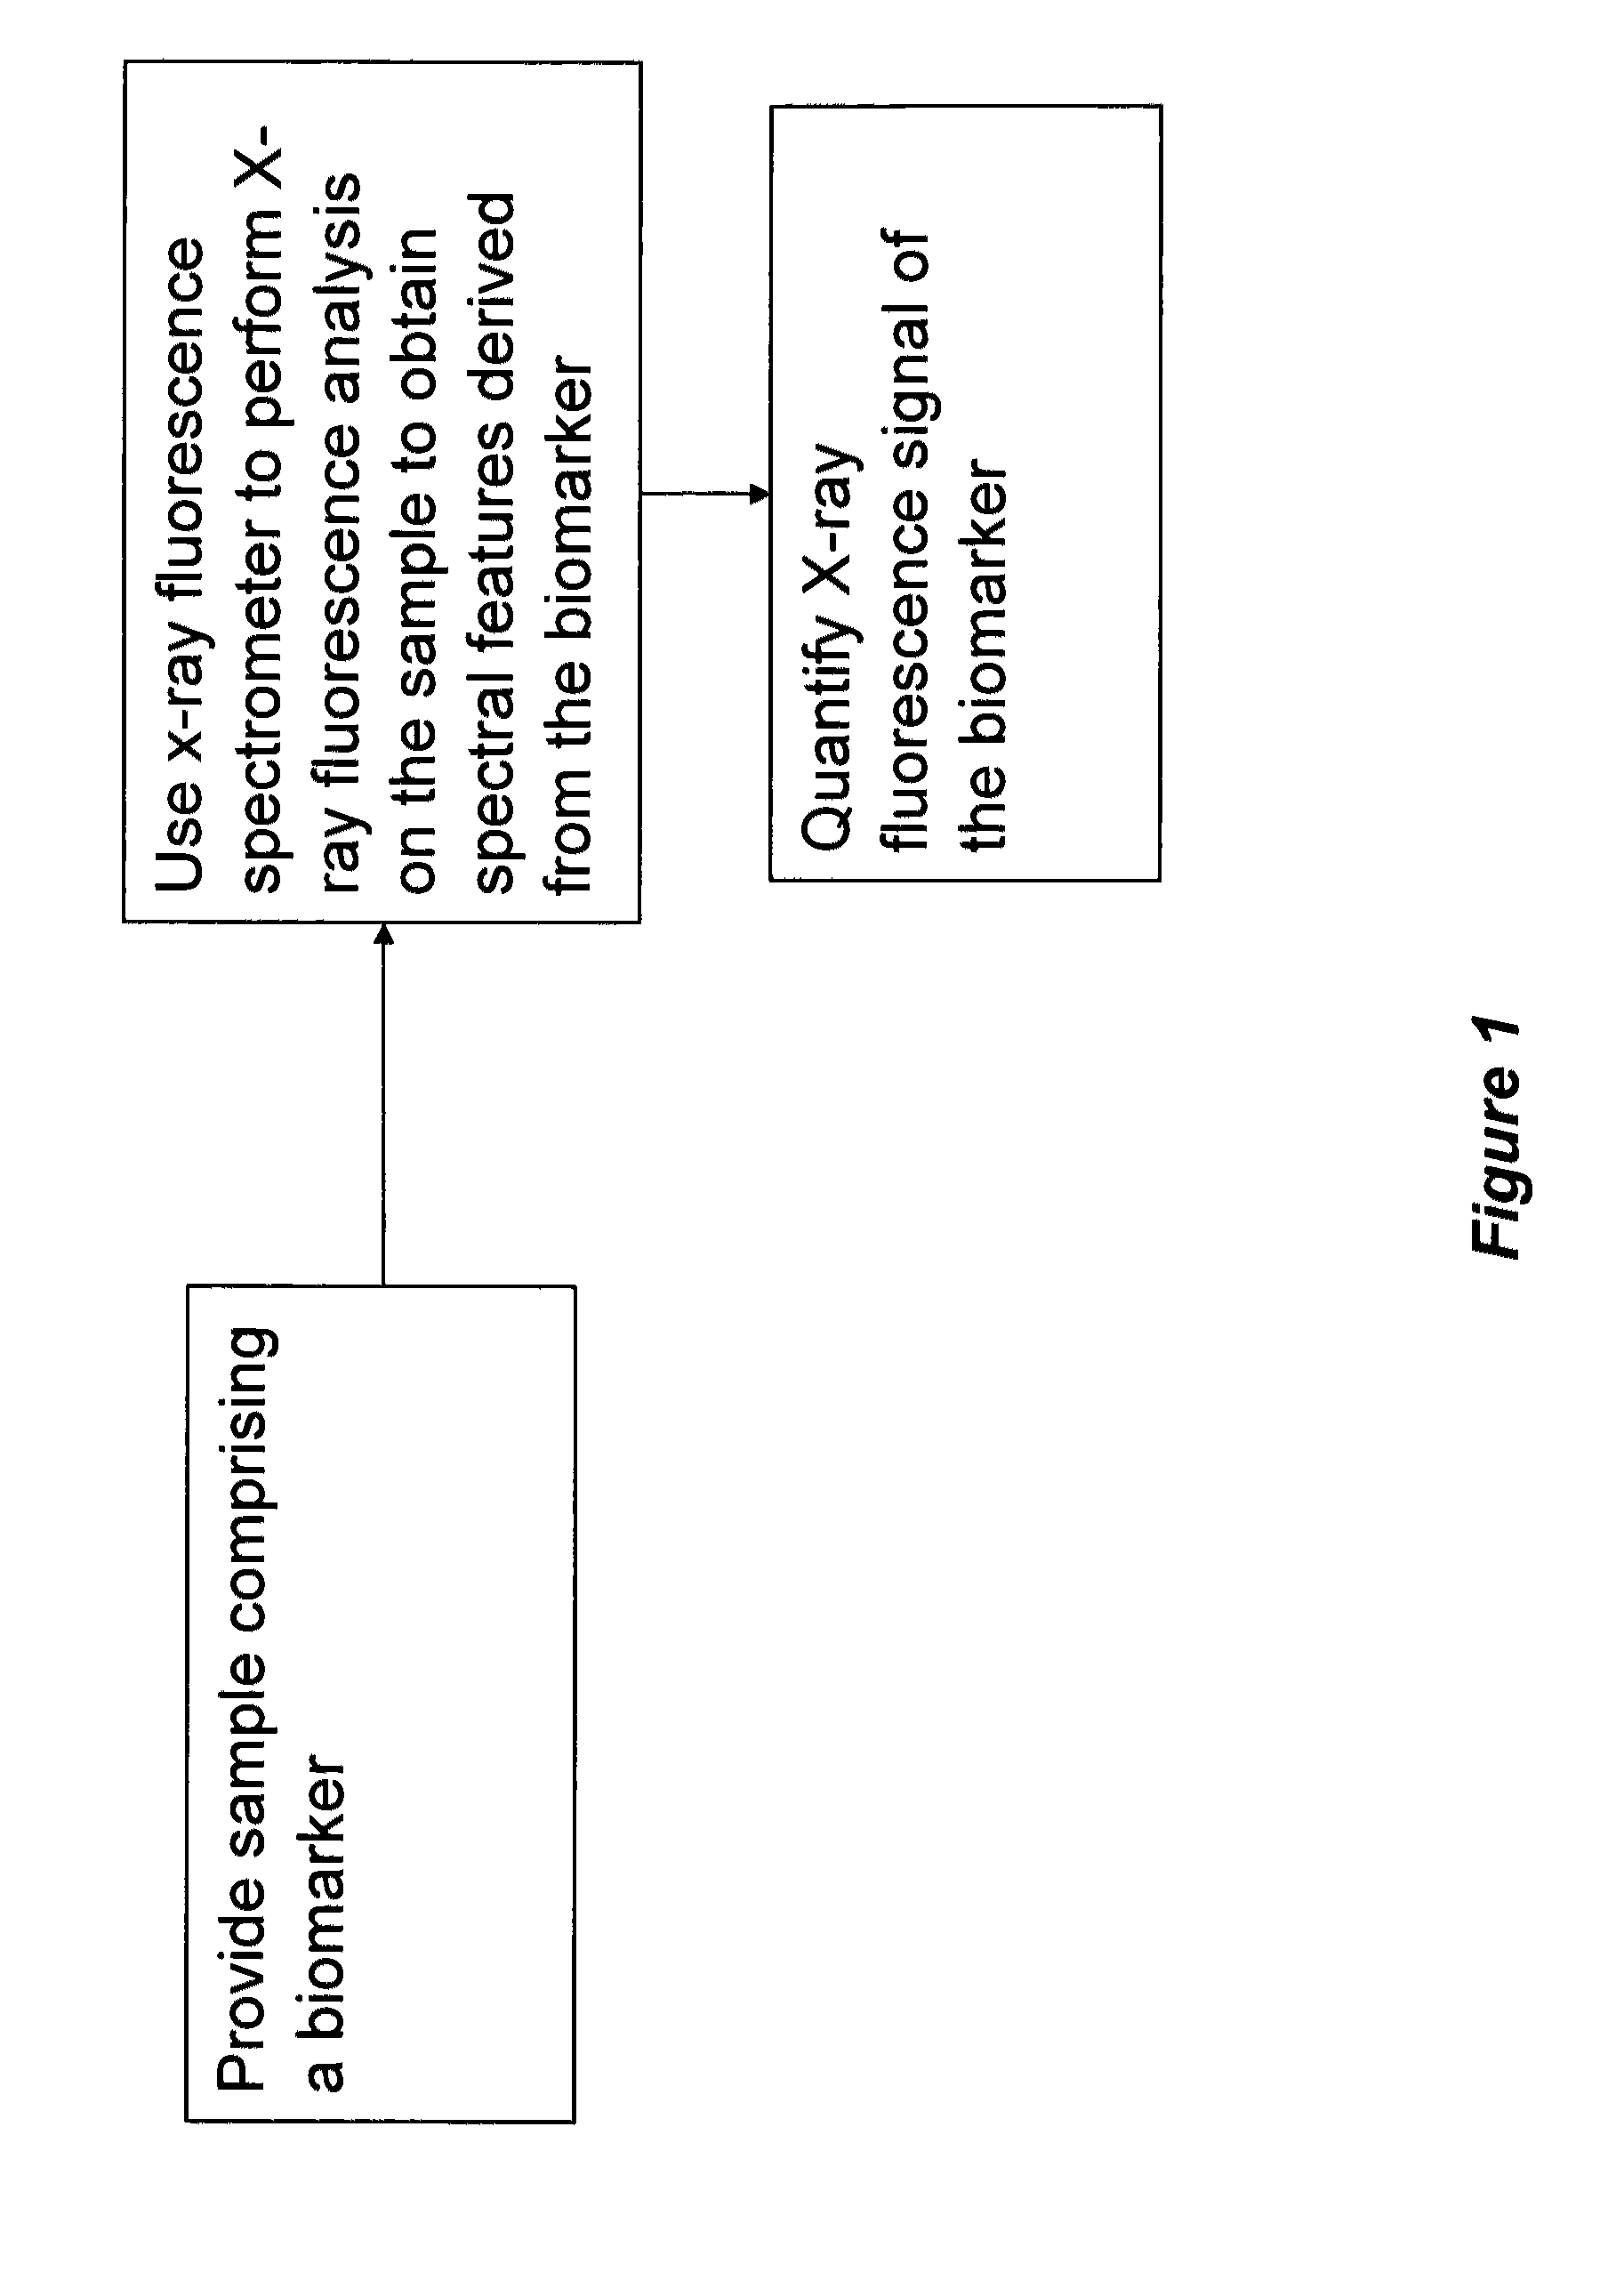
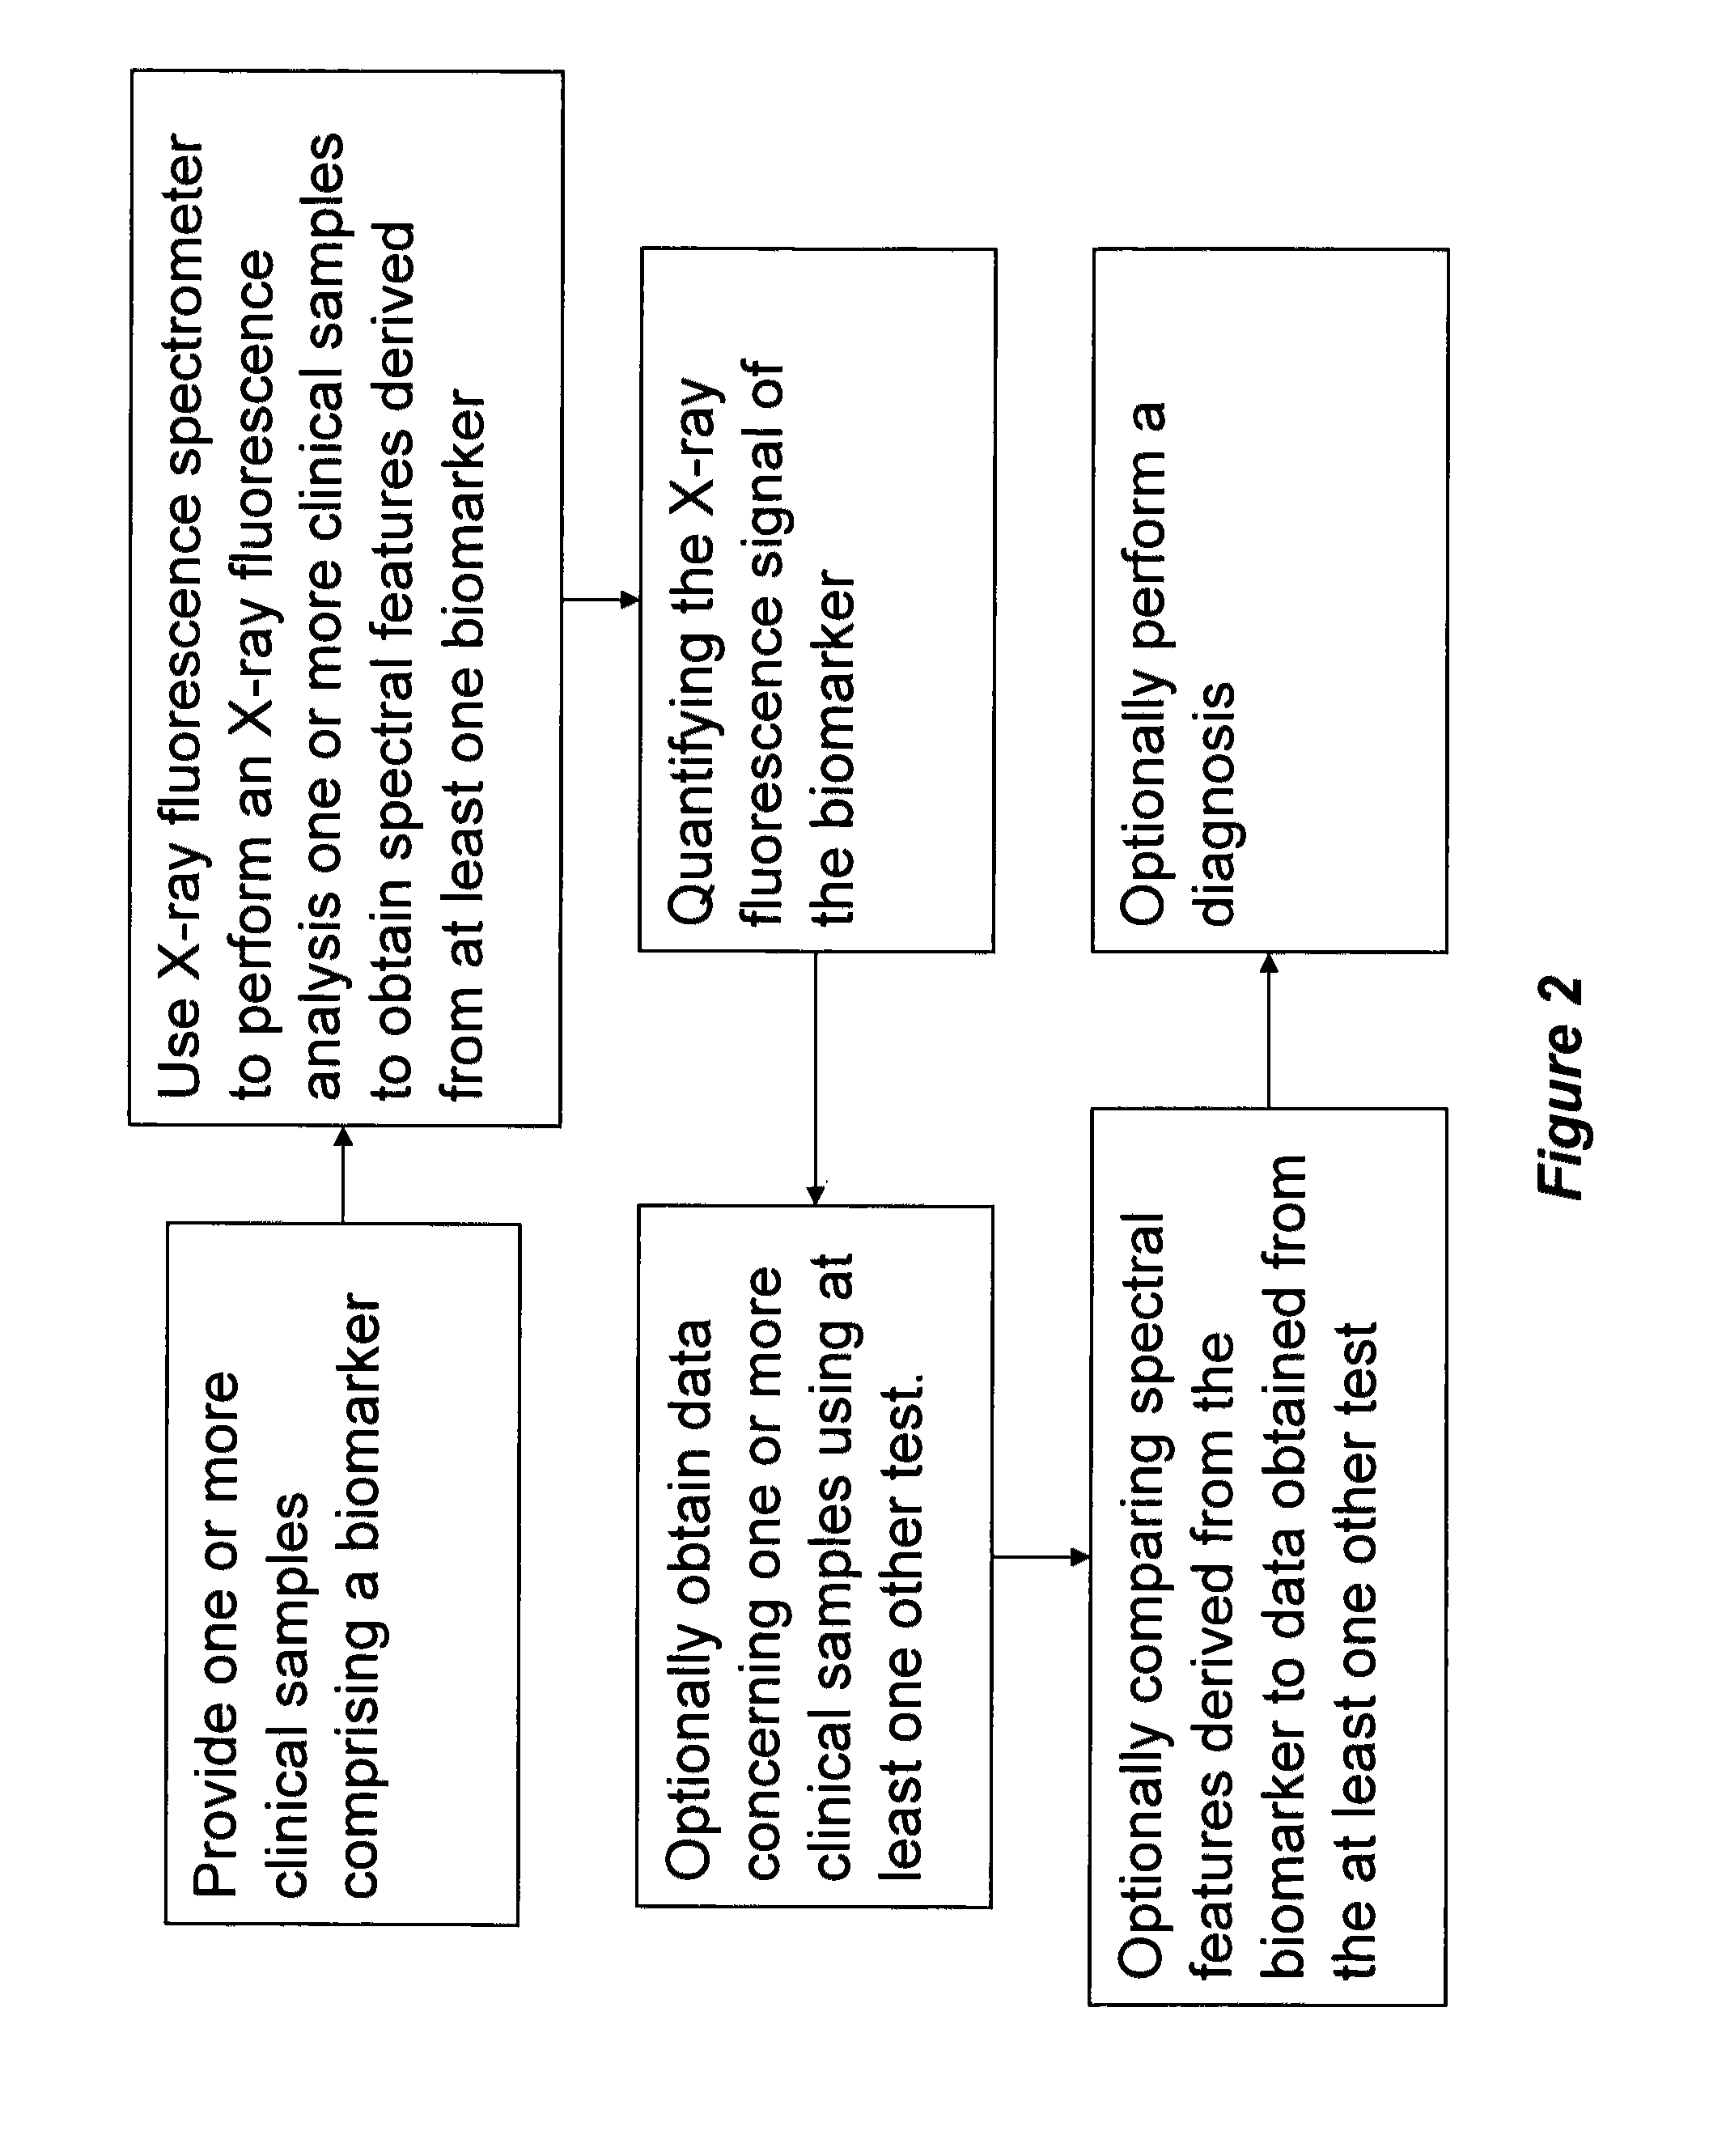
Method for analysis using x-ray fluorescence
a technology of x-ray fluorescence and specimens, applied in material analysis using wave/particle radiation, instruments, applications, etc., can solve the problems of increasing the risk of death from melanoma, the lowest overall survival rate of any skin cancer, and the poor prognosis of patients with metastases
- Summary
- Abstract
- Description
- Claims
- Application Information
AI Technical Summary
Benefits of technology
Problems solved by technology
Method used
Image

Examples
example 1
[0054]A solution of bovine serum albumin (150 nanomolar in pH 7.5 tris(hydroxymethl)amine-hydrochloric acid buffer) was exposed to thimerosal. FIG. 4 shows the X-ray fluorescence spectra of bovine serum albumin that was not exposed to thimerosal. FIG. 5 shows the X-ray fluorescence spectrum of bovine serum albumin that was exposed to 9 millimolar thimerosal. FIG. 6 shows an expanded the X-ray fluorescence spectra of bovine serum albumin that was not exposed to thimerosal (bottom spectrum) and the X-ray fluorescence spectrum of bovine serum albumin that was exposed to 9 millimolar thimerosal (top spectrum). As can be seen in FIGS. 4-6, the bovine mercury appears to displace a portion of the copper and zinc from the bovine serum albumin. The biomarkers for thimerosal exposure to bovine serum albumin are increased mercury X-ray fluorescence signals, and decreased copper and zinc X-ray fluorescence signals. As an example of x-ray fluorescence data, the following is a list of elements an...
example 2
[0055]A human tissue sample comprising melanoma and amelanomic regions was analyzed to determine element content using X-ray fluorescence. A 12 millimeter by 7.4 millimeter region was mapped with 0.1 millimeter spatial resolution using a 0.1 millimeter polycapillary X-ray focusing optic, a rhodium X-ray tube for polychromatic X-ray excitation, and silicon drift detector energy dispersive X-ray detector. Elements quantified include phosphorus, sulfur, chlorine, potassium, calcium, iodine, titanium, chromium, manganese, iron, nickel, copper, zinc, platinum, mercury, arsenic, lead, selenium, cadmium, and tin. Images were reconstructed as three dimensional plots which represent element concentration in both color and peak height. FIG. 7 shows an optical micrograph of the H&E stained sample. FIG. 8 shows images for the sulfur signal intensity. FIG. 9 shows images for the phosphorus signal intensity. FIG. 10 shows images for the elastic scatter of the rhodium L-line. Elastic Rh scatter co...
example 3
[0056]Primary white melanocytes were cultured in normal culture medium with and without chromium (VI) for one week. The cells were washed with isotonic ammonium acetate buffer. Cells were air dry and resuspended in 20 mM glycine pH 2.8. Cells were then concentrated on spin plate for 2 hours at 75 degrees Celsius. FIG. 11 shows elemental spectrum of control cells not exposed to chromium, and FIG. 12 shows spectrum of the cells exposed to Cr for one week.
PUM
 Abstract
Description
Claims
Application Information