Methods, systems and devices for detecting insects and other pests
- Summary
- Abstract
- Description
- Claims
- Application Information
AI Technical Summary
Benefits of technology
Problems solved by technology
Method used
Image
Examples
example 1
Evaluation of the Fluorescence Effect
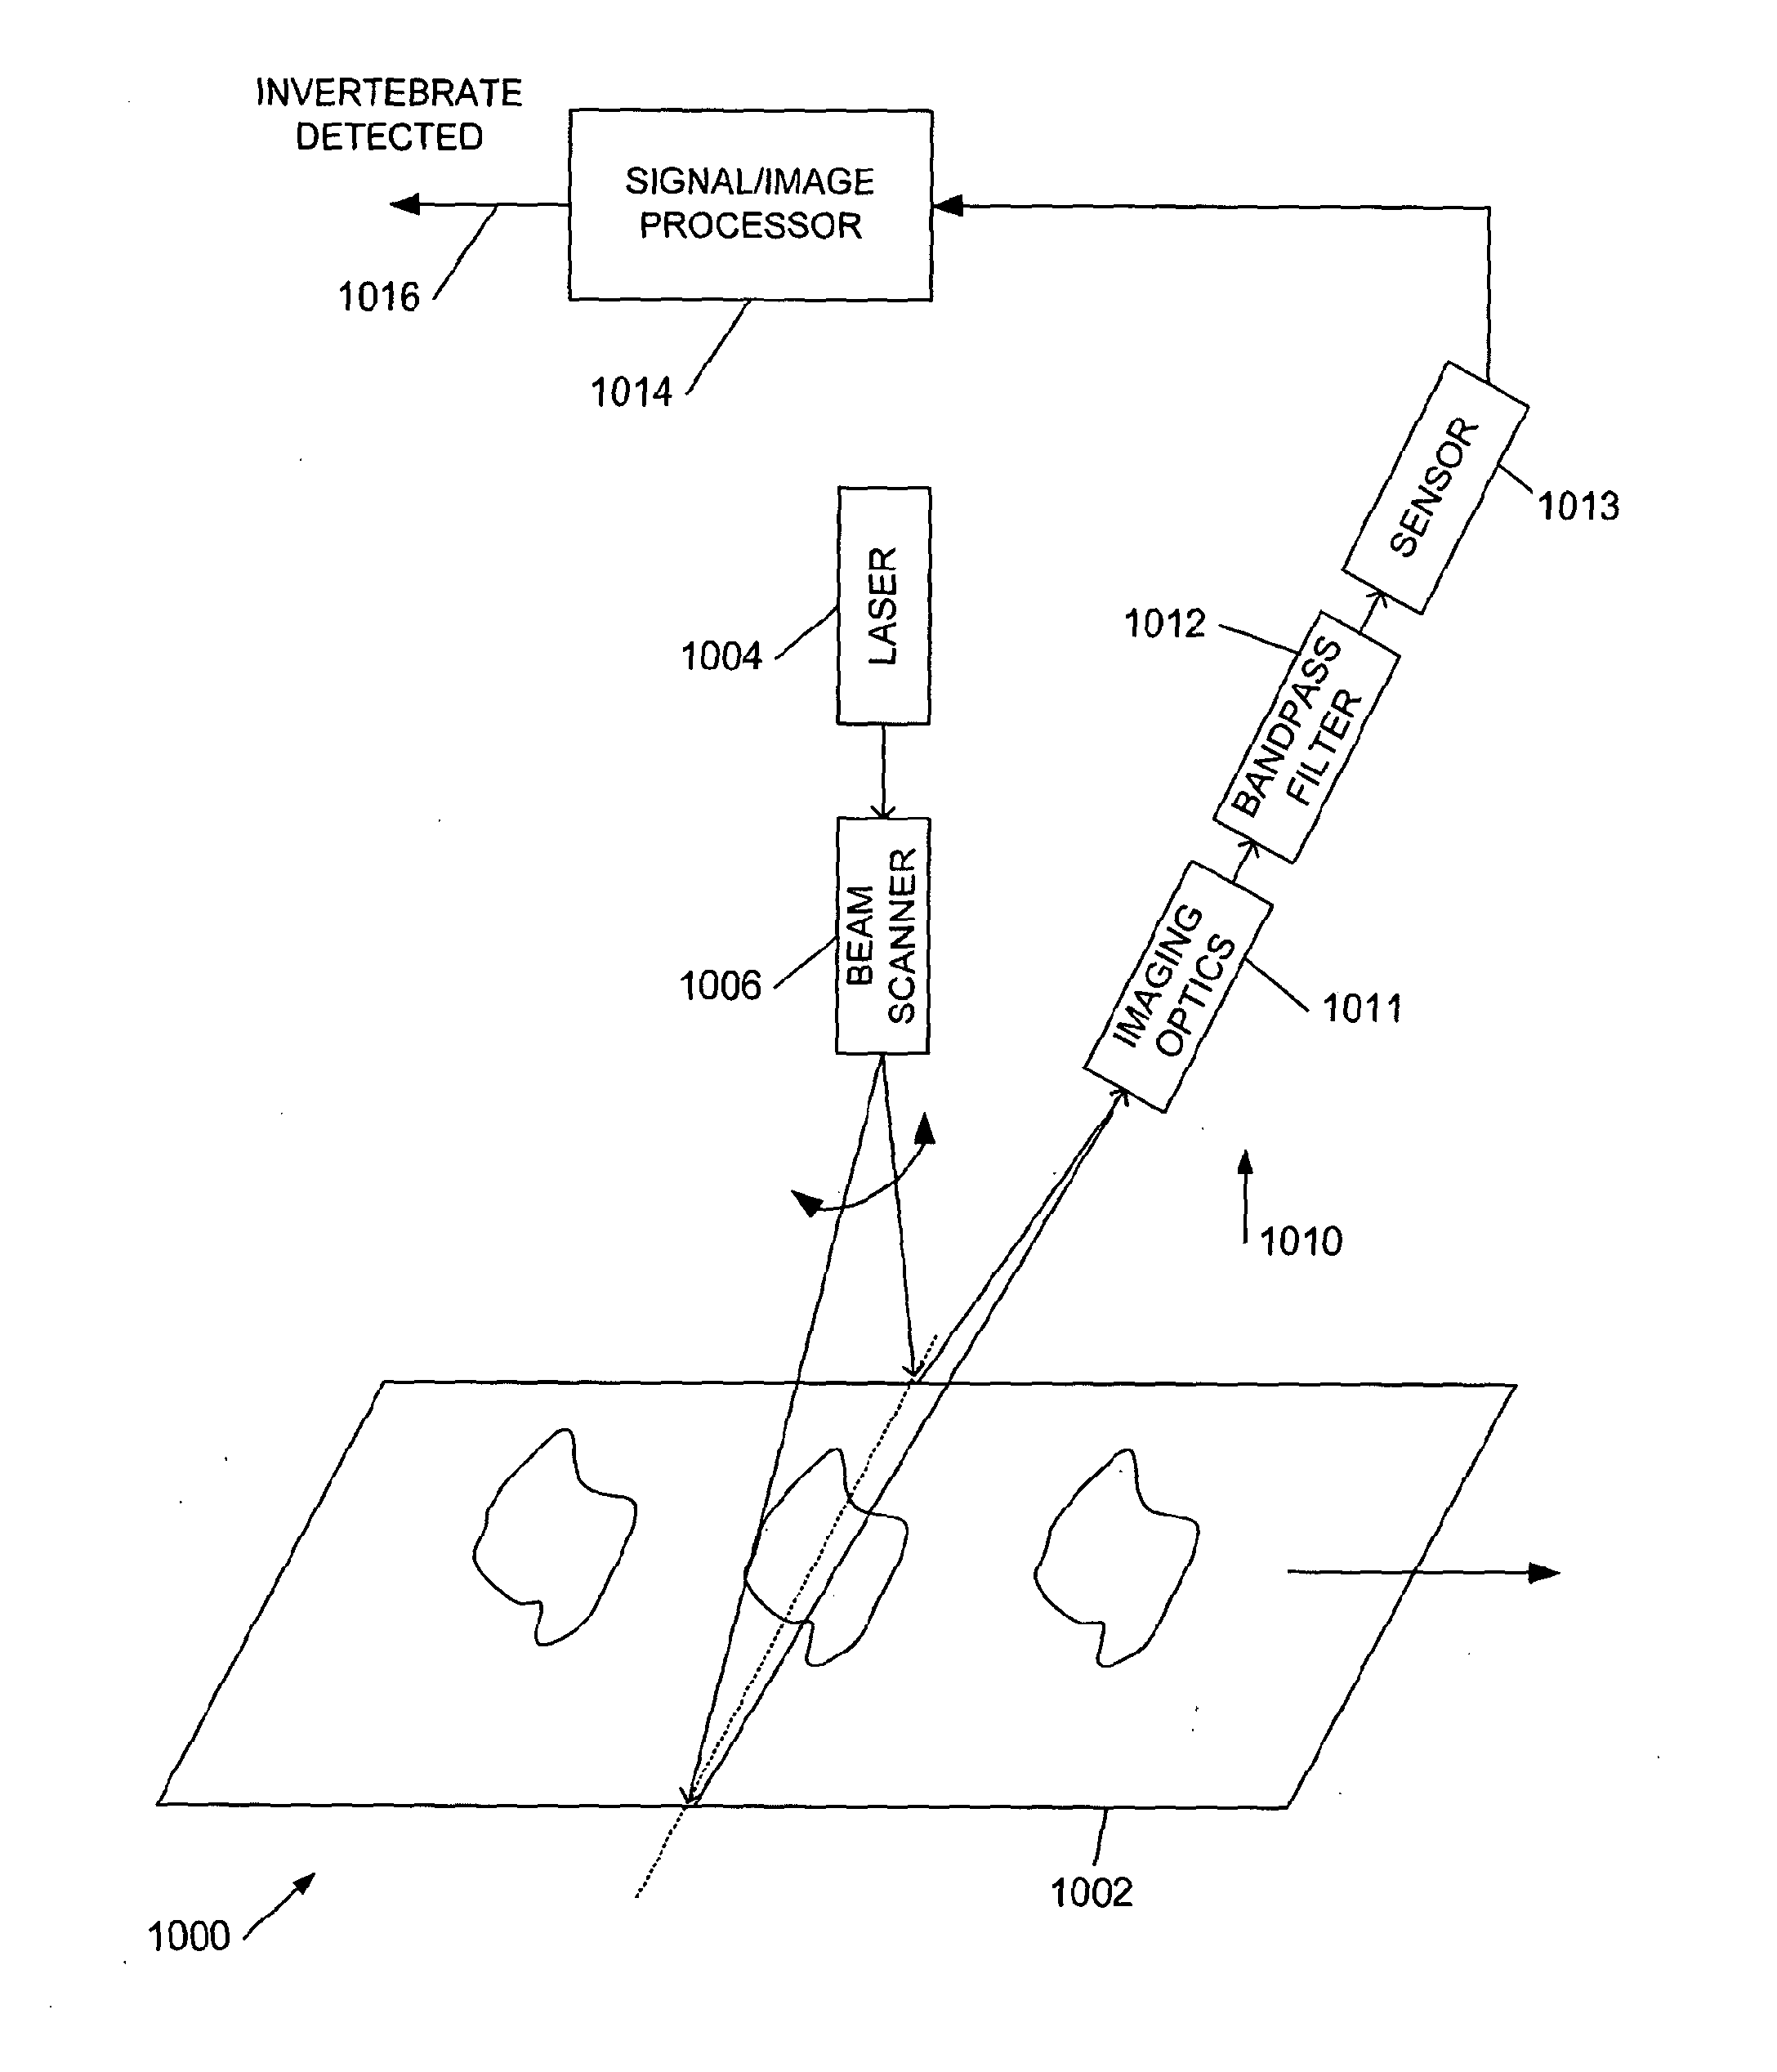
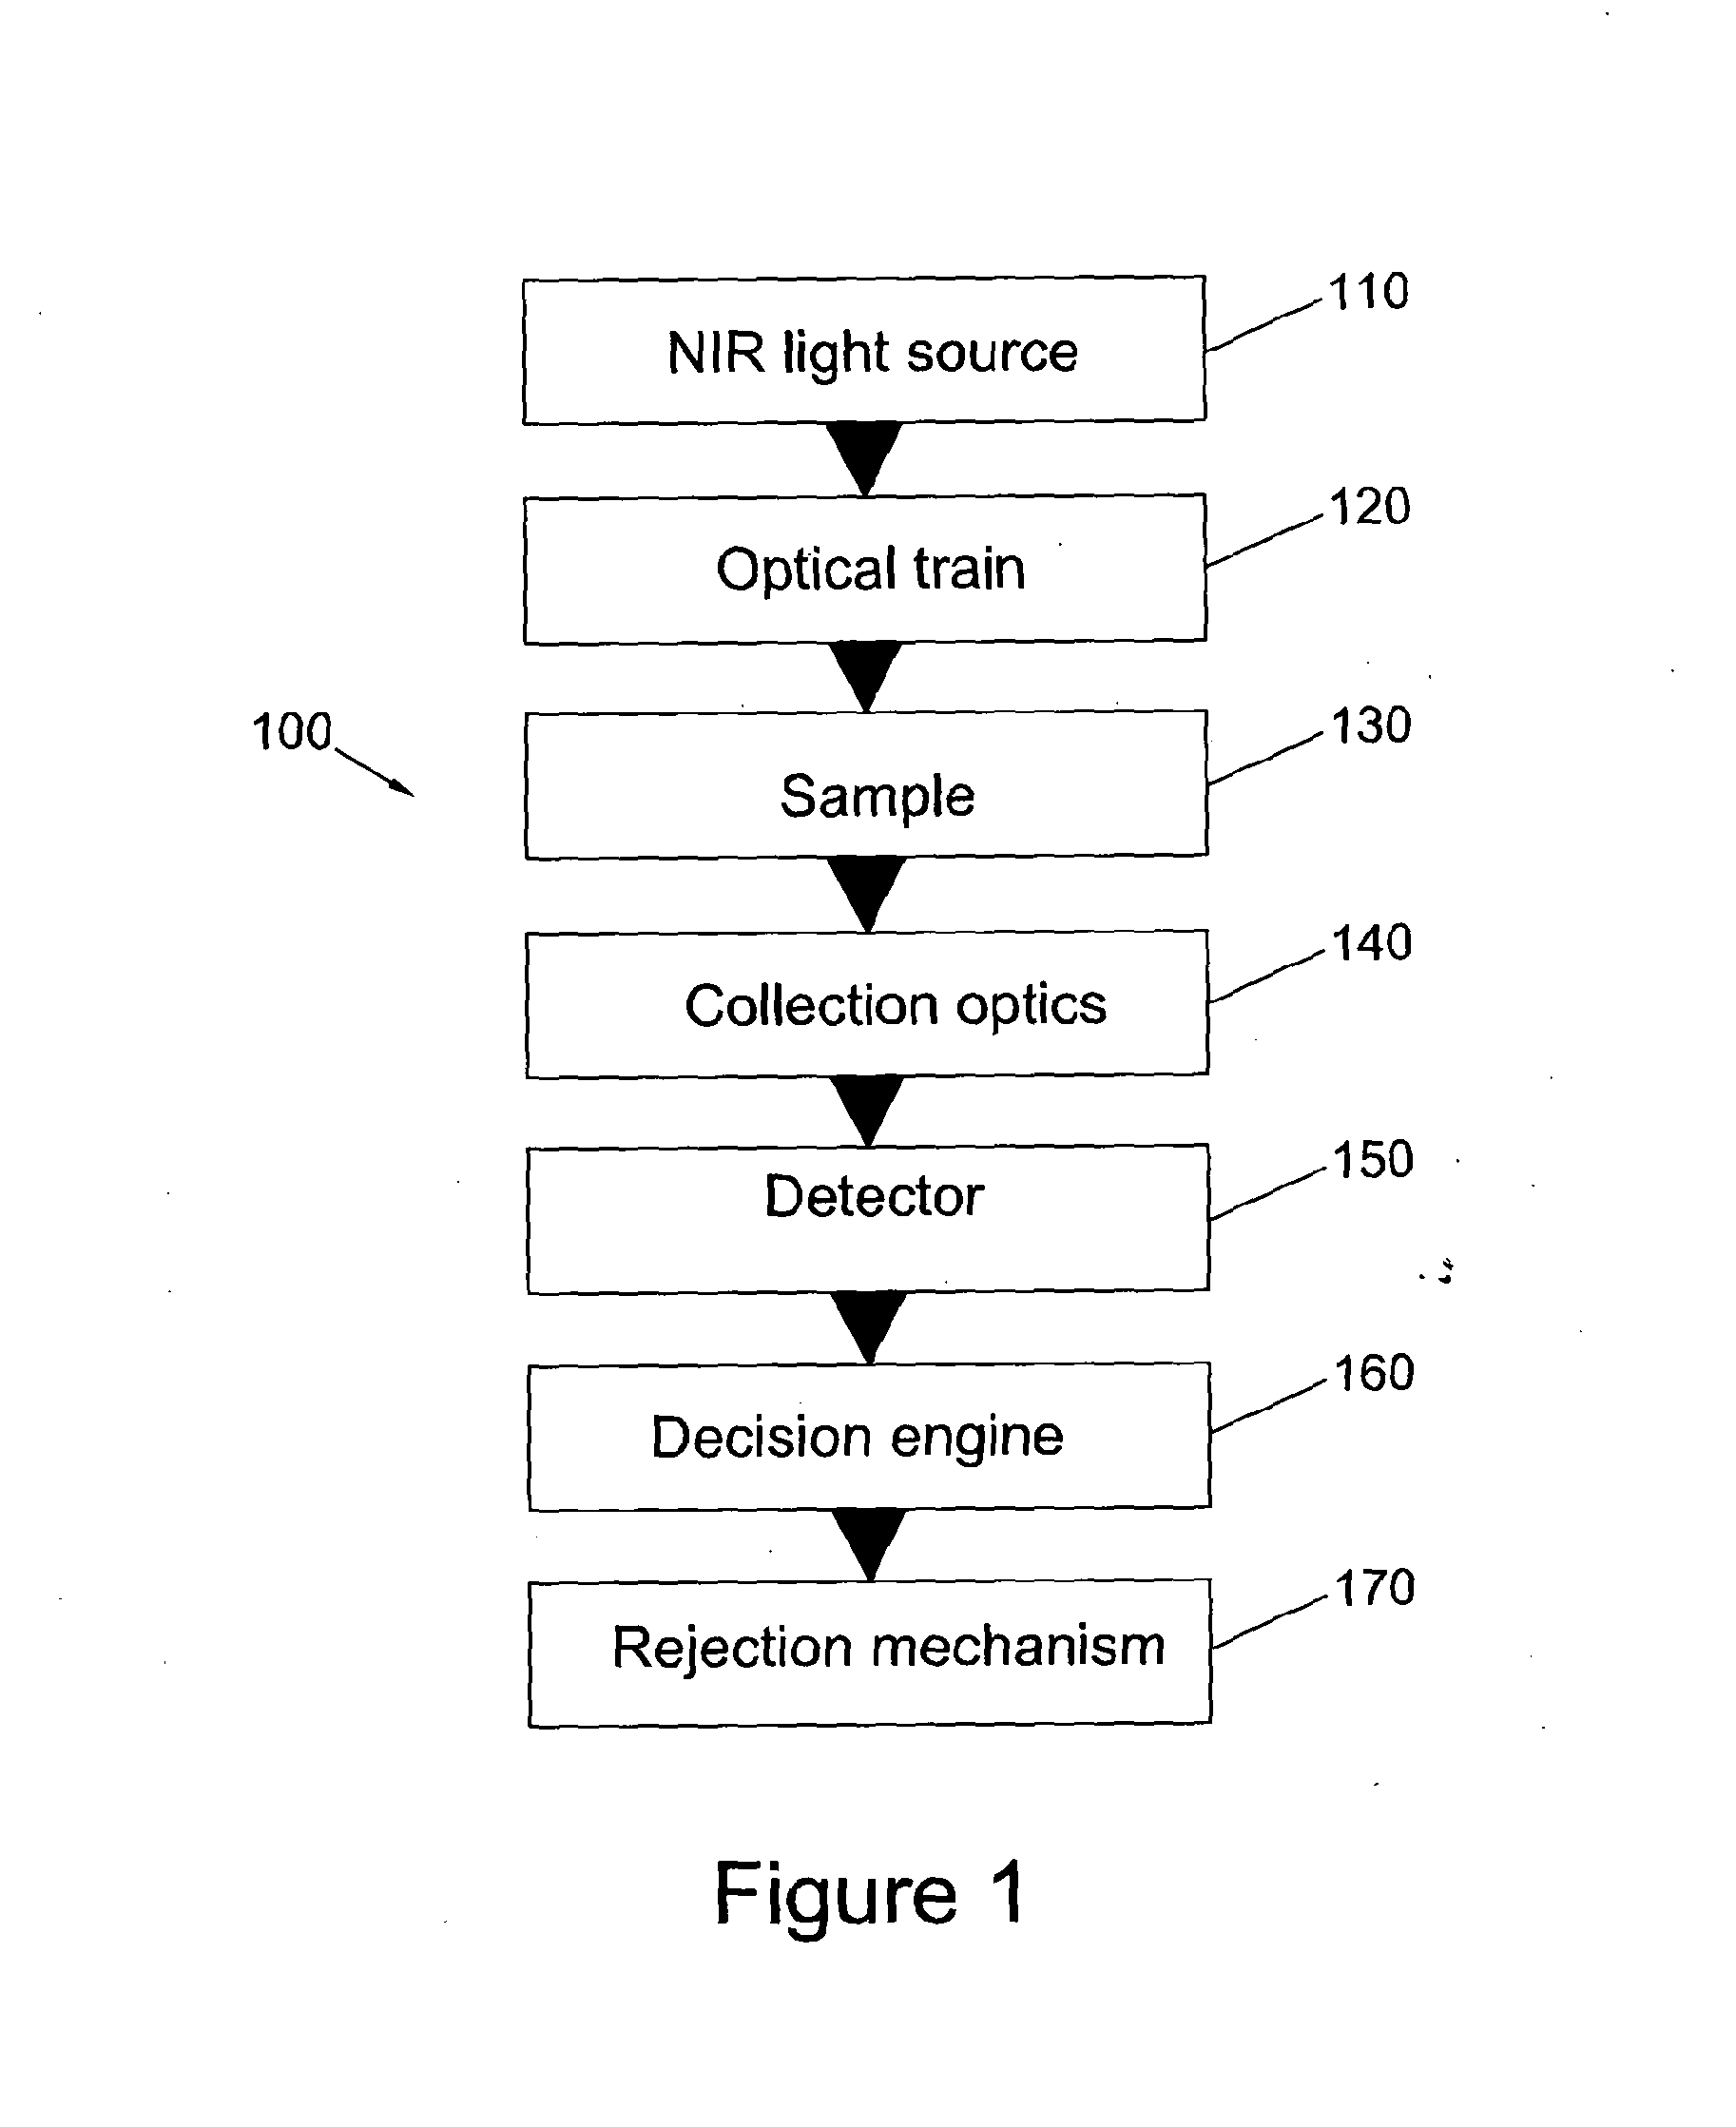
[0132]The LIDAR technique (read broadly, as mentioned above, as the LIDAR ranging component is not tested in the results presented herein, although LIDAR may be applied in select embodiments to position detect contaminants), was expected to give high sensitivity to the presence of insects, and by selection of an appropriate laser excitation line, the contamination would not be obscured by the sample or by the packaging. In order to confirm the viability of the technique without the need to build a potentially expensive prototype, a series of conventional Raman spectra were obtained as follows:
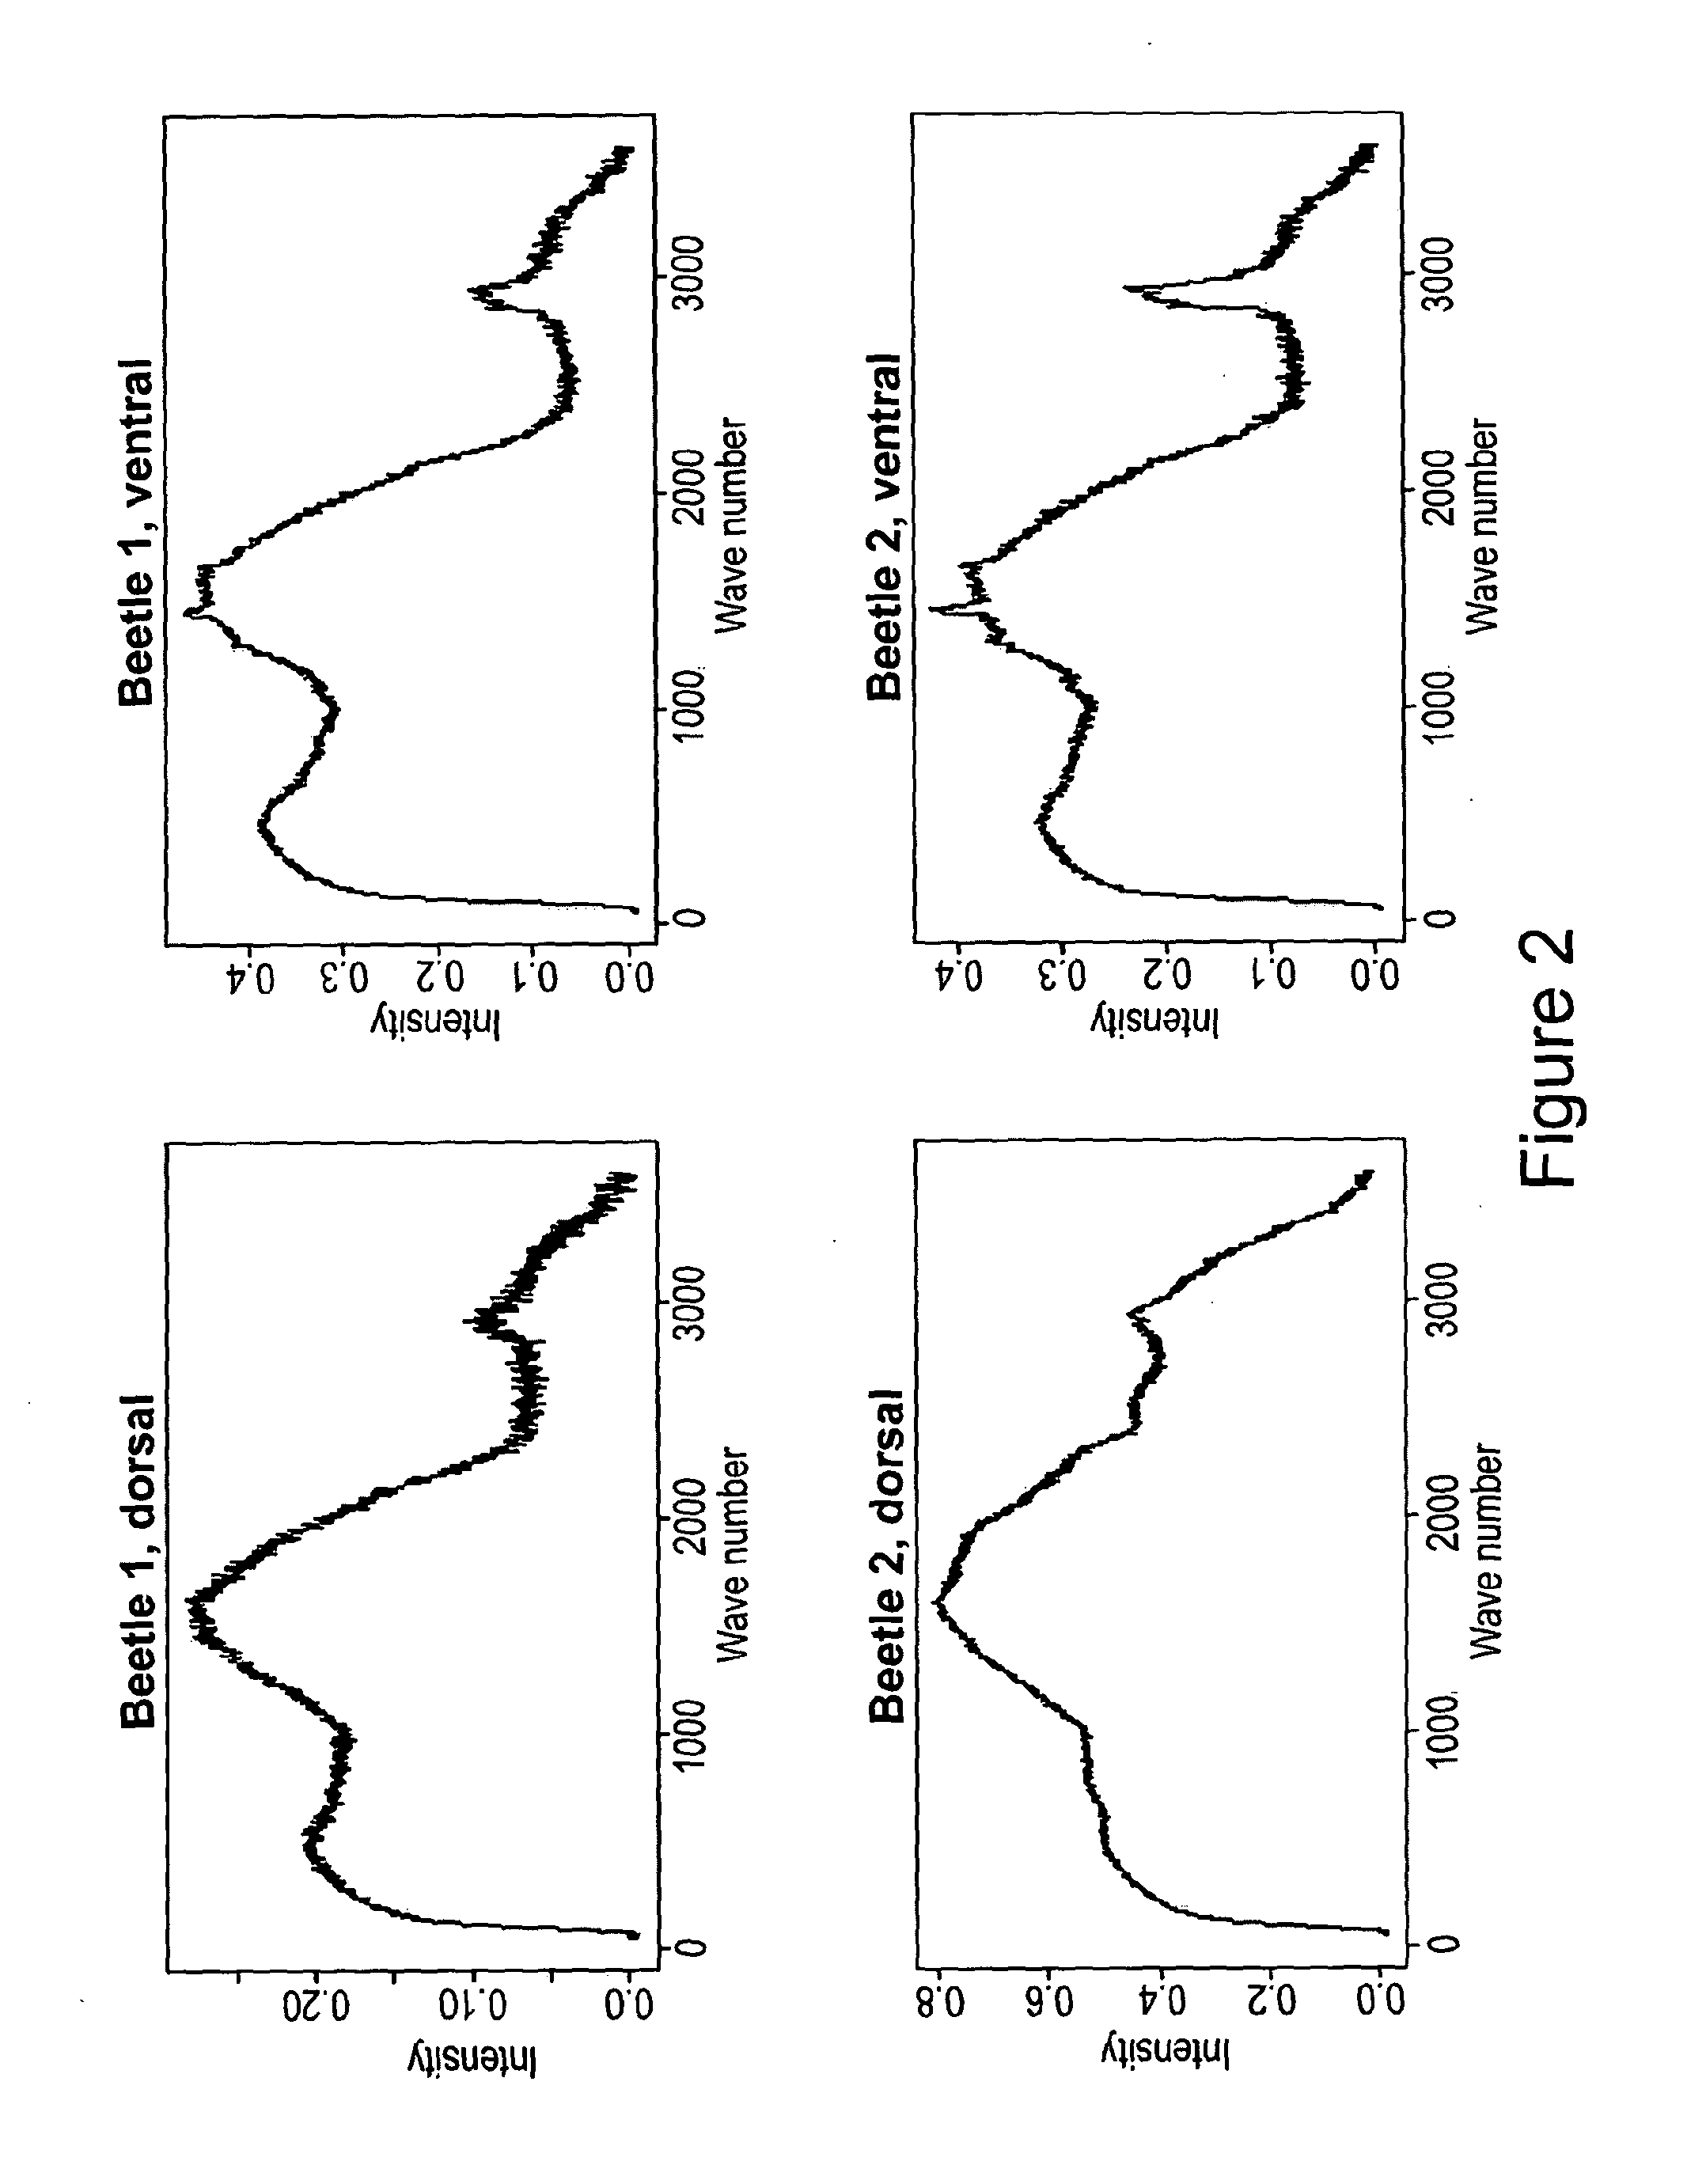
[0133]Spectra were measured of a selection of pest species identified as being of particular importance to the food industry: beetles, caterpillars, moths, slugs and spiders using two samples of each type of pest and two orientations. For example the wings of the moths were sampled as well as the body to gauge the degree to which spectral response varied sin...
example 2
Effectiveness when the Contaminant is Obscured
[0136]The biggest difference between the spectra of the leaf and the beetle is the very high intensity of scattering right across the spectrum by the latter. This is valid for both sides of the beetle. This scattering is significant even when the beetle is hidden behind a leaf. Therefore instead of choosing a particular wavenumber for monitoring, integrated intensity across a broad wavenumber region should be the most sensitive discriminator.
[0137]Further, such strong scattering means a substantial reduction in light that is being transmitted. Therefore a combination of detection of both scattered and transmitted signals provides complementary information that would significantly improve the discrimination. Here it will be best to use a near IR laser frequency just outside the water overtone bands.
[0138]FIG. 4 shows FT-Raman spectra run with the 1064 nm excitation from a diode laser, showing the spectrum of a salad leaf; the spectrum of ...
example 3
Source of the Fluorescence Effect
[0140]We have studied Slugs and Caterpillars in more detail and a brief summary of the results are given in FIGS. 5 and 6. We disclose fluorescence signals observed in the original spectra. However, the colourless body fluids from slugs do not show the fluorescence. Caterpillar hemolymph shows the strongest signals (see FIG. 6), while there are very slight differences in spectra between dead and live animals. These measurements are made with a laser beam focused to less than 0.5 mm diameter, so that there will be variations in the signal intensity due to sample presentation. This is the design of the FT-Raman spectrometer, which is designed to maximize the light throughput to the detector for maximum signal.
[0141]1064 nm excited FT-Raman spectra of anthraquinone, betacarotine, chitin and melanin are shown in FIG. 9. Of these, melanin is the only compound that shows broad fluorescence, while all the other pigments show sharp featured Raman spectra.
[01...
PUM
 Abstract
Description
Claims
Application Information
 - R&D
- Intellectual Property
- Life Sciences
- Materials
- Tech Scout
- Unparalleled Data Quality
- Higher Quality Content
- 60% Fewer Hallucinations
Browse by: Latest US Patents, China's latest patents, Technical Efficacy Thesaurus, Application Domain, Technology Topic, Popular Technical Reports.
© 2025 PatSnap. All rights reserved.Legal|Privacy policy|Modern Slavery Act Transparency Statement|Sitemap|About US| Contact US: help@patsnap.com


