

Method and apparatus for detecting enzymatic activity using molecules that change electrophoretic mobility
- Summary
- Abstract
- Description
- Claims
- Application Information
AI Technical Summary
Benefits of technology
Problems solved by technology
Method used
Image

Examples
first embodiment
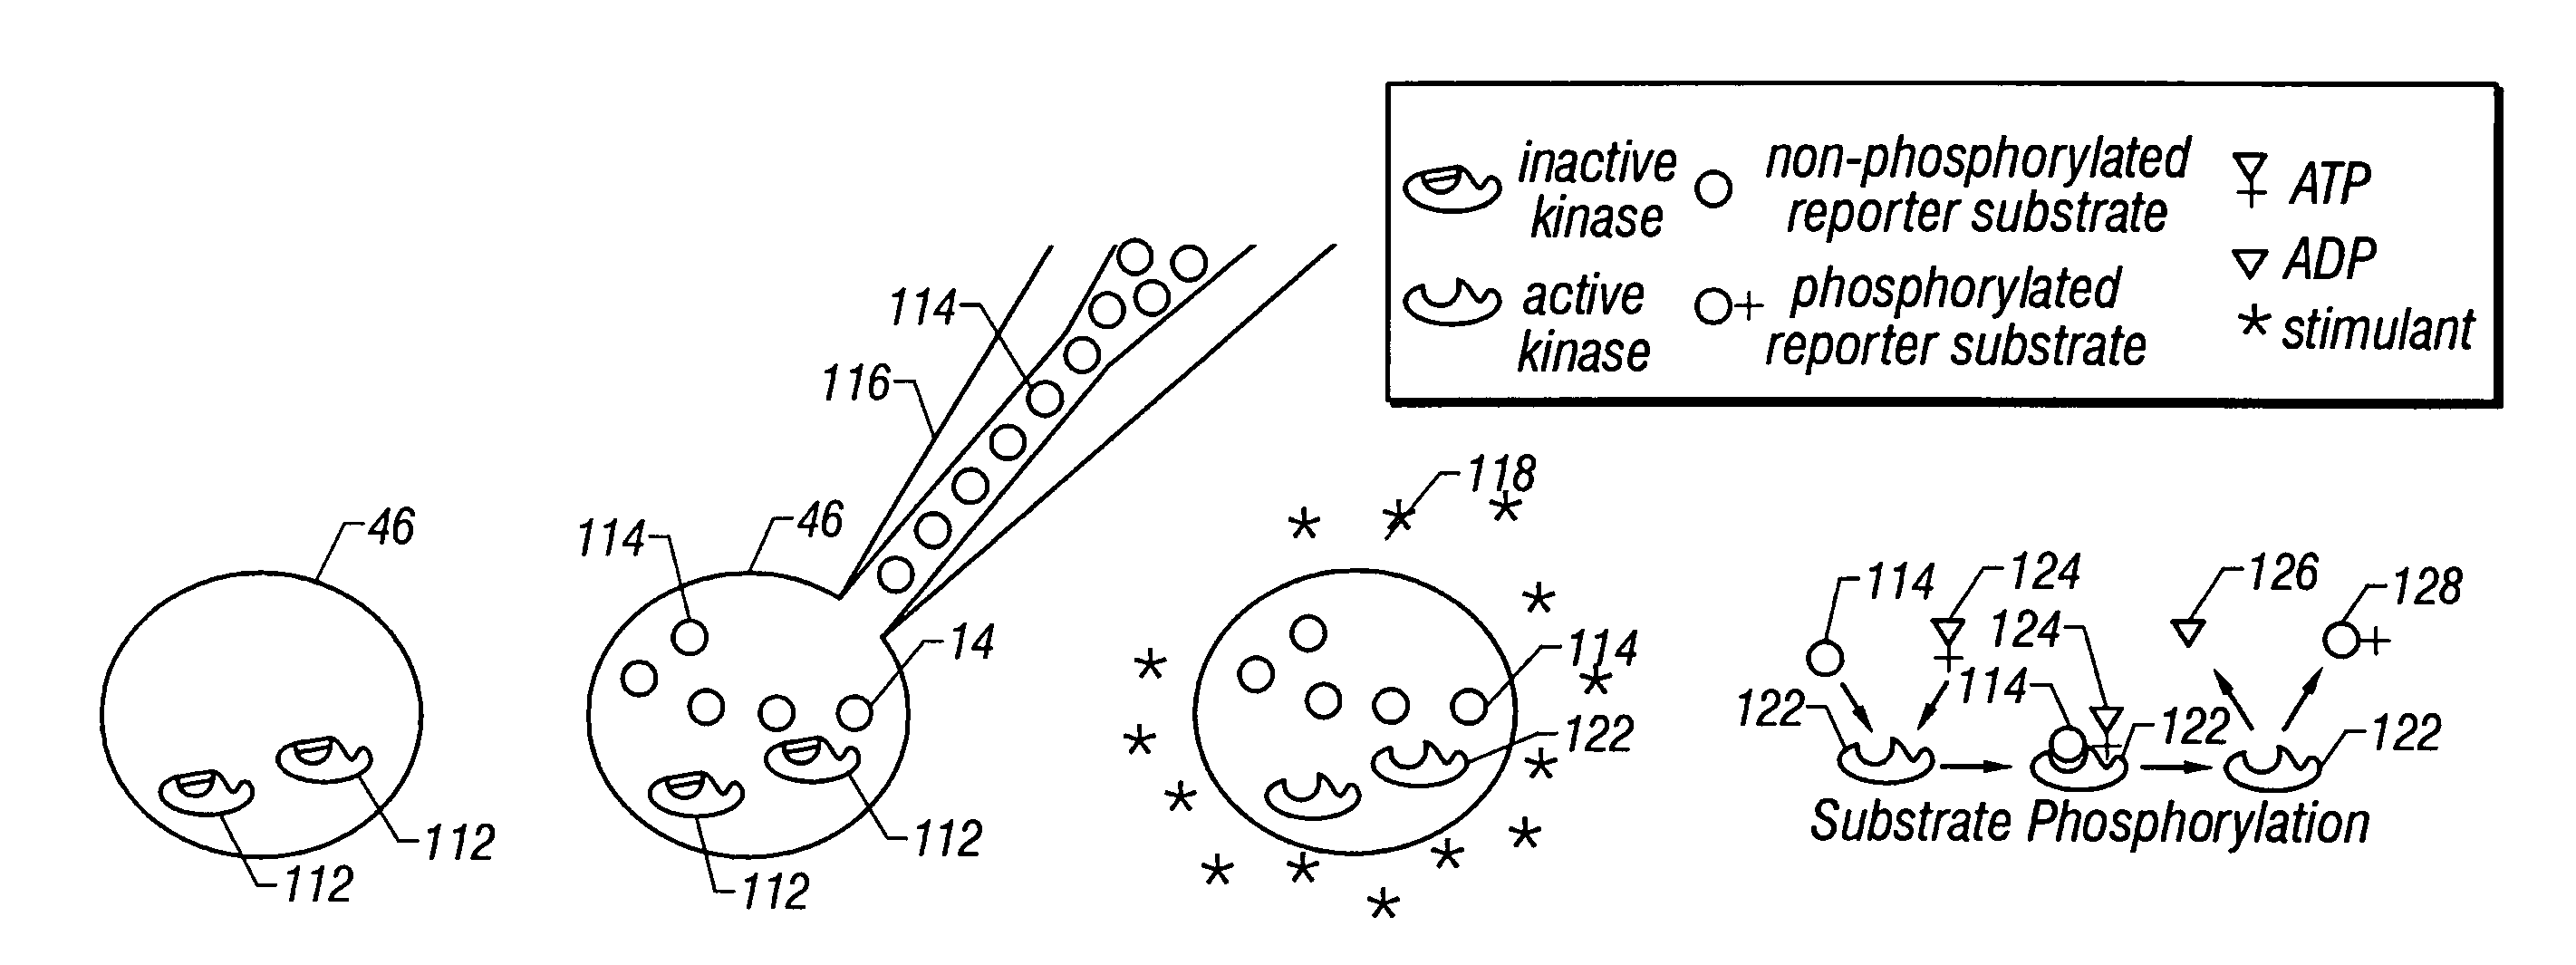
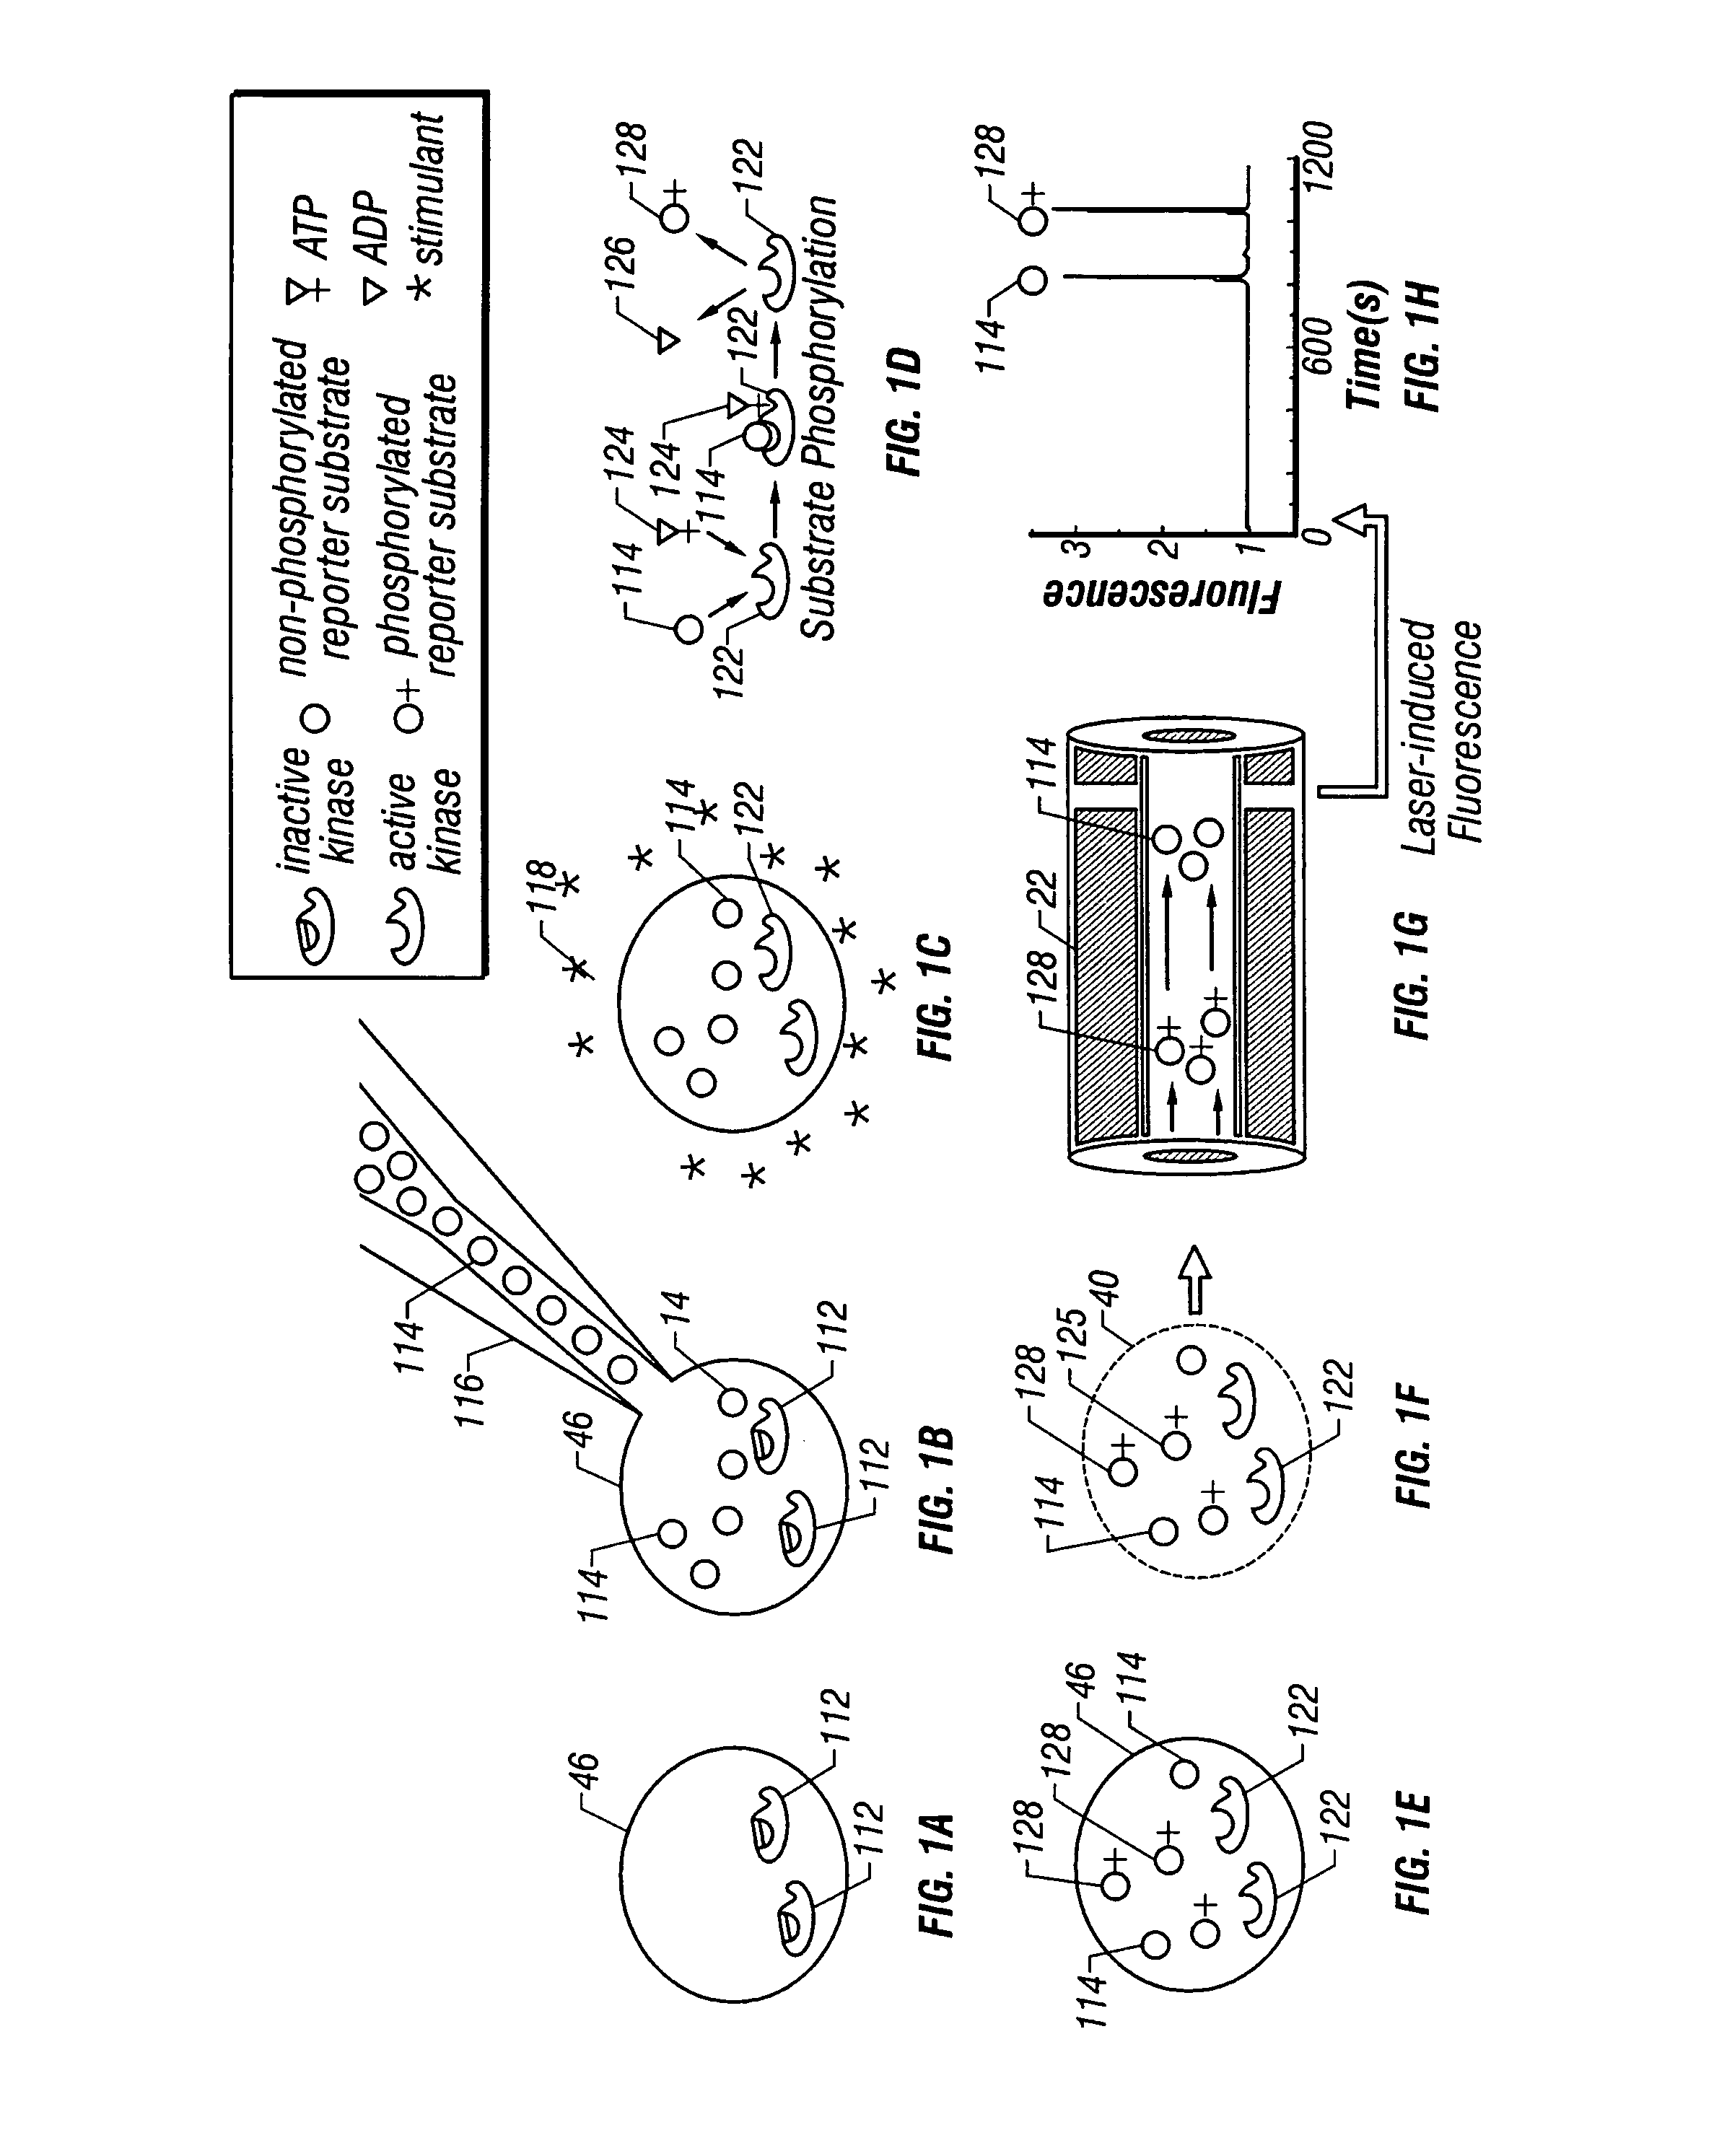
[0079]In another embodiment, the net activity of PKC within a single frog (Xenopus) oocyte 46′, an approximately 1 mm in diameter, 1 μl in volume, nonmammalian cell, is measured. In this case, the same synthetic fluorescent peptide substrate is introduced by injection into the cell. Subsequently, a portion of the contents of the cell are removed with a sharpened capillary tip that is guided by a piezoelectric motor. In this case, the contents of the oocyte 46′ need not be harvested by laser lysis because the oocyte 46′ is large enough to be mechanically sampled. Once a portion of the contents are in the capillary 22, they are separated under electrophoretic conditions that have been empirically optimized for the separation of oocyte cytosolic components. Although differing cells and electrophoretic conditions are used as compared to the first embodiment, identifiable and quantifiable populations of phosphorylated and nonphosphorylated PKC substrate molecules are still obtained. Addi...
second embodiment
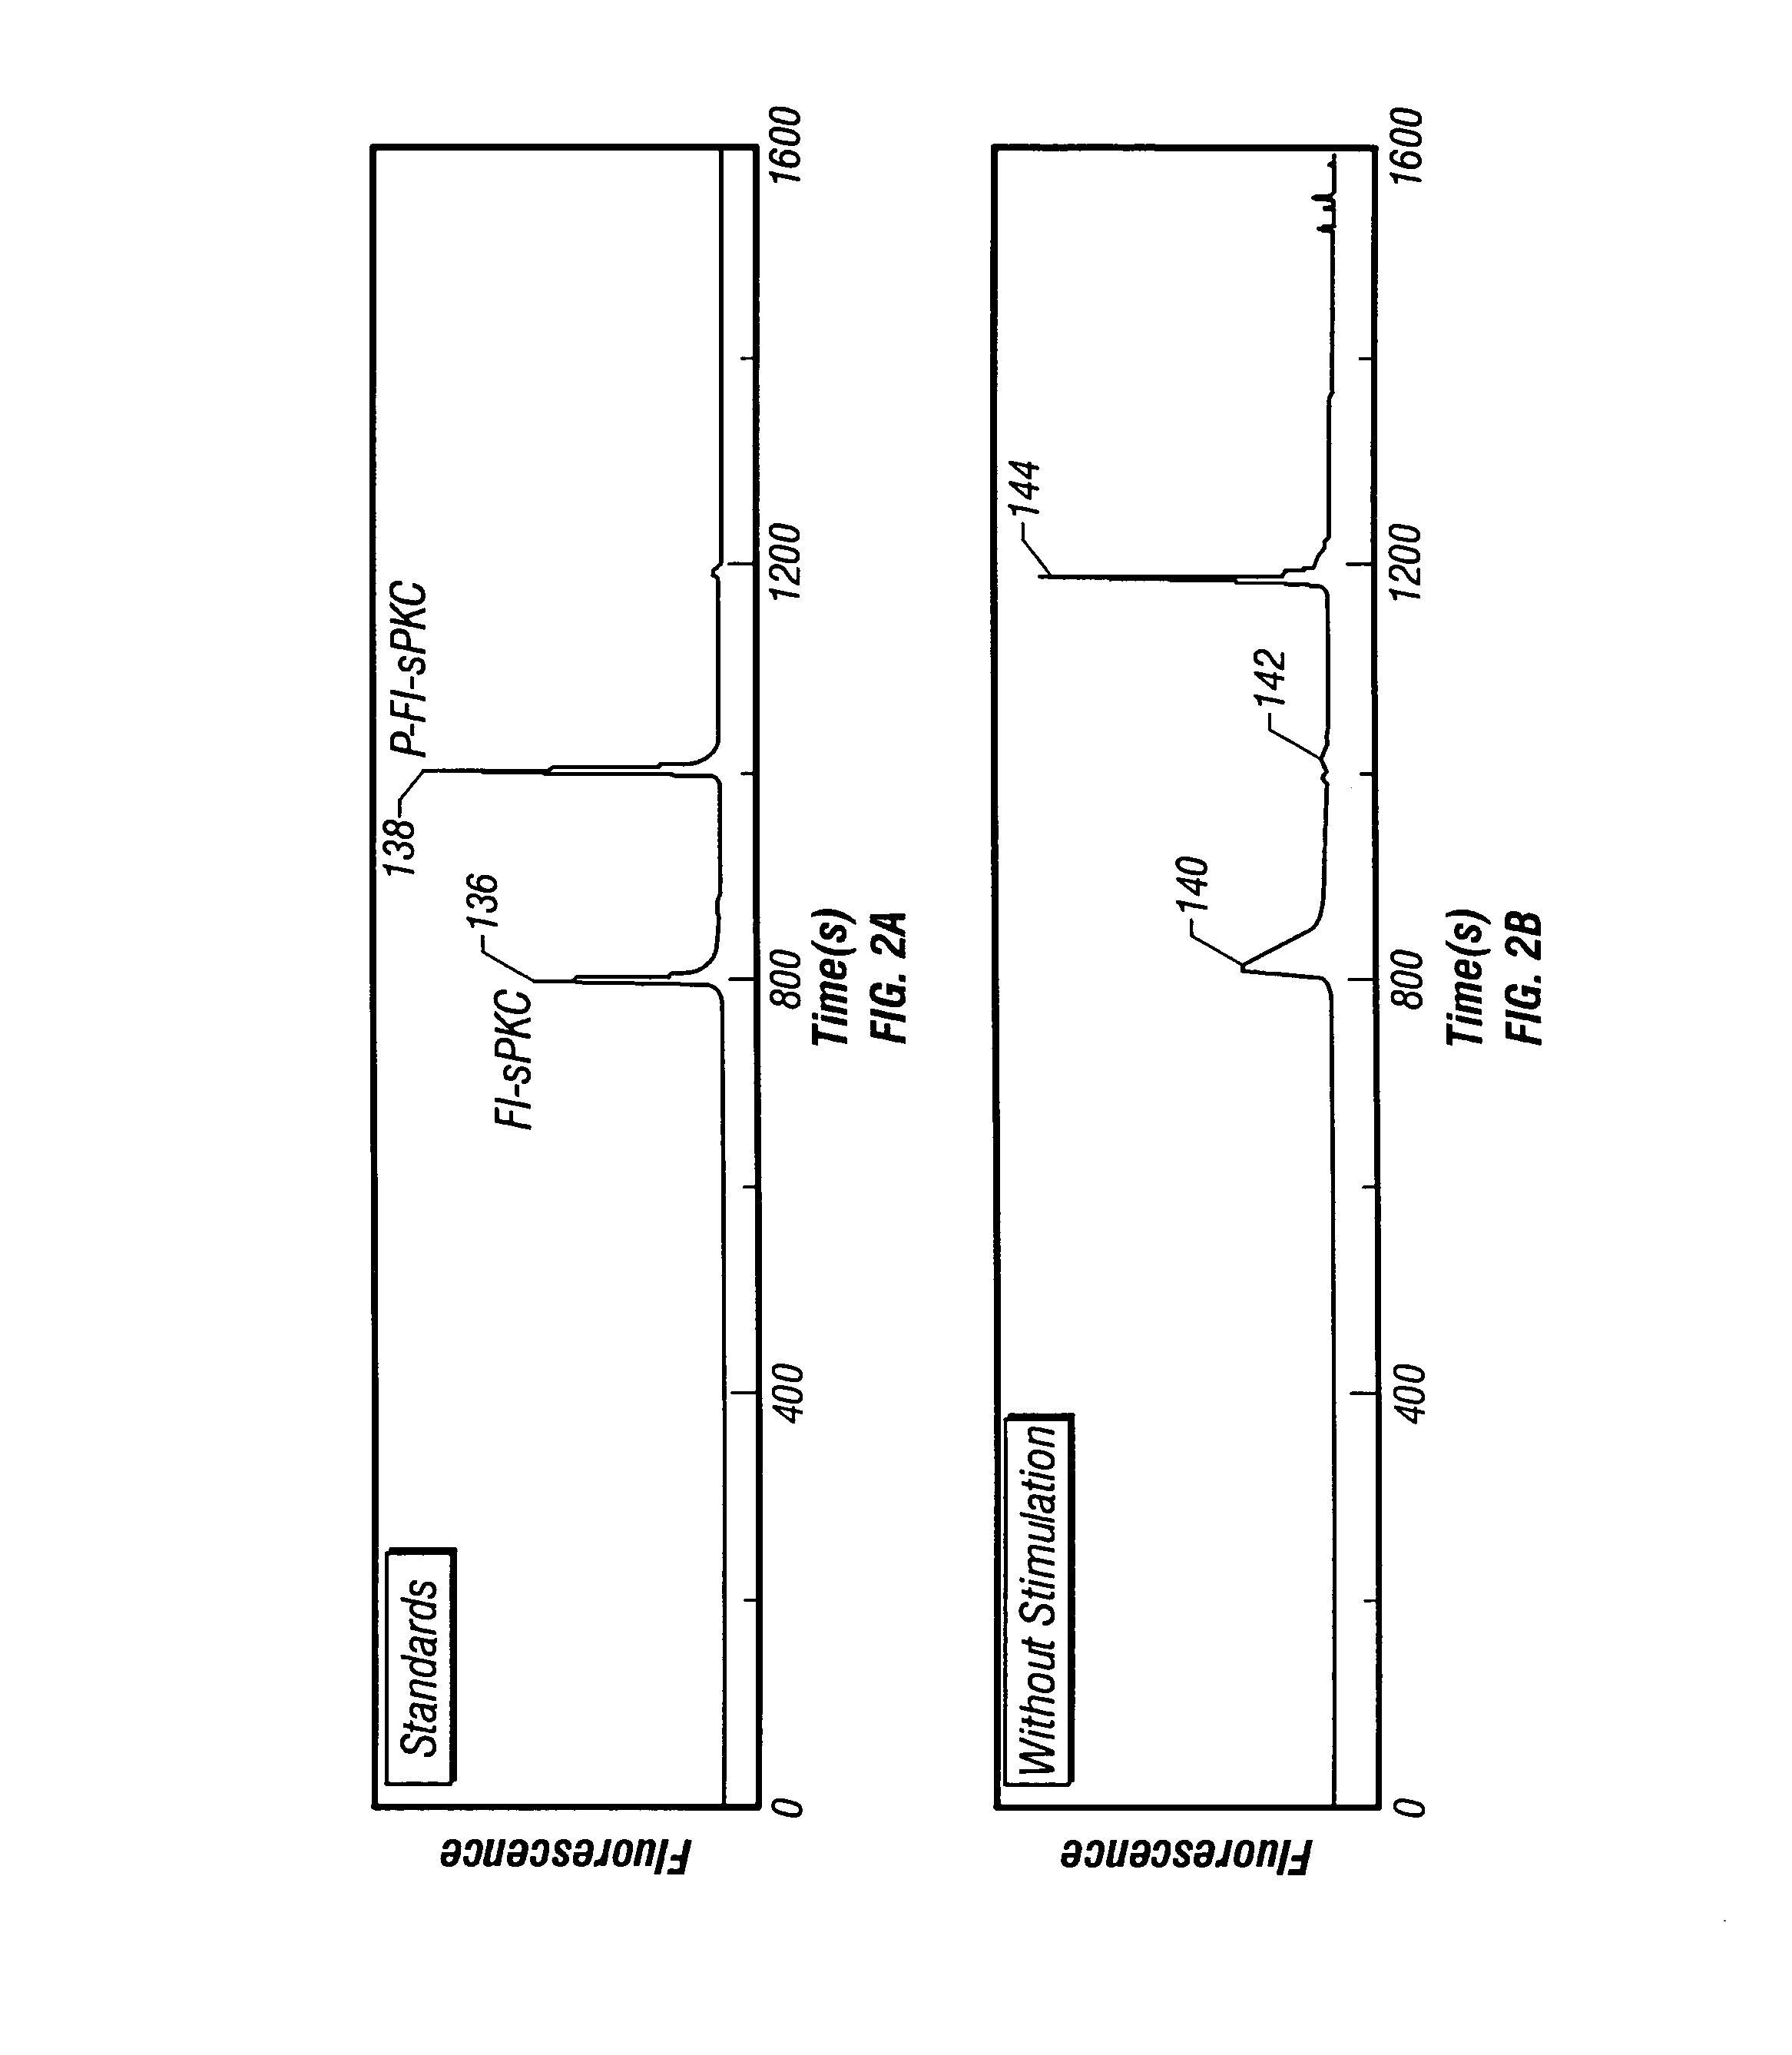
[0081]Two preferred embodiments are presented. The first pertains to the measurement of intracellular chemical activity in single small mammalian cells that are typically 5–10 μm in diameter and about 1 pl in volume. This is illustrated by measurements made from individual rat basophilic leukemia (RBL) cells of the cell line RBL-2H3 and from individual murine NIH / 3T3 cells. The second pertains to the measurement of intracellular chemical activity in relatively large single cells. In this second embodiment, measurements are made from individual Xenopus laevis frog oocytes 46′ that are about 1 mm in diameter and about 1 μl in volume. In both illustrated embodiments, measurements of the activity of intracellular protein kinase C (PKC) are made from individual cells. In both embodiments, the same reporter substrate molecule is used, termed Fl-sPKC for “fluorescent substrate of PKC”. Upon phosphorylation by PKC, the net charge of the Fl-sPKC is altered from +5 to +3. More significantly, ...
PUM
| Property | Measurement | Unit |
|---|---|---|
| Time | aaaaa | aaaaa |
| Time | aaaaa | aaaaa |
| Time | aaaaa | aaaaa |
Abstract
Description
Claims
Application Information