Enhanced fluorescent probe for detection CN-(Cyanogen), preparation method and biological application thereof
A fluorescent probe and enhanced technology, applied in the direction of fluorescence/phosphorescence, chemical instruments and methods, luminescent materials, etc., can solve the problems of poor photostability and high detection limit of fluorescent probes, and achieve low detection limit and high sensitivity , good selective effect
- Summary
- Abstract
- Description
- Claims
- Application Information
AI Technical Summary
Problems solved by technology
Method used
Image
Examples
Embodiment 1
[0021] Example 1: A method for detecting CN - The fluorescent probe is 1-(pyrene-1-yl)-3-(N-ethylcarbazol-3-yl)propenone, and its chemical structure is as follows: .
[0022] Prepare the detection CN - The method for enhancing the fluorescent probe, using 1-acetylpyrene as a starting material, and N-ethylcarbazole-3-formaldehyde according to the ratio of 1:1 in molar ratio, then adding an appropriate amount of NaOH, stirring the reaction at room temperature, 1-(Pyren-1-yl)-3-(N-ethylcarbazol-3-yl)propenone is obtained.
[0023] Specific steps are as follows:
[0024] Add 0.2461g (1mmol) 1-acetylpyrene and 0.2231g (1mmol) N-ethylcarbazole-3-carbaldehyde into a dry 50mL single-necked flask, stir with 15mL absolute ethanol until completely dissolved into a light yellow solution , add 0.75g NaOH, stir reaction at room temperature about 4h (separation out a large amount of yellow precipitates), TLC tracking (V 乙酸乙酯 :V 石油醚 =1:3), suction filtered after the reaction, washed t...
Embodiment 2
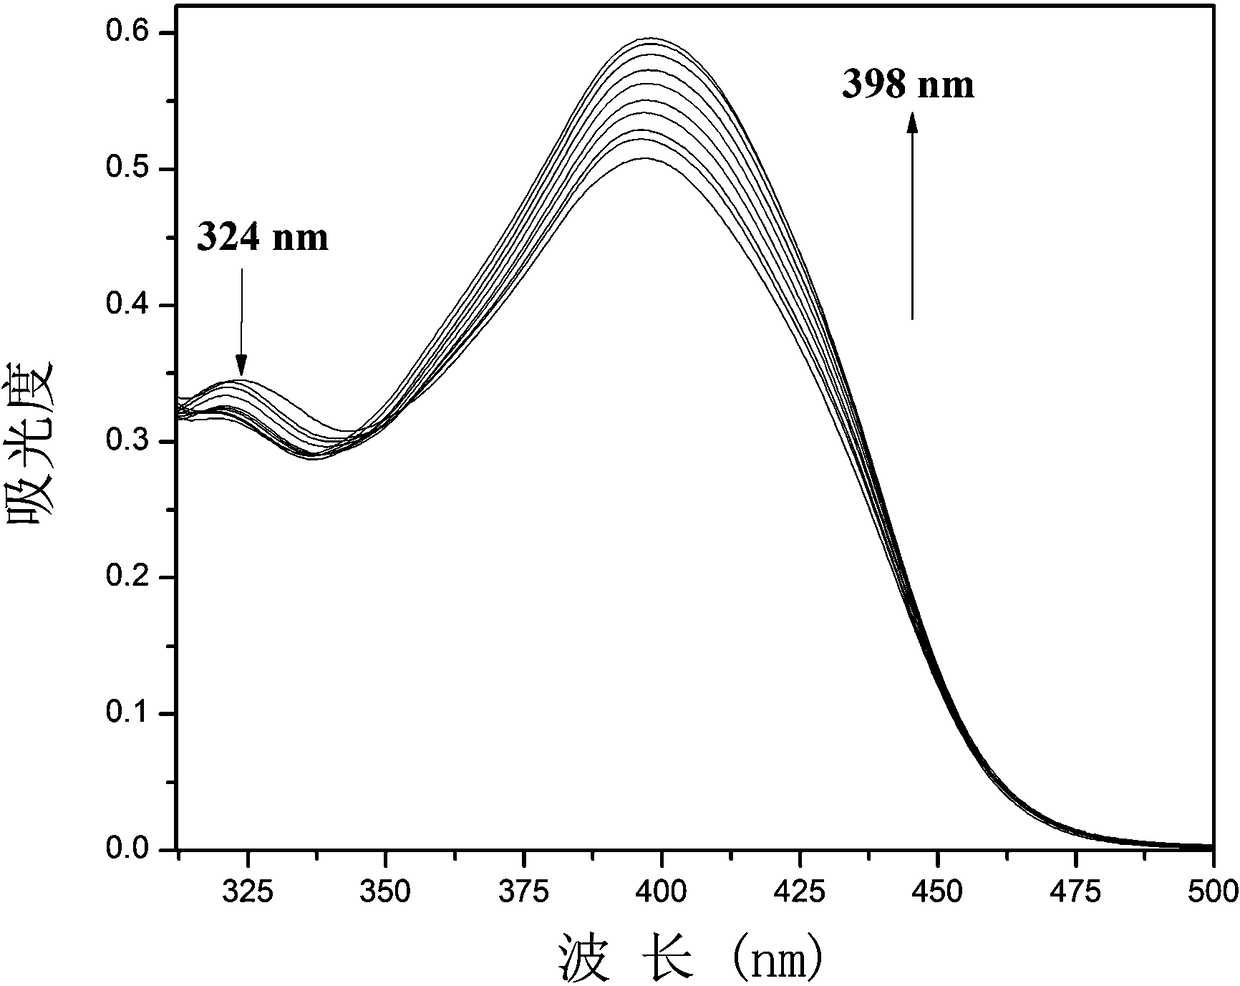
[0028] Example 2: The fluorescent probe was prepared with 1 mM fluorescent probe stock solution in DMSO; 2.0 mL of DMSO system and 20.0 µL of fluorescent probe stock solution were added to a fluorescent cuvette, and CN was performed on a fluorescence spectrophotometer. - UV titration experiment, and record its UV absorption spectrum, the UV absorption spectrum diagram is shown in figure 1 . Depend on figure 1 It can be seen that with CN - As the amount increases, the absorption peak at 324nm decreases, while the ultraviolet absorption at 398nm increases, and the fluorescence intensity at 488nm increases.
Embodiment 3
[0029] Example 3: Fluorescent probes with CN - Fluorescence titration plot of change
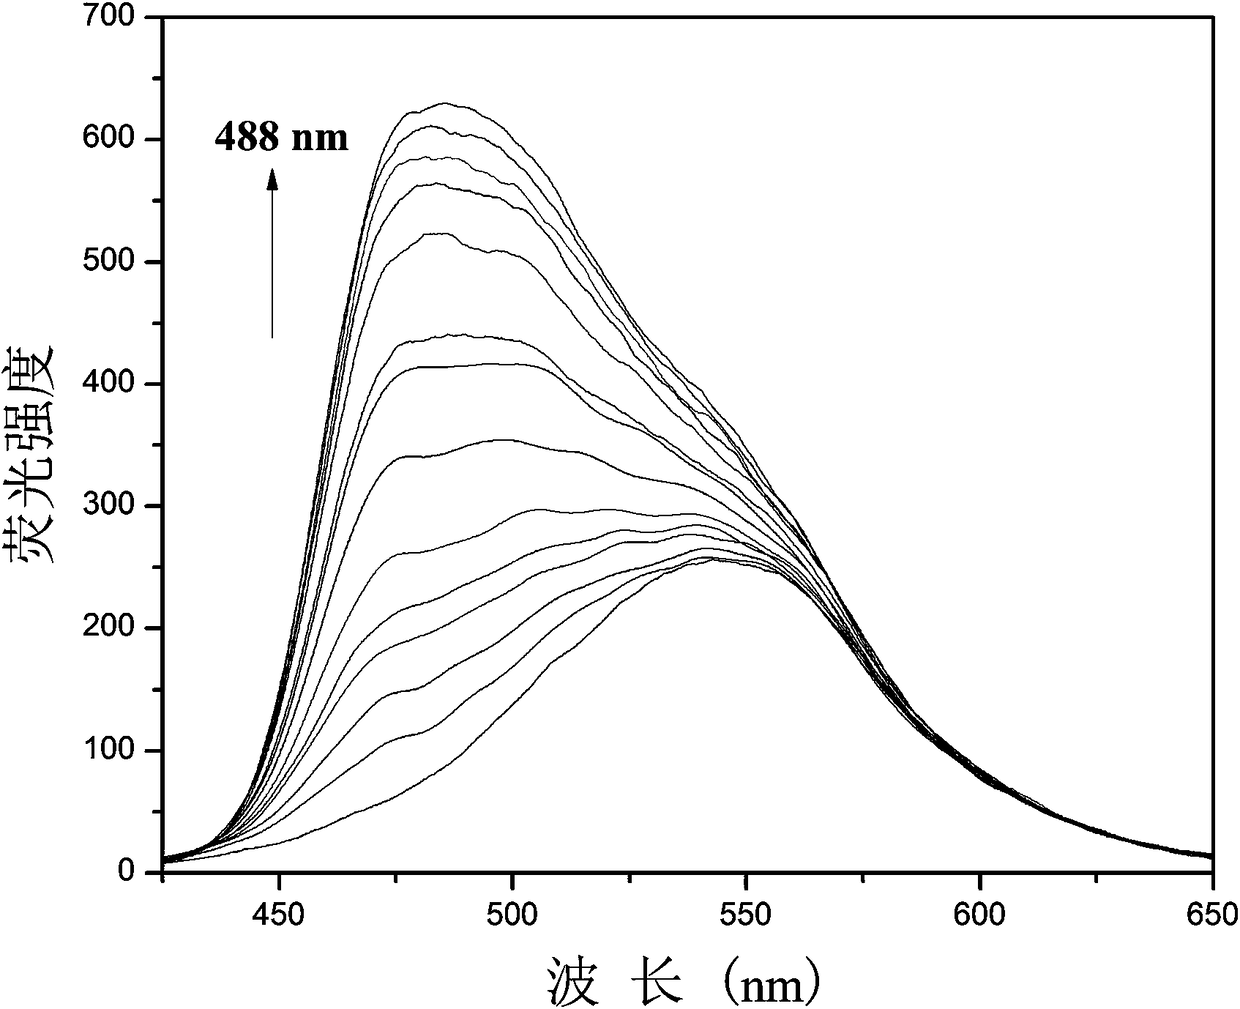
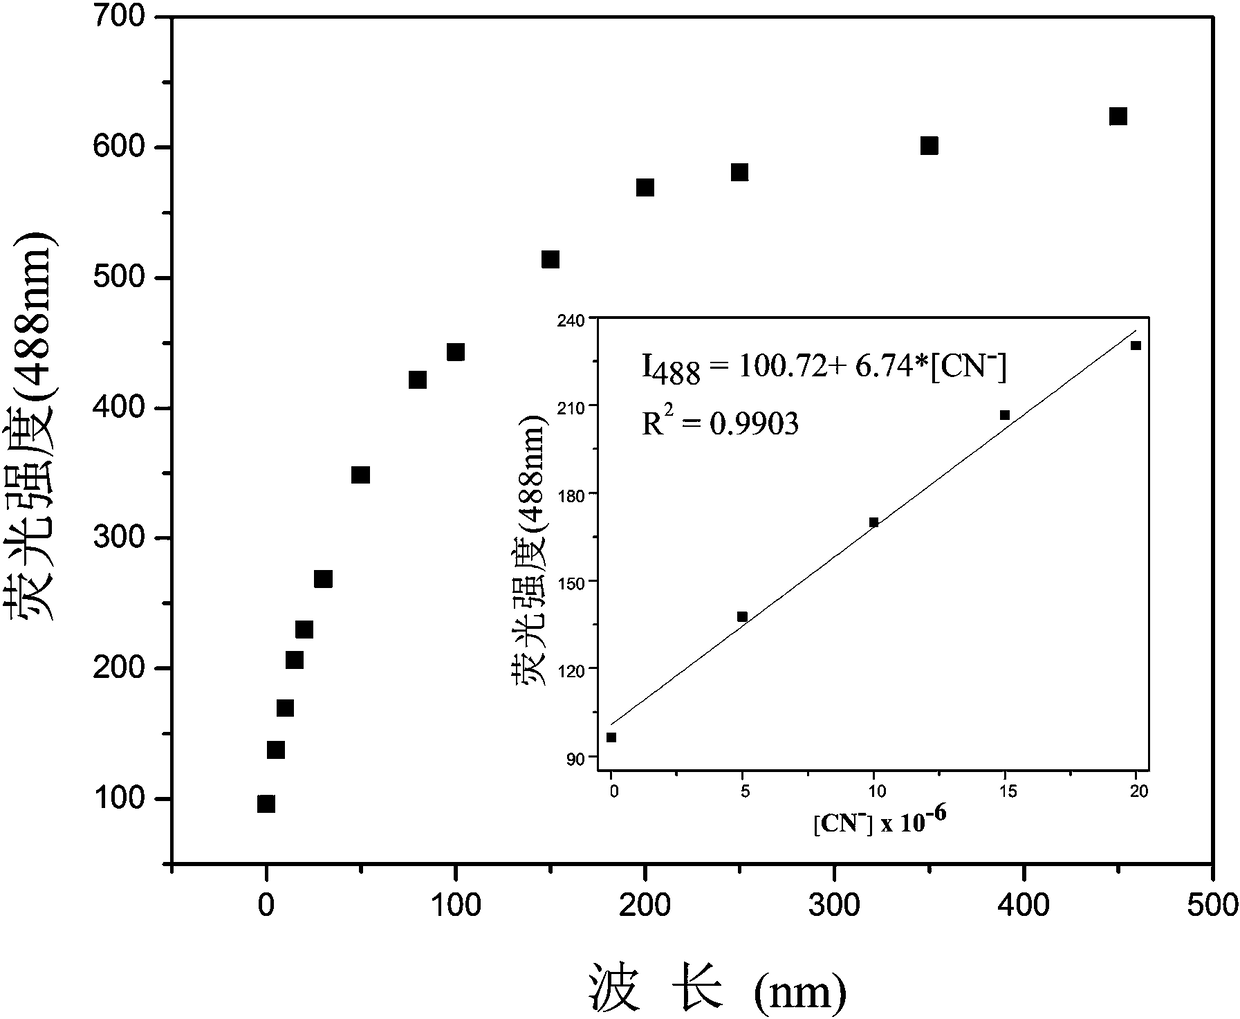
[0030] Add 20.0 µL of fluorescent probe stock solution to 2.0 mL of DMSO for CN - Fluorescence titration experiment, detected on a fluorescence spectrophotometer, the probe itself has an emission peak at 545nm, such as figure 2 As shown, with CN -A new peak appeared at 488nm and gradually strengthened. Instrument parameters: The slit widths of the excitation wavelength and emission wavelength are 2.5 nm and 2.5 nm respectively, the voltage is 600 V, and the maximum excitation wavelength of the fluorescent probe solution is: λ ex 415 nm and a maximum emission wavelength of λ em at 545 nm. Such as image 3 Shown in CN - The concentration is the abscissa, and the fluorescence intensity I 488 Plotting the graph for the ordinate gives CN - The working curve of concentration, linear regression equation is: I 488 = 6.74*[ CN - ] + 100.72, CN - The unit of concentration is 10 -6 mol...
PUM
 Abstract
Description
Claims
Application Information
 - R&D
- Intellectual Property
- Life Sciences
- Materials
- Tech Scout
- Unparalleled Data Quality
- Higher Quality Content
- 60% Fewer Hallucinations
Browse by: Latest US Patents, China's latest patents, Technical Efficacy Thesaurus, Application Domain, Technology Topic, Popular Technical Reports.
© 2025 PatSnap. All rights reserved.Legal|Privacy policy|Modern Slavery Act Transparency Statement|Sitemap|About US| Contact US: help@patsnap.com


