
Method of measuring the concentration of hydroperoxides of alkylaromatic hydrocarbons

Active Publication Date: 2003-11-20
SABIC GLOBAL TECH BV
View PDF16 Cites 0 Cited by
  • Summary
  • Abstract
  • Description
  • Claims
  • Application Information

AI Technical Summary

Benefits of technology

[0014] To reduce the time and labor expended in analysis, and also to increase the safety level and decrease the cost of production, it is proposed that a concentration of hydroperoxides of alkylaromatic hydrocarbons in liquid industrial streams at any stages of processes be determined directly using a spectroscopic method. The spectrometer employed in the spectroscopic method is calibrated according to a series of known concentrations of the hydroperoxide solutions, which correspond to a desired range of concentrations that are to be measured. The calibration model obtained from the known concentrations is stored in the memory of a computer by appropriate software. Analysis of a sample for its hydroperoxide content can then be carried out directly in the stream, preferably in a near infrared spectrum, with the concentration of hydroperoxide in the stream being calculated using the calibration model.
[0017] According to the disclosure, a spectrometer transmission probe made of an inert material is placed in process stream or in a sample. The probe can be employed in a laboratory setting, or more preferably, is disposed in an appropriate pipe on an industrial system for direct measurement of a process stream. The probe can be connected to the spectrometer using fiber-optic cables or the like. When the spectrometer probe is put in the sample, the CHP concentration is measured by reading the spectrum and using the corresponding calibration of the device. Special software for the NIR spectrometer calculates the CHP concentration from the signal that is measured. The analytical procedure is completely finished in 2 to 5 minutes or less, depending on the device that is used, and does not require the use of additional reagents. The NIR spectrometer, the fiber-optic probes, and the equipment connected with them were developed in such a way that they do not contain moving parts (or a minimum number of them), which makes service relatively inexpensive and makes the system highly reliable when installed under production conditions.
[0018] A critical requirement for measuring the CHP concentration is first to correctly calibrate the device using standard solutions containing known concentrations of CHP. Nevertheless, this procedure is easy to perform, and the calibration model that is obtained is stable over a long period of time. The standard software for the NIR spectrometer can perform the required calculations on one wavelength at which the absorption is quantitatively connected with the CHP concentration in accordance with the Bouguer-Lambert-Beer law. Measurements at one wavelength are possible; however, it is preferable to use more complex models that are built on several wavelengths, since they ensure better accuracy and reproducibility. These models use several wavelengths, usually no fewer than two wavelengths, which are selected from the NIR spectrum. A calculation algorithm can use multiple linear regression (MLR) or the method of partial least squares (PLS). An important factor in selecting the algorithm is its ability to exclude from the calculation absorption bands from other components that are present in the mixture, such as cumene, phenol, acetone, or the like; these absorption bands are superimposed on those of CHP.
[0019] Automatic "on-line" continuous determination of CHP in the commerical process stream at the stages of cumene oxidation and CHP decomposition makes it possible to conduct the process in a safer way compared to the prior art discussed above and has a significant economic effect by giving greater operative control over the process, especially if the data are used immediately in a distributed processing control system. In this case, the controlling machine can use the digital data from the analyzer to optimize the process, with additional data being used to achieve maximum yield and the greatest safety.
[0021] The method according to the disclosure is rather flexible and can be used both at the cumene oxidation stage and at the CHP decomposition stage. The composition of samples and the component matrix differ significantly in these two cases. For example, the products of cumene oxidation include, in addition to CHP and cumene, which are present in large concentrations, components such as acetophenone, 2-phenyl-2-propanol (dimethylphenylcarbinol, DMPC), and water, while the concentration of CHP in the CHP decomposition reaction mixture is much lower and the basic components of this mixture are cumene, acetone, and phenol. Nevertheless, the CHP concentration can be analyzed quickly and precisely.
[0022] The advantages include rapid and precise non-destructive laboratory analysis of the content of cumene hydroperoxide (CHP), which saves time, labor, and reagent expenses; rapid and precise measurement of the CHP concentration at critical areas in the stream: at the cumene oxidation stage and at the stage where CHP is decomposed into phenol and acetone; measurements are made in real time and can be used by the process control system to fine-tune the process in order to obtain the best safety and efficiency indices; and the delay resulting from the necessity of delivering samples to the laboratory and waiting for manual analysis results is eliminated.

Problems solved by technology

Moreover, CHP, like many other peroxide compounds, is thermally unstable, requires close monitoring of the reaction conditions, and constant monitoring of the current concentration of CHP in the reaction mixture to ensure the necessary level of production safety.
Since the stage of continuous decomposition of CHP is especially dangerous, laboratory analyses are done around the clock with a frequency of about 6 to about 12 times per day, which translates to about every 2 to about 4 hours.
However, both of the indicated methods are rather complex, require the use of expensive reagents, and are not practical for continuous industrial processes, e.g., continuous "in process" or "online continuous applications.
However, the method is generally destructive, indirect, and has only been successfully implemented for use in the CHP decomposition stream.
This method is not attractive for commercial use, since it requires a complex apparatus, uses a complex scheme of streams, and requires an added reagent, which needs to be precisely metered to obtain reproducible results as well as requires frequent replenishment.
Moreover, this method is inconvenient for measurements in the stream at the cumene oxidation stage, since the analysis process consumes a significant quantity of CHP.

Method used


Image

  • Method of measuring the concentration of hydroperoxides of alkylaromatic hydrocarbons
  • Method of measuring the concentration of hydroperoxides of alkylaromatic hydrocarbons

Examples


example 2

[0029] In this example, eight comparative samples were collected at 2 hour intervals from a CHP decomposition reaction vessel of an industrial system for producing phenol and acetone. These samples were delivered to the laboratory and analyzed for the residual concentration of CHP by the prior art method of iodometric titration as described in Example 1. However, a sodium carbonate solution was immediately added to the samples of CHP decomposition reaction mixture as soon as the samples were collected to neutralize the sulfuric acid, thereby stopping the cumene hydroperoxide decomposition reaction. Otherwise, the values of the residual CHP concentration that would be obtained would be too low.

[0030] Ten (10) milliliters (ml) of the previously neutralized sample of CHP decomposition reaction mixture were pipetted into a flask, to which 10 ml of acetic acid and 40 ml of a saturated potassium iodide solution in methanol were then added. The contents were refluxed for 5 minutes until th...

example 3

[0035] In this "in-process" example, two transmission probes made of stainless steel, which are analogous to those manufactured by Axiom Analytical Incorporated, were inserted into pipes (fluid conduits) in a continuously operating commercial phenol production facility using a multiple stage cumene oxidation system. The transmission probes were put into contact with a liquid reaction mixture exiting from the 1st and 4th oxidation reactors, and detected the presence of CHP. Periodically, the signal from the probes went to a standard NIR spectrometer, which performed a measurement and calculated the CHP concentration. Analyses were carried out using the spectral range of 6,600 to 8,000 cm.sup.-1. Measurements were carried every 5 to 6 minutes for 5 days, which gave approximately 250 measurements per day. This data, in turn, was transferred in digital form to a computer of a distributed control system produced by the Honeywell Company. The internal analytic data collected during in-pro...

example 4

[0038] In this "in-process" example, a transmission probe made of stainless steel, which is analogous to those manufactured by Axiom Analytical Incorporated, was placed in a pipe in a continuously operating CHP decomposition system. The probe had a continuous stream of the CHP decomposition reaction mixture passing through it. In this commercial plant stream, which consisted basically of phenol and acetone, the CHP concentration was measured at a frequency of once every 2 to 3 minutes. The spectrum was scanned, the obtained signal was processed, and the CHP concentration was calculated. The spectral range that was used was 6,000 to 10,000 cm.sup.-1. Approximately 400 measurements were performed per day, and the tests were carried out over a period of 3 days, i.e., 72 hours.

[0039] The analysis data were transferred in digital form to a computer of a distributed process control system, which used the data as an input signal for control. Table 4 presents the data obtained over the 3-da...


PUM

PropertyMeasurementUnit
Lengthaaaaaaaaaa
Lengthaaaaaaaaaa
Wavelengthaaaaaaaaaa

Abstract

A method for measuring a concentration of a hydroperoxide of an alkylaromatic hydrocarbon in a process stream comprises immersing a probe into the process stream; wherein the probe is coupled to a spectrometer; collecting absorption data with the spectrometer at a wavelength of 13,000 cm<-1 >to 4,000 cm<-1>; and calculating a concentration of the hydroperoxide of the alkylaromatic hydrocarbon in the process stream. In another embodiment, samples are withdrawn from the process stream and analyzed spectrometrically to determine the concentration of the hydroperoxide of the alkylaromatic hydrocarbon in the sample.

Description

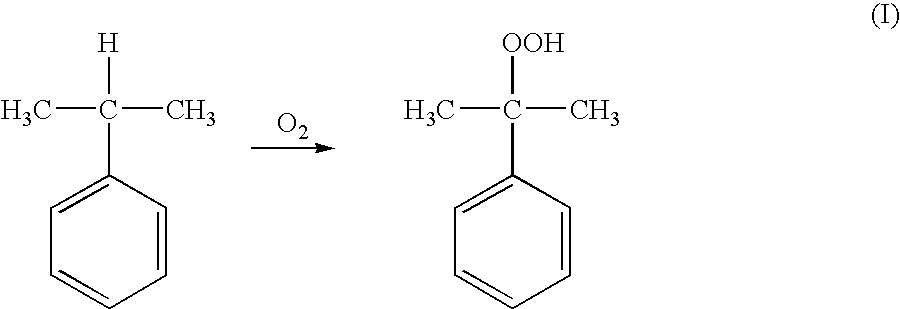
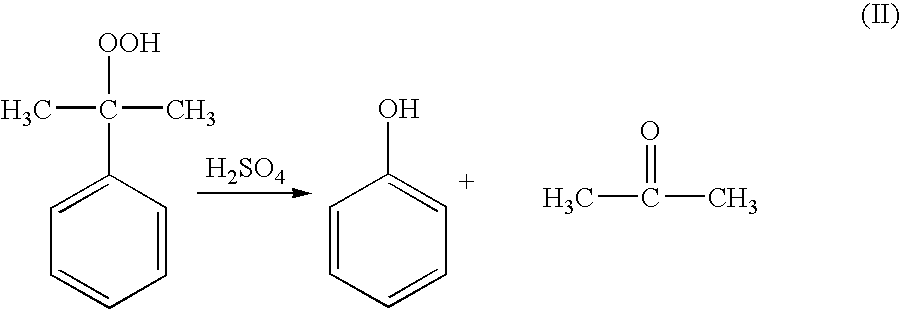
[0001] The present disclosure relates to the area of analytic control, namely to methods of measuring the concentration of hydroperoxides of alkylaromatic hydrocarbons in industrial streams, such as, for example, the measurement of the concentration of cumene hydroperoxide (CHP) in industrial streams obtained during the production of phenol and acetone by a cumene oxidation method.[0002] The industrial two-stage method of producing phenol and acetone involves continuously oxidizing cumene (isopropylbenzene) with atmospheric oxygen to form an intermediate, cumene hydroperoxide (CHP), in a system of sequential reaction vessels as generally shown by reaction scheme (I). 1[0003] As shown in reaction scheme (II), the intermediate CHP then undergoes acid decomposition with a protic acid to form the desired end products, i.e., phenol and acetone. The mixture of phenol and acetone that is formed in the process is separated and purified, usually by rectification on several columns. 2[0004] T...

Claims


Application Information

Patent Timeline
IPC IPC(8): C07C37/08G01N21/27G01N21/35G01N21/79G01N21/85
CPCC07C37/08G01N21/274G01N21/359G01N21/3577G01N21/8507G01N21/79C07C39/04
Inventor FULMER, JOHN WILLIAMZINENKOV, ANDREY VLADIMIROVICHDYCKMAN, ARKADY SAMUILOVICHBISHOP, RANDALL TODD
Owner SABIC GLOBAL TECH BV
Learn More