
Method and system for analyzing signal-vector data for pattern recognition from first order sensors

a signal-vector data and pattern recognition technology, applied in pulse manipulation, pulse technique, instruments, etc., can solve the problems of limited selection of multiple criteria electrochemical sensors, inability to discriminate fire-like nuisance sources using multiple criteria, and the inability of most sensors to have the specificity desired, etc., to optimize the performance of classifiers, maximize correct classification, and enhance feature selection

Inactive Publication Date: 2011-11-22
NAVY THE U S A AS REPRENSENTED BY THE SEC OF THE
View PDF37 Cites 18 Cited by
  • Summary
  • Abstract
  • Description
  • Claims
  • Application Information

AI Technical Summary

Benefits of technology

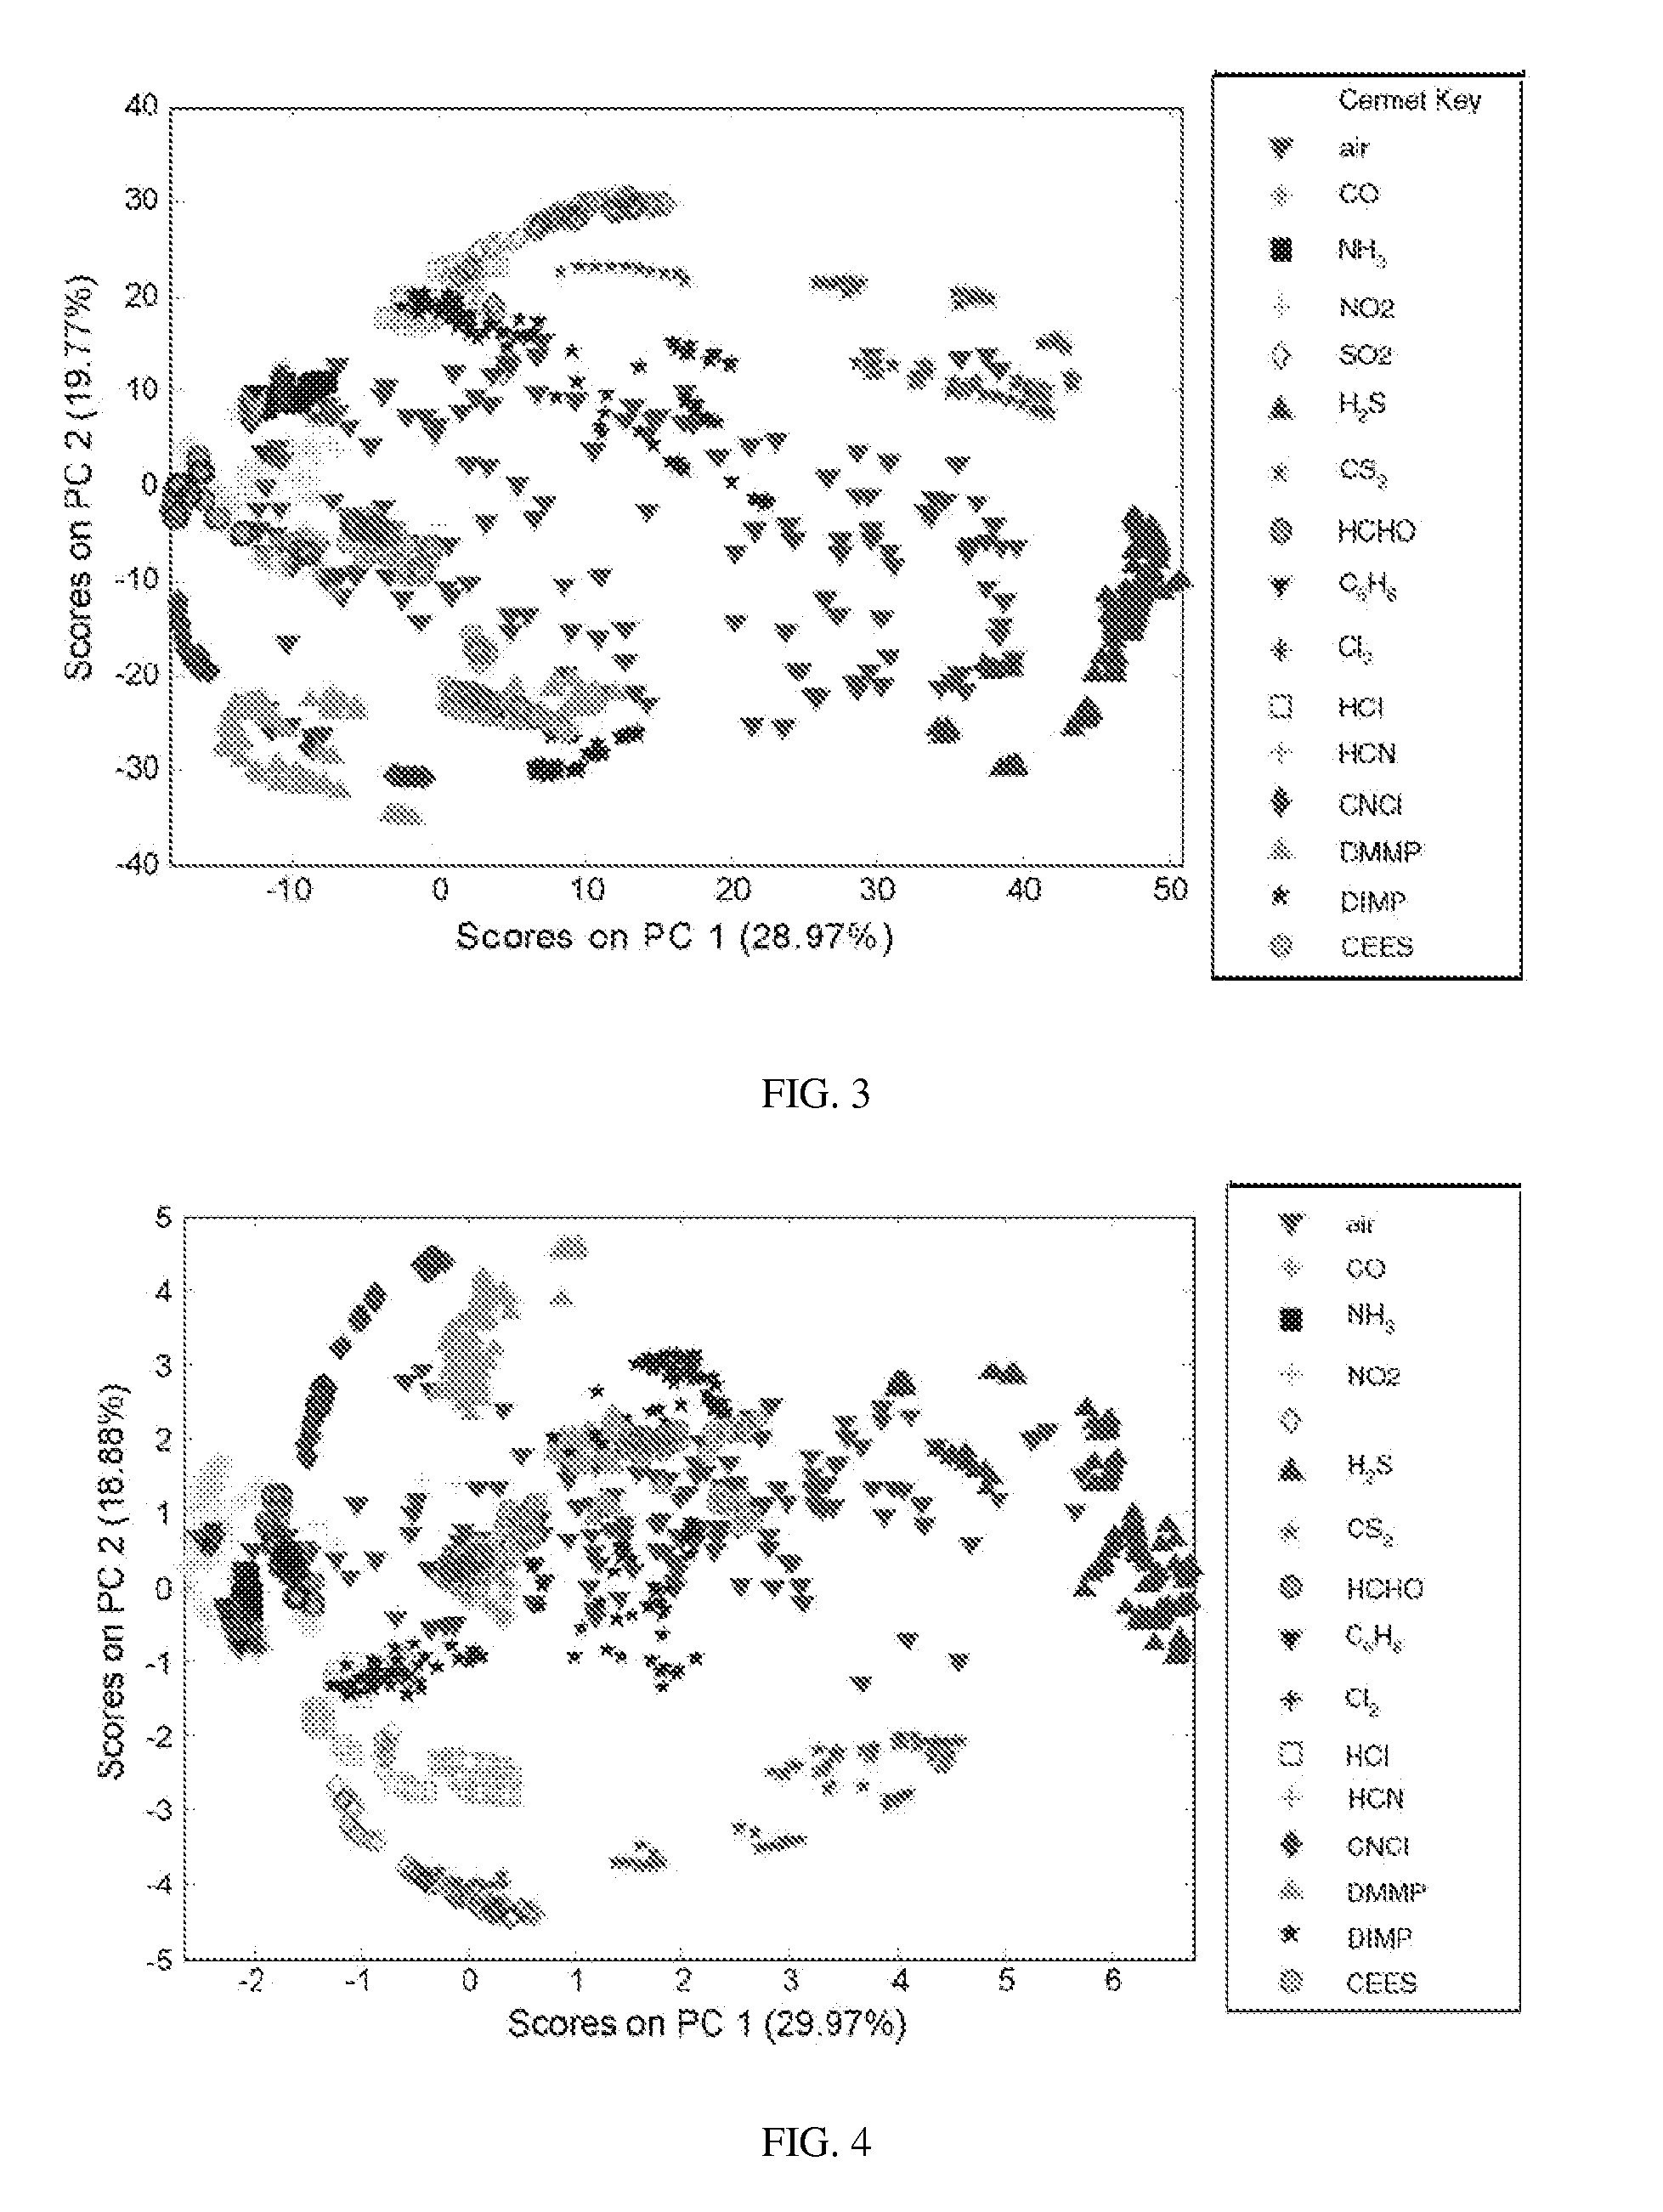
Principal component analysis was used merely to provide an interpretable view (or graphical display) of the multidimensional data space. However, principal component analysis was also used for comparison purposes to demonstrate the advantage of the present invention over other data analysis techniques, as discussed in further detail below. The MATLAB routines used for principal component analysis were provided in the PLS Toolbox, version 3.0.4 (Eigenvector Technologies, Inc., Manson, Wash.). FIG. 3 shows a principal component analysis plot of the training data set using the first two principal components which accounts for 49% of the variance in the training data. For the principal component analysis, the data was made more manageable by averaging every 10 points to reduce the data from about a 12,000 point vector to about a 1200 point vector. The 2400×1200 matrix was then autoscaled (mean center, unit variance) and principal component analysis was used to reduce the dimensionality of the data from 1200 down to 7 while maintaining 85% of the variance.
over other data analysis techniques, as discussed in further detail below. The MATLAB routines used for principal component analysis were provided in the PLS Toolbox, version 3.0.4 (Eigenvector Technologies, Inc., Manson, Wash.). FIG. 3 shows a principal component analysis plot of the training data set using the first two principal components which accounts for 49% of the variance in the training data. For the principal component analysis, the data was made more manageable by averaging every 10 points to reduce the data from about a 12,000 point vector to about a 1200 point vector. The 2400×1200 matrix was then autoscaled (mean center, unit variance) and principal component analysis was used to reduce the dimensionality of the data from 1200 down to 7 while maintaining 85% of the variance.
Following normalization, wavelet transformation was also used. A wavelet transformation technique is row-wise applied to the normalized training data set. The wavelet transformation technique used in this example is discrete wavelet transformation. The discrete wavelet transformation is a fast wavelet transformation. In this case, “Daubechies 8” was the preferred wavelet. However, other wavelet transformation techniques and / or other wavelets may be selected for use in the present invention, as would be apparent to one skilled in the art. The particular choice of wavelet transformation technique to use will depend on the signal characteristics of the measured data. The Daubechies wavelet is commonly used in similar applications and is well suited to describing the broad features located in the spectra output by a cermet microsensor array. However, as previously discussed, prior to transformation, the spectra from each sensing element are separated and extended to dyadic length as required by the fast wavelet transform algorithm of Daubechies 8. As such, the waveform was reduced from 12,000 to 1024 points. After wavelet transformation, a wavelet-transformed training data matrix is developed of the same size as the normalized training data matrix, but with wavelet coefficients occupying the rows rather than time-dependant current measurements. For an example of the effects of wavelet transformation see FIGS. 8A and 8B of Example 2.
Algorithm implementations utilized for wavelet transformation of the training data set are taken from the WaveLab toolbox for MATLAB (particularly WaveLab802), which is available from Stanford University (http: / / www-stat.stanford.edu / ˜wavelab / ). Wavelet transformation of cermet microsensor array data provides two principal advantages: data compression and the ability to apply enhanced feature selection. A wavelet transformation takes data from a time domain to a scale-dependant frequency domain. Varying this scale allows for a series of wavelet coefficients to describe frequency-based features in the data that are also localized at specific times.
Further data compression is achieved by selectively filtering out coefficients from the wavelet transform that contain little or no signal. Feature selection is achieved by locating coefficients that contain information relevant to a desired classification. The wavelet coefficients are automatically processed in order to select for relevant features. Coefficients that are less than an optimized threshold in every spectrum are automatically discarded. In this example, an analysis of variance (ANOVA) calculation is performed column-wise on the wavelet coefficients in order to locate coefficients that are effective at discriminating between different analyte gases.
ANOVA examines the inter- and intra-class variance between the data for the various analytes. As the training data set is generated using known gas analytes, it is known which analyte gas corresponds to each row of the wavelet-transformed data matrix. The value calculated by the ANOVA equation is a Fischer-ratio or an “f-ratio”, which is the ratio of the variance observed over the measurements of different analytes to the variance observed in the measurement of only one analyte. The magnitude of the f-ratio provides an indicator of class separation for each calculated wavelet coefficient over the wavelet-transformed data matrix. Data that produce an f-ratio greater than a set threshold are retained as features while the remaining data are discarded. The threshold selected is one that provides the greatest between class variance when compared to the variance within a class. This threshold is determined through cross-validation to maximize correct classification by optimizing the classifier's performance. The set of wavelet coefficients thus chosen comprises the set of selected features to be used in subsequent classification of unknown gas samples. As one mode of output, the waveform data can then be reconstructed using the selected coefficients.

Problems solved by technology

Although the use of multiple conventional electrochemical sensors monitoring multiple criteria has been studied for this type of chemical identification with varying degree of success, most of the sensors did not have the specificity desired.
For example, in fire detection, multiple criteria electrochemical sensors have difficulty discriminating fire-like nuisance sources, such as welding, grinding steel, and cutting with a torch.
Further, multiple criteria electrochemical sensors are typically limited to only a few standardized test sources, without providing the range of detection capability often desired.
However, the use of cyclic voltammetry creates complex data waveforms having a great deal of information, such as peak position, magnitude, and shape, all of which can be exploited for analytical purposes.
However, the shear volume of data generated by cyclic voltammetry has caused concern about accuracy of probable identification of analyte sources, particular in the presence of quite similar nuisance sources.
The inclusion of unnecessary data points increases processing time and creates additional variables which can unnecessarily complicate or interfere with pattern recognition.
However, it is particularly difficult to discern narrow differences by mere visual inspection.
In other cases, another “quick and dirty” method has been used to reduces the wavelet data, but not by any particular method particularly suitable for classification purposes.
These “quick and dirty” methods do not ensure selection of the most desirable features of a wavelet, which can lead to lack of accuracy in pattern recognition.

Method used


Image

  • Method and system for analyzing signal-vector data for pattern recognition from first order sensors
  • Method and system for analyzing signal-vector data for pattern recognition from first order sensors
  • Method and system for analyzing signal-vector data for pattern recognition from first order sensors

Examples


examples 1 and 2

below utilize an array of four conventional cermet sensors which have different electrode-electrolyte-electrode configurations to provide slightly different sensing criteria. For example, in Example 1, sensor A is platinum-yttria stabilized zirconia-platinum / palladium (Pt—YSZ—Pt / Pd), sensor B is platinum-yttria stabilized zirconia-platinum (Pt—YSZ—Pt), sensor C is platinum-yttria stabilized zirconia-platinum-tungsten bismuth oxide (Pt—YSZ—Pt—WBO), and sensor D is platinum-yttria stabilized zirconia-platinum / palladium-tungsten bismuth oxide (Pt—YSZ—Pt / Pd—WBO). However, one skilled in the art can appreciate that data from only one sensor or from any plurality of sensors may be analyzed according to the present invention. Further, any data exhibiting such a cyclic waveform under various conditions should be suitable for analysis according to the present invention.

The following examples further describe the system and method of the present invention. In each Example, there generally exi...

example 1

Analyte Sensing for Detection of Particular Chemicals

In this example, the four sensors are exposed to clean air and then to a variety of analytes of interest. Analyte streams were produced by diluting certified gas cylinders of carbon monoxide (CO), nitrogen dioxide (NO2), sulfur dioxide (SO2), hydrogen sulfide (H2S), chlorine (Cl2), hydrogen chloride (HCl) (Air Gas, Los Angeles, Calif.) ammonia (NH3), carbon disulfide (CS2), benzene (C6H6), formaldehyde (HCHO), hydrogen cyanide (HCN) (Tex-La Gas, Sulphur, La.), and cyanogen chloride (CNCl) (HP Gas Products, Baytown, Tex.). Analyte streams of the nerve agent simulants dimethyl methylphosphonate (DMMP), diisopropyl methylphosphonate (DIMP), and 2-chloroethyl ethyl sulfide (CEES) were generated by certified permeation tubes (KIN-TEK, La Marque, Tex.). Various controllers were used such that the flow, temperature, and humidity of the purified air and analyte / air streams to create the known concentration of analyte needed under these kn...

example 2

Sensing for Fire Detection Under Different Conditions

Instead of sensing analytes for the detection of particular chemicals, cermet sensors were also used to detect fire or pre-cursors of a fire under various conditions using the data analysis methods of the previous invention as demonstrated by Example 1.

In both laboratory and shipboard environments, fire and nuisance sources were created to expose the detection systems to a range of potential shipboard scenarios. For example, the following fire sources were used in this example either in the laboratory environment, in the shipboard environment or in both environments: flaming cardboard box (with and without polystyrene pellets therein), flaming trash can, flaming shipping supplies, flaming mattress and bedding, flaming IPA spill, flaming heptane pan, flaming diesel-soaked rags, smoldering bag of trash, smoldering mattress and bedding, smoldering cable bundle, smoldering laundry, smoldering oily rags, heated painted bulkhead, IPA pa...


PUM


Abstract

A method and system of analyzing signal-vector data from first order sensors including providing a training data set, adjusting the training data set using a background adjustment technique, normalizing and transforming the training data set into wavelet coefficients, using an automated analysis of variance feature selection technique and a pattern recognition technique to classify the training data set. The method and system may also include performing these operations on an unknown sample data set collected under unknown conditions and comparing the unknown sample data set to the classification model to provide an identity of the unknown conditions associated with the unknown sample data set. The present invention is also directed to a computer system for analyzing signal-vector data according to this method and a sensing system that includes a sensor and a microprocessor on which is stored a classification model for real-time sensing of unknown sample data sets.

Description

FIELD OF THE INVENTIONThe present invention is generally directed to a method and system for analyzing a large volume of complex signal-vector data for pattern recognition, particularly from first order sensors.BACKGROUND OF THE INVENTIONMost conventional sensors for the detection of chemicals and / or fire are electrochemical sensors. Electrochemical sensors operate at a fixed potential. Changes in that fixed potential, caused by the presence of an analyte, signal the analytes presence. Most often these sensors are directed towards the recognition of a single analyte and utilize a single sensor or a simple array of sensors.Current concerns about homeland security, battlefield protection and terrorist activities have created an interest in sensors that detect a variety of chemicals, such as a variety of blood agents, toxic industrial chemicals, explosives, etc, preferably with specificity for the identification of type and quantity of chemicals detected.Also, an interest has developed...

Claims


Application Information

Patent Timeline
IPC IPC(8): G06K9/00G01N30/86G01N33/50
CPCG06K9/527G06K9/6228G06F2218/00G06F18/211
Inventor ROSE-PEHRSSON, SUSAN L.HAMMOND, MARK H.JOHNSON, KEVIN J.
Owner NAVY THE U S A AS REPRENSENTED BY THE SEC OF THE
Learn More