Measurement of Cardiac Output and Blood Volume by Non-Invasive Detection of Indicator Dilution for Hemodialysis

a technology of indicator dilution and cardiac output, which is applied in the field of cardiac output detection by non-invasive detection of indicator dilution for hemodialysis, can solve the problems of severe risks to patients, high cost and invasiveness of catheter placement, and inability to accurately measure cardiac output, etc., to achieve the effect of improving the accuracy of cardiac measurements

Active Publication Date: 2008-01-17
ALFRED E MANN INST FOR BIOMEDICAL ENG AT THE UNIV OF SOUTHERN CALIFORNIA
View PDF38 Cites 37 Cited by
  • Summary
  • Abstract
  • Description
  • Claims
  • Application Information

AI Technical Summary

Benefits of technology

[0027] In yet another aspect of the cardiovascular measurement devices and methods, a method for injection of the dye can improve the accuracy of the cardiac measurements. In some embodiments, the injection method comprises intravenous rapid bolus injection of a minimum volume of fluorescent dye followed by a rapid bolus injection of an inert solution (vehicle) without the dye.

Problems solved by technology

Thermodilution measurements of cardiac output are disadvantageous for several reasons.
First, placement of the thermodilution balloon catheter is an expensive and invasive technique requiring a sterile surgical field.
Second, the catheter left in place has severe risks to the patient such as local infections, septicemia, bleeding, embolization, catheter-induced damage of the carotid, subclavian and pulmonary arteries, catheter retention, pneumothorax, dysrrhythmias including ventricular fibrillation, perforation of the atrium or ventricle, tamponade, damage to the tricuspid values, knotting of the catheter, catheter transection and endocarditis.
Third, only specially trained physicians can insert the balloon catheter for thermodilution cardiac output.
Last, thermodilution measurements of the cardiac output are too invasive to be performed in small children and infants.
Dye-dilution measurements of cardiac output have been found to be disadvantageous for several reasons.
First, arterial blood withdrawal is time consuming, labor intensive and depletes the patient of valuable blood.
This calibration process can be very laborious and time consuming in the context of the laboratory where several samples must be run on a daily basis.
Further, technical difficulties arise in extracting the dye concentration from the optical absorbance measurements of the blood samples.
However, as described above, this technique remains limited by the difficulty of separating absorbance changes due to the dye concentration changes from absorbance changes due to changes in blood oxygen saturation or blood content in the volume of tissue interrogated by the optical probe.
This method is also expensive in requiring large amounts of dye to create noticeable changes in absorbance and a light source producing two different wavelengths of light for measuring light absorption by the dye and hemoglobin differentially.
Even so, the high background levels of absorption in the circulatory system make this technique inaccurate.
Thus, this technique is inconvenient for patients undergoing testing and practitioners awaiting results to begin or alter treatment.
However, these techniques have specific limitations.
However, these measures are not as accurate or reliable as direct methods of measuring blood volume.
However, to date, the dilution techniques for determining blood volume are disadvantageous because they are limited to infrequent measurement due to the use of indicators that clear slowly from the blood.
If the rate of fluid transfer from the extravascular space to the vascular space does not match the rate of fluid removal, the patient experiences hypovolemia, which reduces cardiac output, blood pressure and peripheral perfusion.
Patient weighing does not provide intradialysis monitoring.
Third, these minimally invasive methods may be performed at a patient's bedside or on an outpatient basis.
Finally, methods may be used on a broader patient population, including patients whose low risk factors may not justify the use of central arterial measurements of cardiovascular parameters.

Method used


Image

  • Measurement of Cardiac Output and Blood Volume by Non-Invasive Detection of Indicator Dilution for Hemodialysis
  • Measurement of Cardiac Output and Blood Volume by Non-Invasive Detection of Indicator Dilution for Hemodialysis
  • Measurement of Cardiac Output and Blood Volume by Non-Invasive Detection of Indicator Dilution for Hemodialysis

Examples


example 1

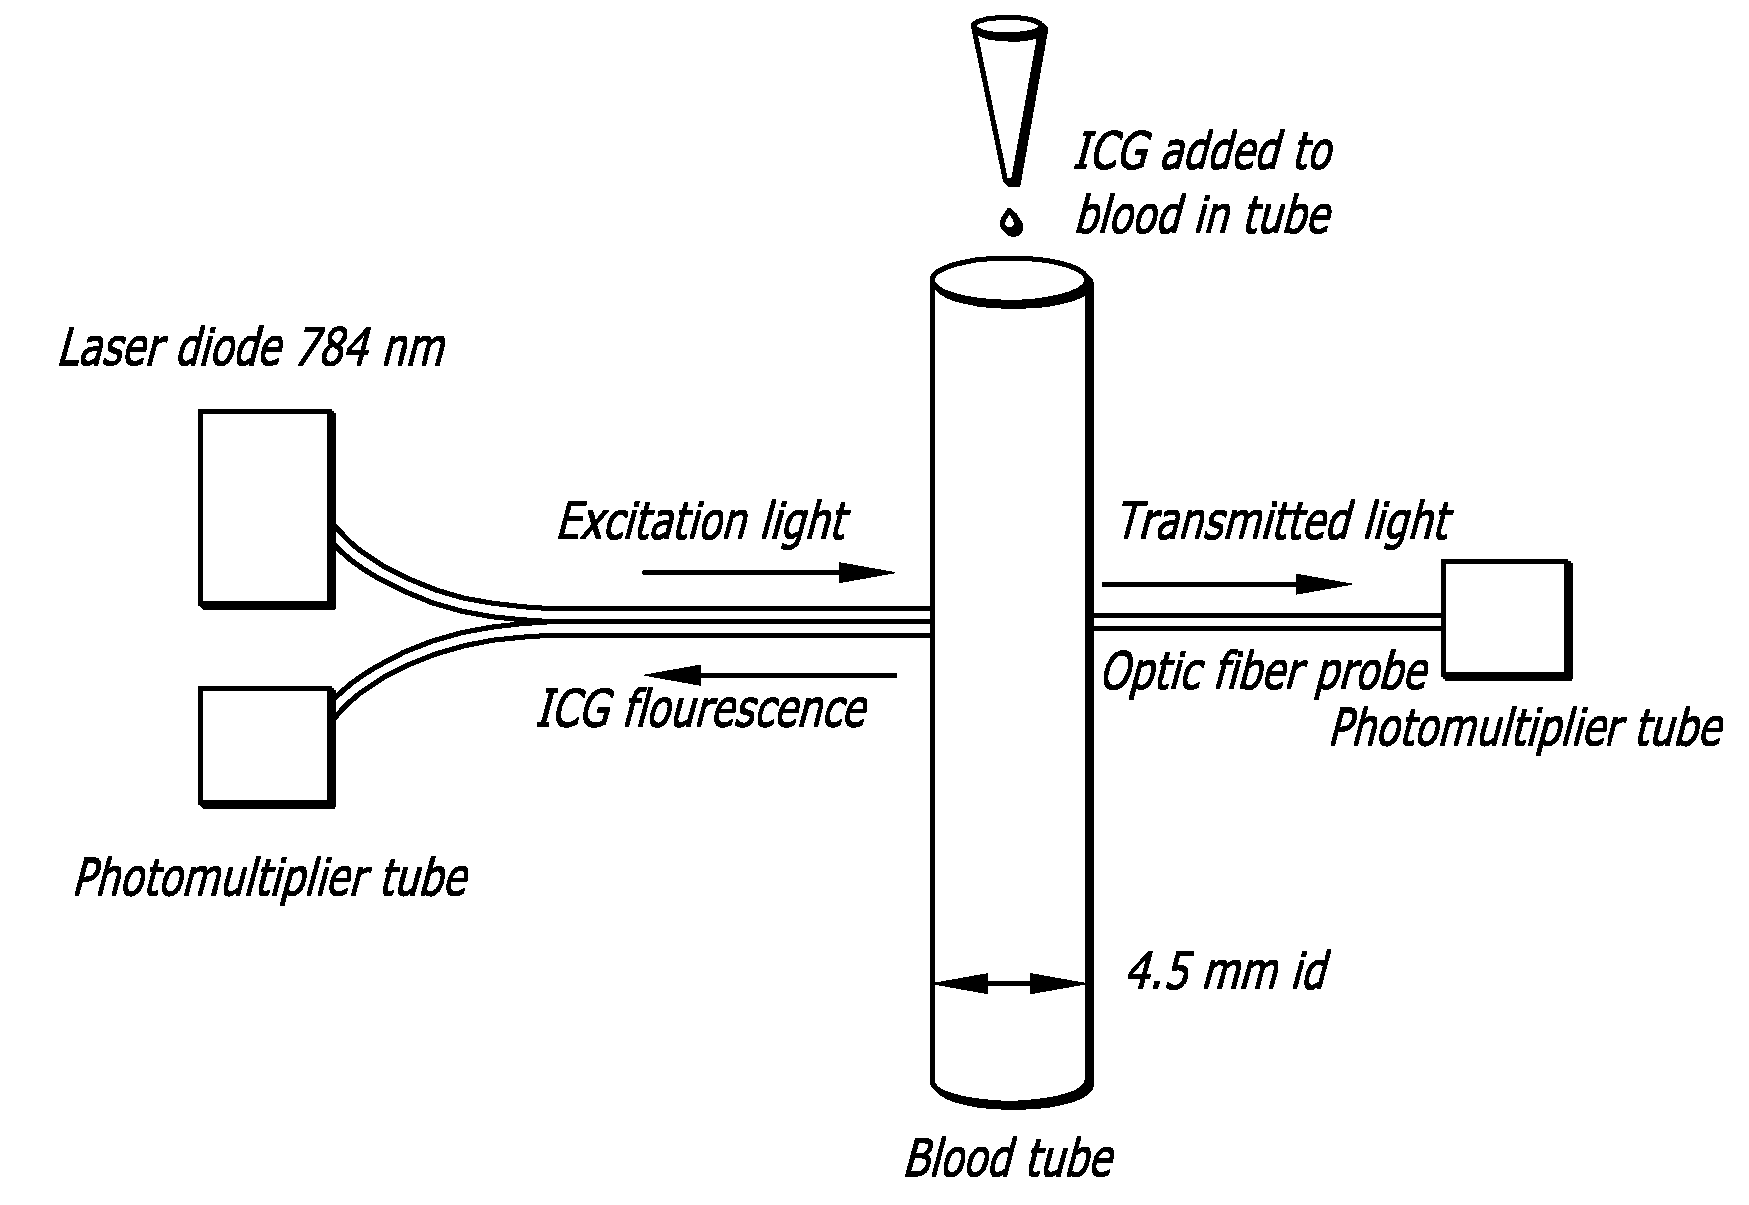
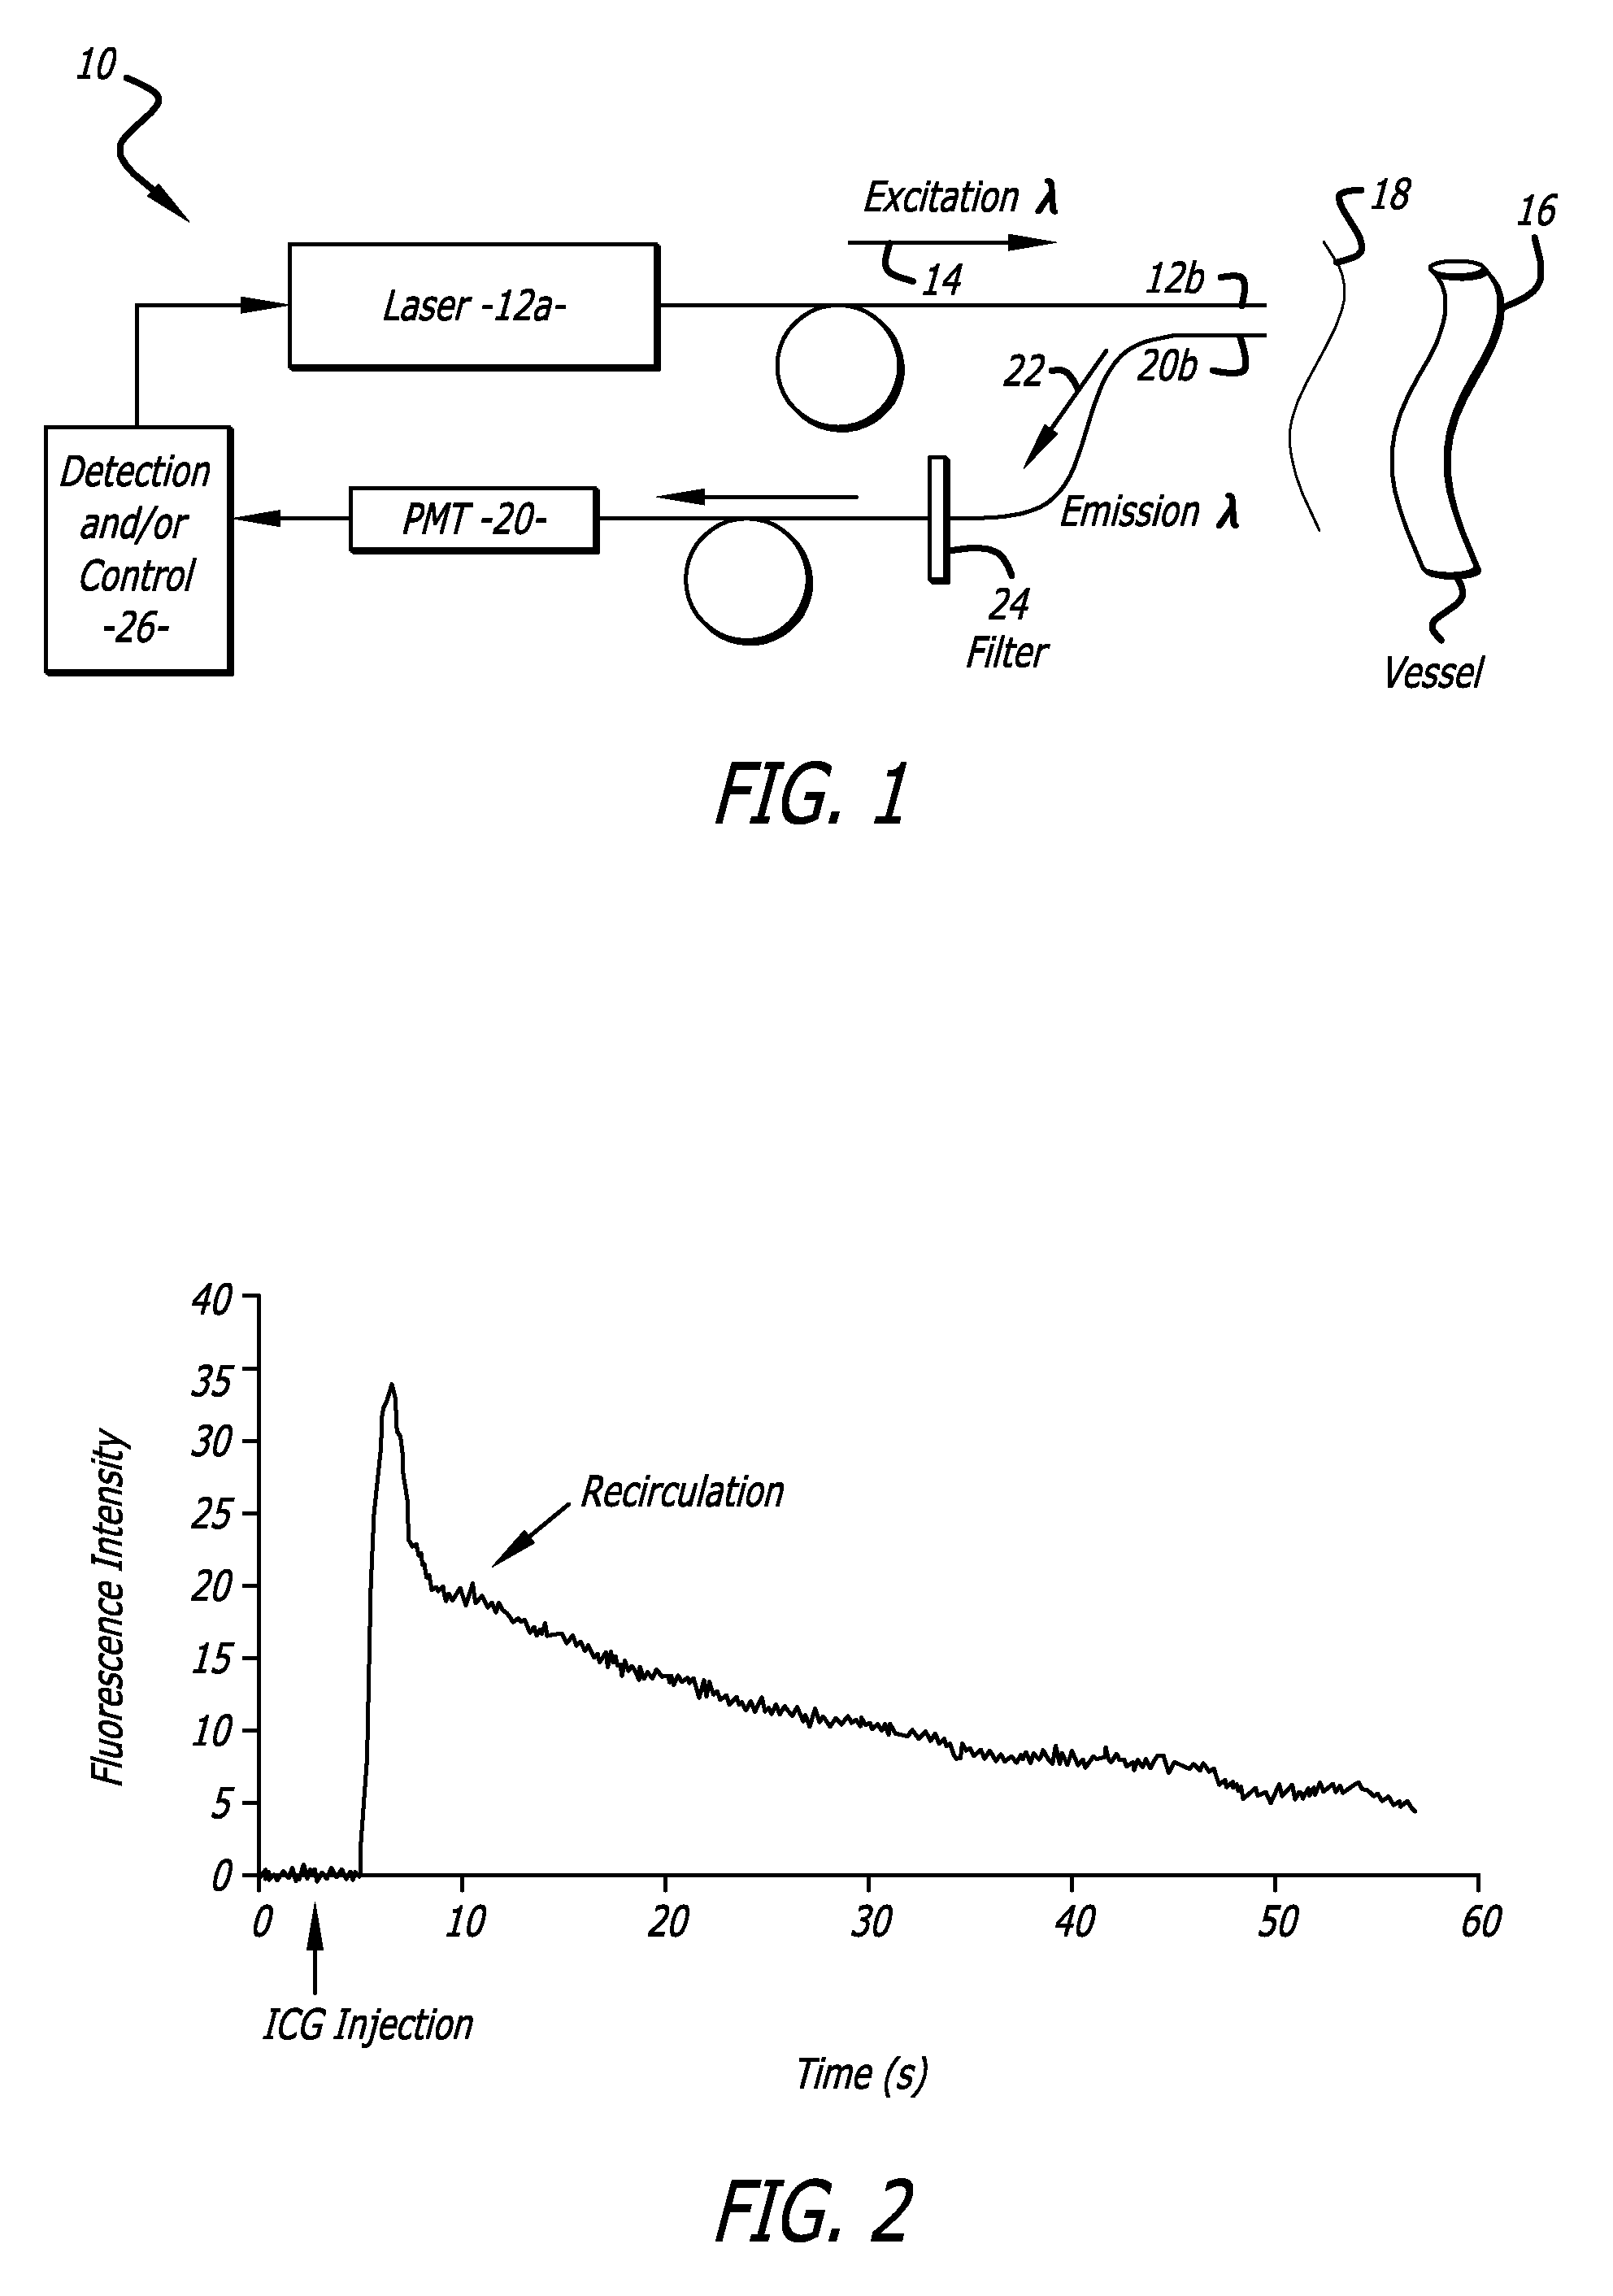
[0160] Experimental system and method. An implementation of the system and method of the cardiovascular measurement devices and methods was tested in rats. The excitation source was a 775 nm pulsed diode laser and the fluorescence was detected with a detector being a photomultiplier (PMT) with extended response in the near-infrared range of the spectrum (FIG. 1). Optic fibers were placed in close contact with the skin of the animal's ear for the excitation and detection of the indicator within the blood stream. After injection of a 100 μl bolus of ICG (0.0075 mg / ml) into the jugular vein of a rat, the fluorescence intensity trace (indicator concentration recording) was measured transcutaneously at the level of the rat's ear using reflection mode detection of emissions (FIG. 2).

[0161] Calculation of blood volume and cardiac output. The initial rapid rise and rapid decay segments of the fluorescence intensity trace represent the first pass of the fluorescent indicator in the arterial...

example 2

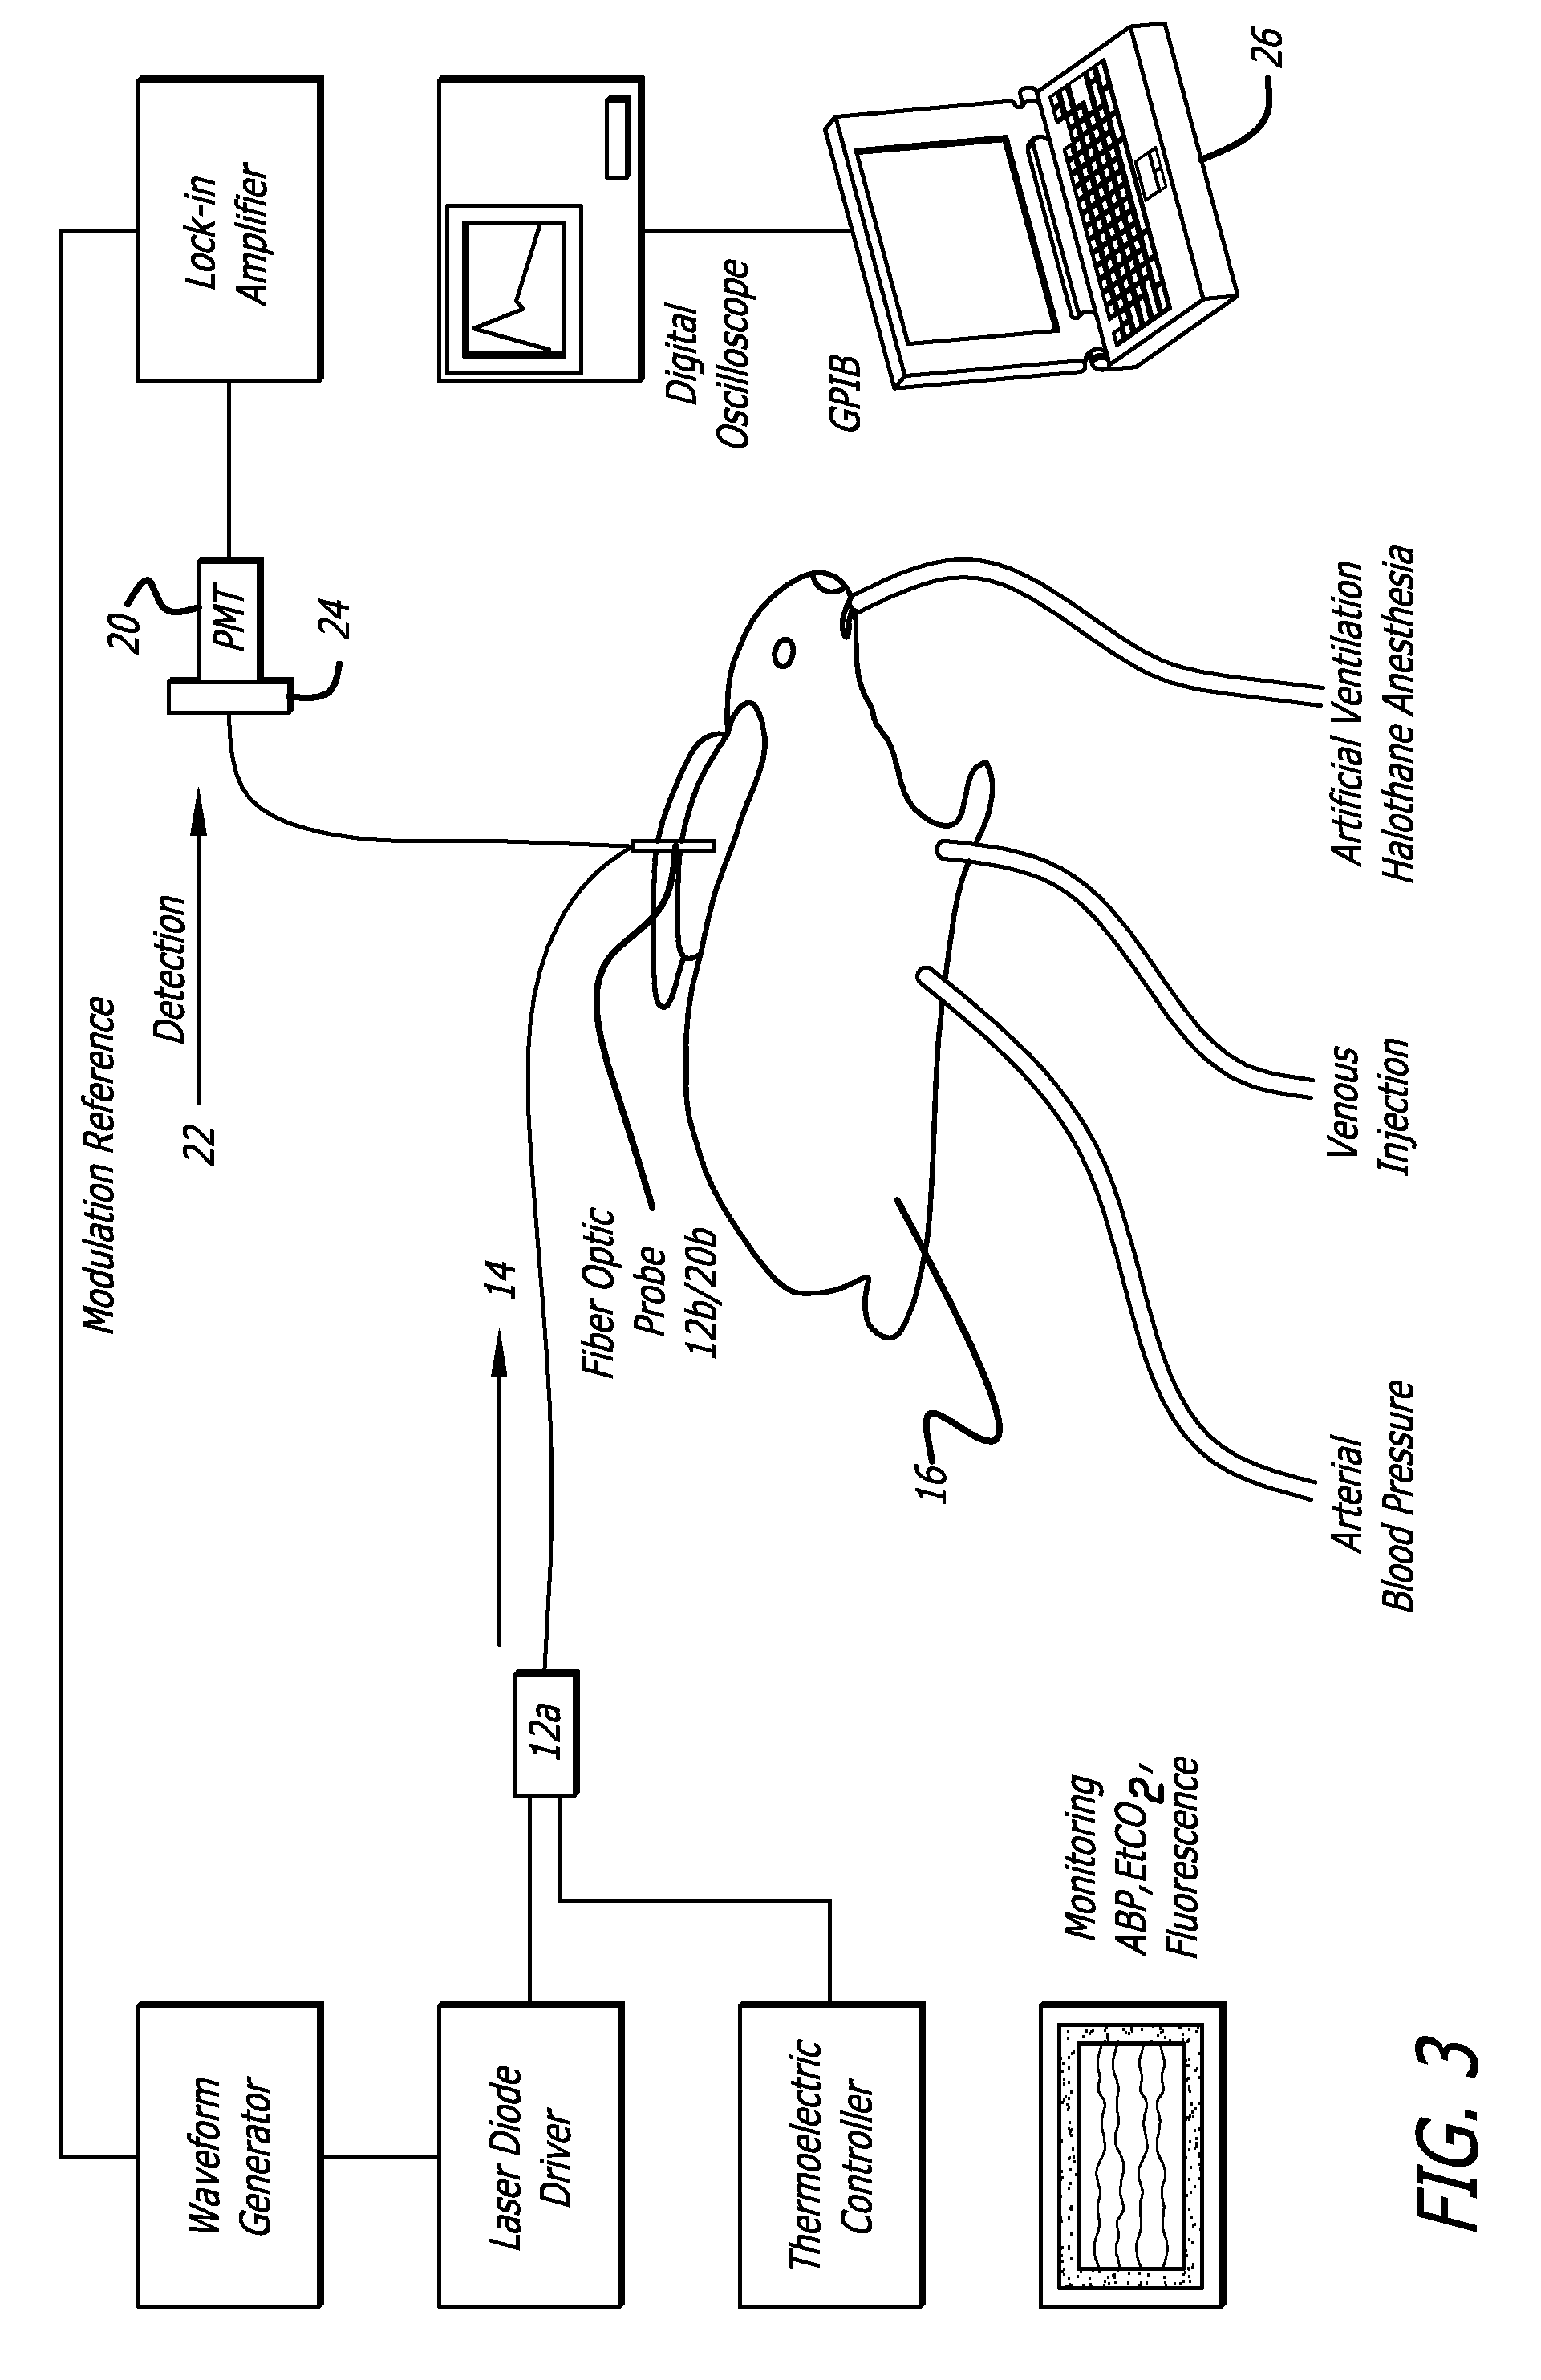
[0166] A. A sample method and system for measuring cardiac output and blood volume. Experiments have been performed in New Zealand White rabbits (2.8-3.5 Kg) anesthetized with halothane and artificially ventilated with an oxygen-enriched gas mixture (FiO2˜0.4) to achieve a SaO2 above 99% and an end-tidal CO2 between 28 and 32 mm Hg (FIG. 4). The left femoral artery was cannulated for measurement of the arterial blood pressure throughout the procedure. A small catheter was positioned in the left brachial vein to inject the indicator, ICG. Body temperature was maintained with a heat lamp.

[0167] Excitation of the ICG fluorescence was achieved with a 780 nm laser (LD head: Microlaser systems SRT-F780S-12) whose output was sinusoidally modulated at 2.8 KHz by modulation of the diode current at the level of the laser diode driver diode (LD Driver: Microlaser Systems CP 200) and operably connected to a thermoelectric controller (Microlaser Systems: CT15W). The near-infrared light output w...

example 3

[0194] Comparison with Thermodilution Method

[0195] Experimental methodology. Other experiments were performed in New Zealand White rabbits using the methodology described for the preceding example 2. In addition, a 4 F thermodilution balloon catheter was inserted into the right femoral vein and advanced until the thermistor reached the main pulmonary artery. Correct placement of the catheter tip was verified visually through the thoracotomy. The catheter was connected to a cardiac output computer to measure the thermodilution cardiac output. Cardiac output measurements were obtained with the present method (COICG) and the comparison thermodilution method (COTD) during baseline conditions, reduced flow conditions resulting from vagal stimulation, and increased flow conditions resulting from blood volume expansion with saline.

[0196] Results. Average values of COICG and COTD measured in baseline conditions in the 10 animals were 412 (±13) ml / min and 366 (±11) ml / min, respectively, in...


PUM


Abstract

A system and method of non-invasive or minimally invasive evaluating the cardiovascular system parameters to estimate the cardiac output and circulating blood volume of a patient undergoing hemodialysis. Intravascular indicators are stimulated, and emissions patterns detected for computation of cardiac output, cardiac index, blood volume and other indicators of cardiovascular health before and during hemodialysis.

Description

CROSS-REFERENCE TO RELATED APPLICATIONS [0001] This Application claims the benefit of an earlier-filed U.S. Provisional Patent Application Ser. No. 60 / 747,464, filed May 17, 2006, entitled “Measurement of Cardiac Output and Blood Volume by Non-Invasive Detection of Indicator Dilution for Hemodialysis,” attorney docket no. 64693-160. This application is also a continuation-in-part of U.S. patent application Ser. No.10 / 847,480, filed May 17, 2004, entitled “Measurement of Cardiac Output and Blood Volume by Non-Invasive Detection of Indicator Dilution,” attorney docket no. 64693-100; which is Continuation of U.S. patent application Ser. No.10 / 153,387, filed May 21,2002 (now U.S. Pat. No. 6,757,554, issued Jun. 29, 2004) entitled “Measurement of Cardiac Output and Blood Volume by Non-Invasive Detection of Indicator Dilution,” attorney docket no. 64693-027; which claims priority to U.S. Provisional Application No. 60 / 292,580, filed May 22, 2001, entitled “Method and Apparatus for Measure...

Claims


Application Information

Patent Timeline
Patent Type & Authority Applications(United States)
IPC IPC(8): A61B5/0275
CPCA61B5/0275A61M1/16A61M1/3609A61B2503/40A61M2230/04
Inventor RUBINSTEIN, EDUARDO H.HOLSCHNEIDER, DANIEL P.MAAREK, JEAN-MICHEL I.
Owner ALFRED E MANN INST FOR BIOMEDICAL ENG AT THE UNIV OF SOUTHERN CALIFORNIA
Why Eureka
Try Eureka