Detection of reactions and metabolic changes with fluorscent materials
a technology of fluorescence and metabolic changes, applied in the field of detection of reactions and metabolic changes with fluorescent materials, can solve the problems of difficult mastery of detection principle, limited temperature sensitivity by the overall system noise, and inability to meet the requirements of high throughput for screening thousands of compounds, etc., and achieve high throughput and high content screening. , the effect of high throughpu
- Summary
- Abstract
- Description
- Claims
- Application Information
AI Technical Summary
Benefits of technology
Problems solved by technology
Method used
Image
Examples
example 2
Absorption Spectrum of EuTTA / PMMA Coating
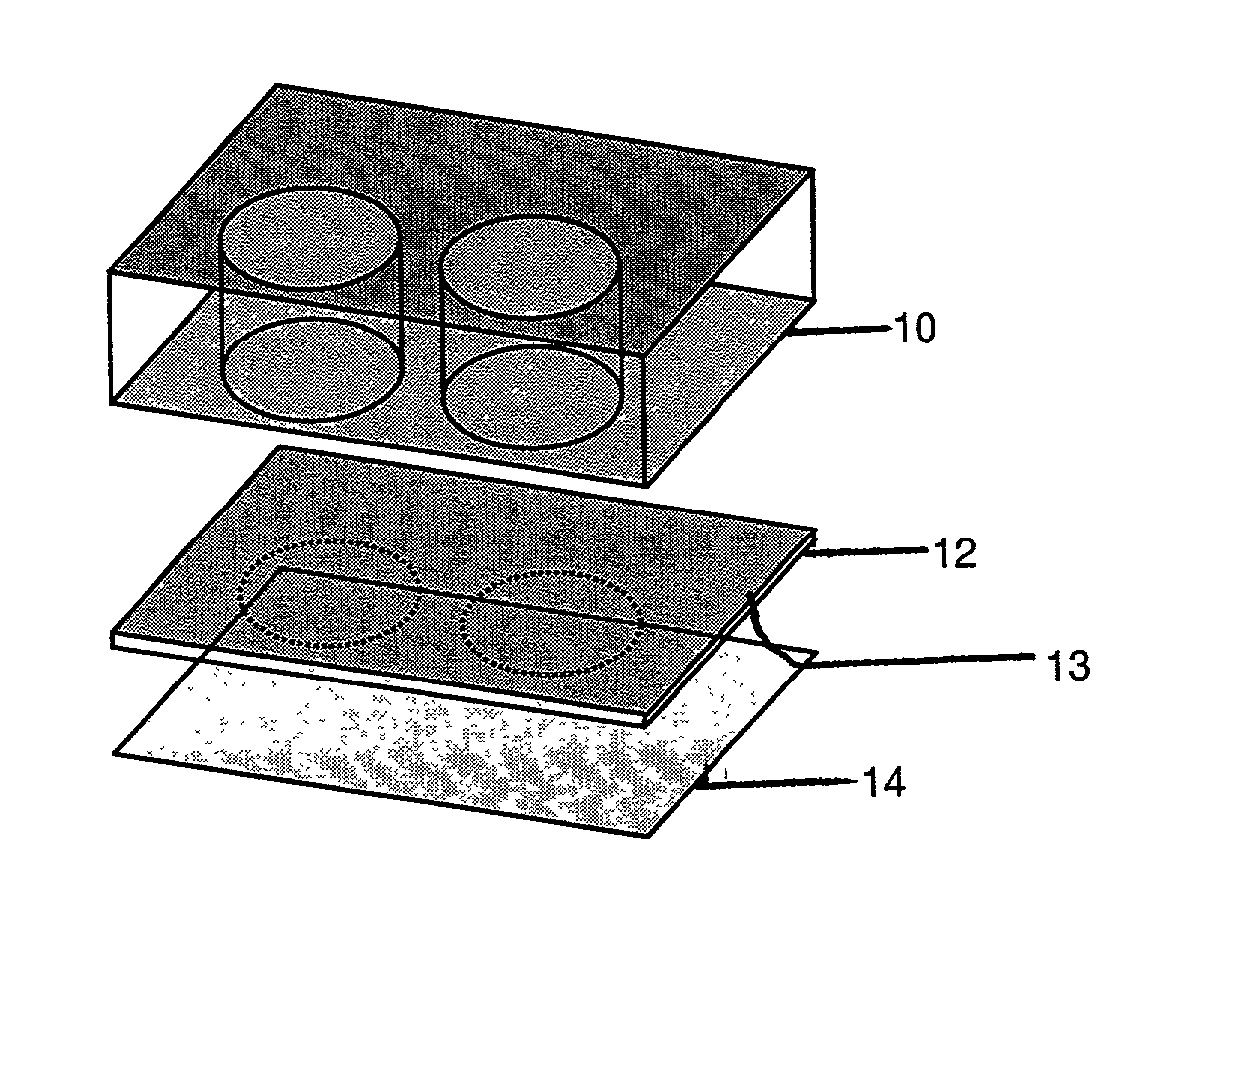
[0062] The absorption spectrum of the coating deposited on the microplate wells in Example 1 was measured every 2 nm with a SpectraMax.RTM. Plus (Molecular Devices Corporation, Sunnyvale, California) UV / VIS microplate spectrophotometer. The absorption spectrum extended from 200 to 400 nm and showed a maximum at 346 nm. The emission spectrum ranged from 500 to 650 nm and showed a maximum at 614 nm. The absorption and emission spectra are shown in FIG. 3.
example 3
Temperature Dependence of Fluorescence Signal from EuTTA / PMMA Coating
[0063] The fluorescence signal emitted by the coating deposited in Example 1 was measured at different temperatures. The microplate was heated and the fluorescence was measured at an emission wavelength of 614 nm using a SpectraMax.RTM. Gemini (Molecular Devices Corporation) dual-scanning microplate spectrofluorometer at an excitation wavelength of 355 nm over a temperature range from about 25.degree. C. and 34.degree. C. The results in FIG. 4 show an approximate 3% decrease per .degree. C. for a 2% EuTTA / 2% PMMA / 96% MEK coating initial composition.
example 4
Evaluation of the Limit of Detection
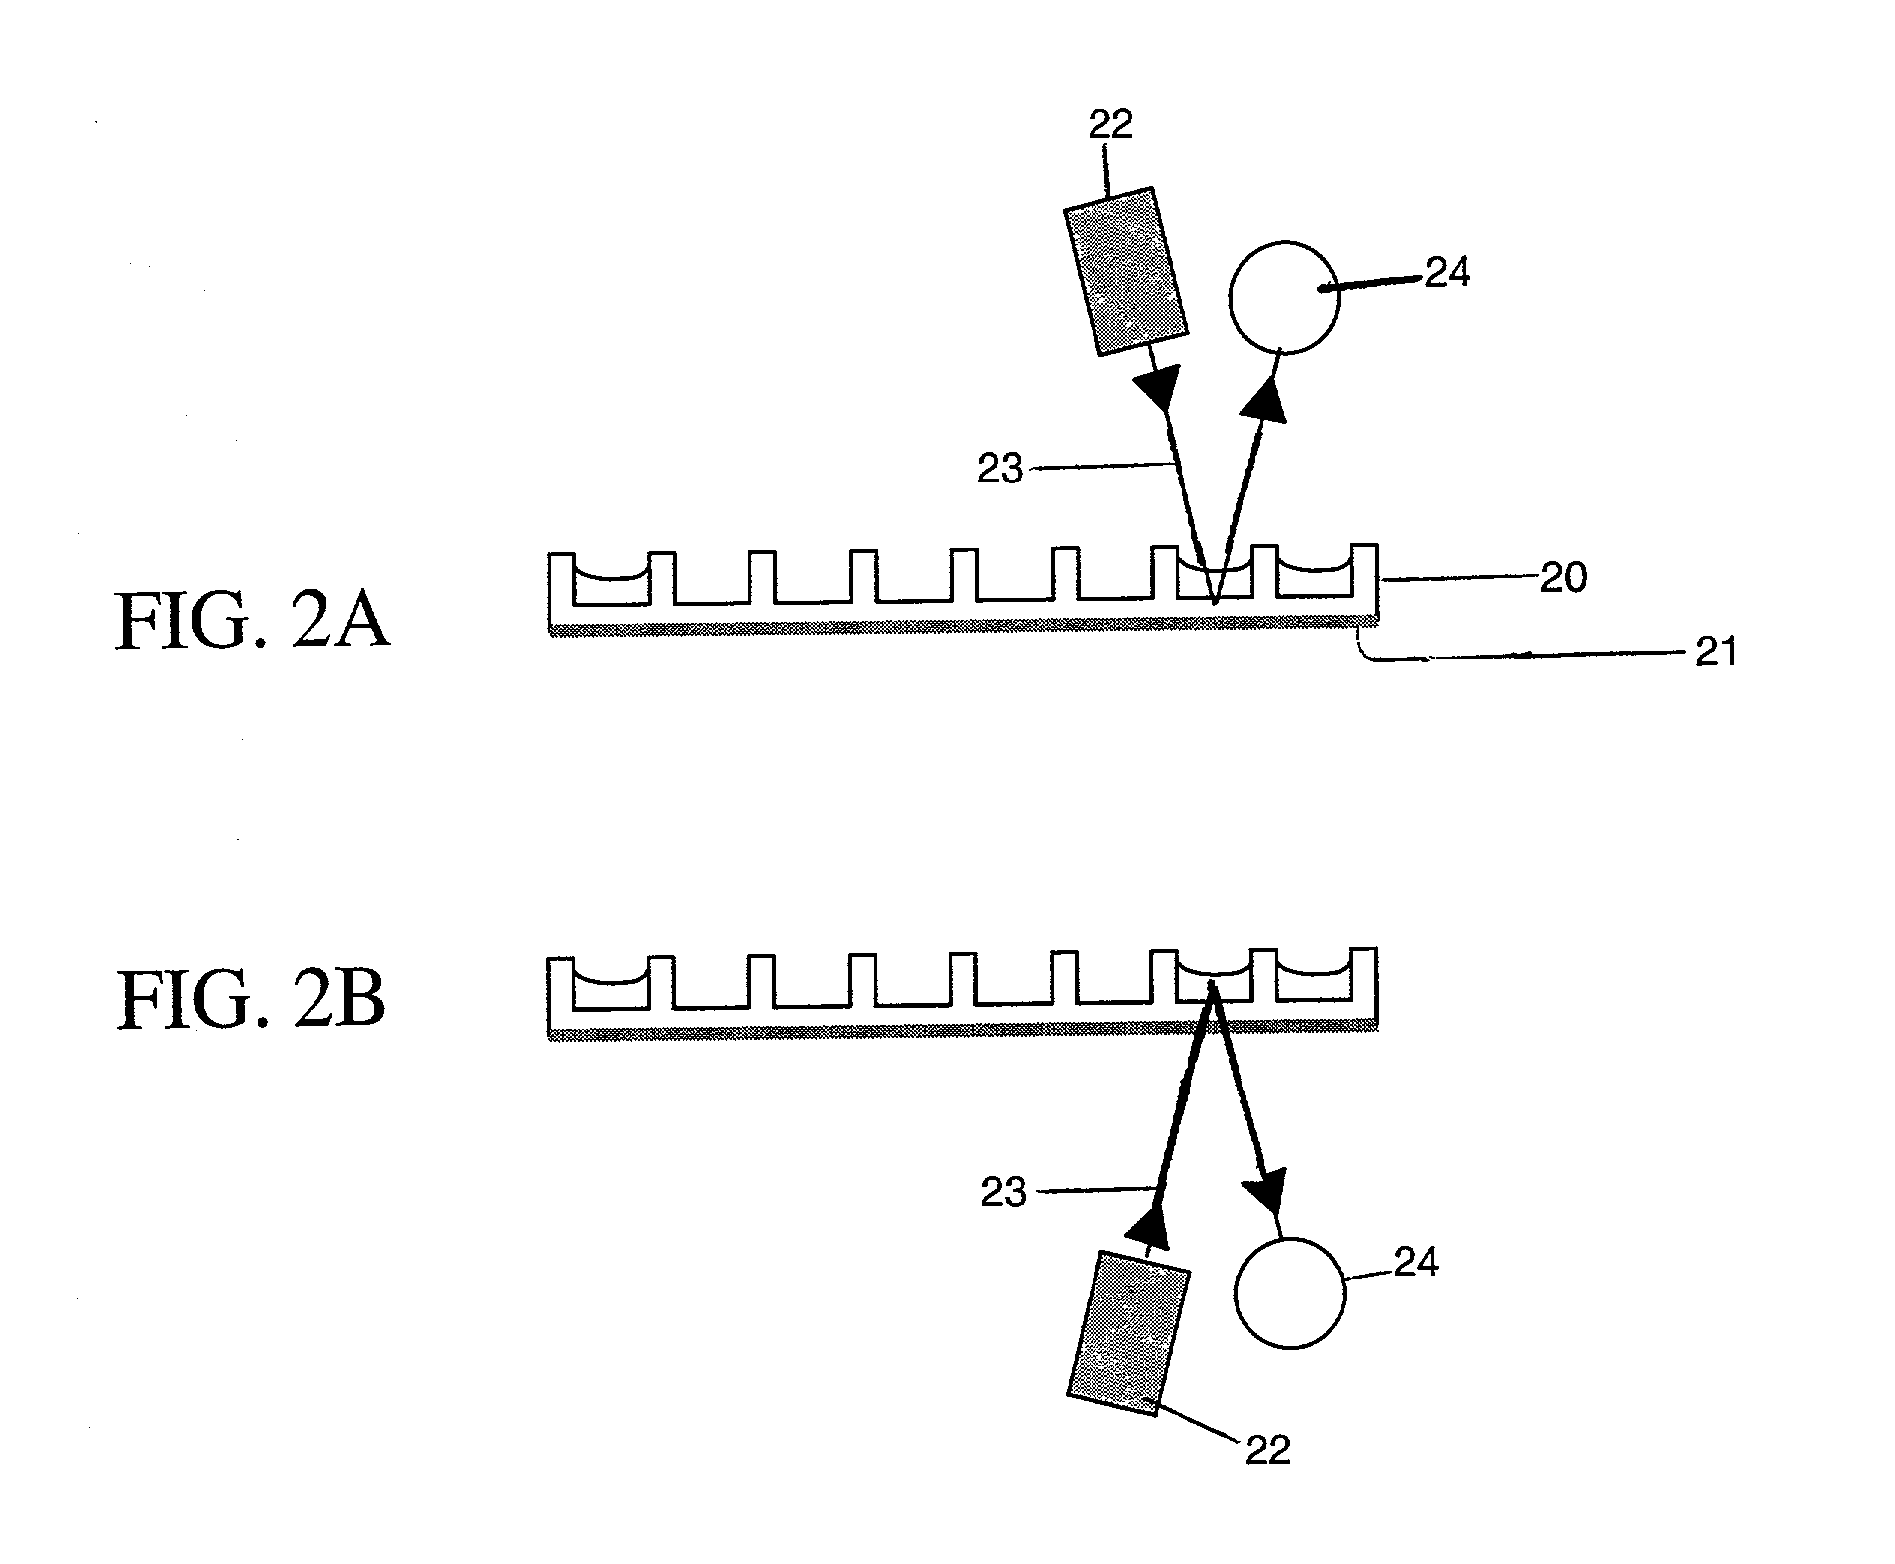
[0064] To evaluate the limit of detection, a noise measurement was done using a bottom read set-up as shown in FIG. 2B using a Fluoroskan Ascent available from Labsystems. A microplate coated with EuTTA / PMMA was prepared in accordance with Example 1. One column (8 wells) of the microplate was filled with water and a kinetic measurement was performed at temperatures ranging from 25.degree. C. to 35.degree. C. For each temperature point, 50 fluorescence measurements were performed at 20 seconds intervals. A graph of the results is shown in FIG. 5. Signal drift and signal noise was calculated by assimilating signal drift to a straight line and calculating its slope. The slope was equal to -0.0073 / .degree. C. The fluorescent signal measured was corrected according to the following formula (corresponding to the slope observed on the curves): Signal.sub.corrected=Signal.sub.raw+0.0073.times.Temperat-ure
[0065] The standard deviation of 50 data points was...
PUM
| Property | Measurement | Unit |
|---|---|---|
| temperature | aaaaa | aaaaa |
| refractive index | aaaaa | aaaaa |
| temperature | aaaaa | aaaaa |
Abstract
Description
Claims
Application Information
 - R&D
- Intellectual Property
- Life Sciences
- Materials
- Tech Scout
- Unparalleled Data Quality
- Higher Quality Content
- 60% Fewer Hallucinations
Browse by: Latest US Patents, China's latest patents, Technical Efficacy Thesaurus, Application Domain, Technology Topic, Popular Technical Reports.
© 2025 PatSnap. All rights reserved.Legal|Privacy policy|Modern Slavery Act Transparency Statement|Sitemap|About US| Contact US: help@patsnap.com


