Process and apparatus for segregation and testing by spectral analysis of solid deposits derived from liquid mixtures

a technology of liquid mixture and process, applied in the direction of spectrometry/spectrophotometry/monochromator, optical radiation measurement, instruments, etc., can solve the problems of raman scattering from biological compounds that are present at much lower concentrations, raman scattering from solvents containing buffering agents can overwhelm the normal raman scattering of biological compounds, etc., to achieve the effect of facilitating concentration or agglomeration, removing fluorescence effectively, and facilitating

Inactive Publication Date: 2005-12-15
PURDUE RES FOUND INC
View PDF9 Cites 31 Cited by
  • Summary
  • Abstract
  • Description
  • Claims
  • Application Information

AI Technical Summary

Benefits of technology

[0010] Except possibly in the case of a naturally solvophobic metal, a solvophobic enhancement layer, having a thickness of less than about 100 nm and preferably having a thickness of less than about one-quarter the wavelength of the radiation of interest, is added to cover the substrate surface to inhibit spreading of a specimen liquid to an undesirable extent. The solvophobic enhancement layer can be formed, for example, from a fluorinated polymer, a fluorinated hydrocarbon, or a thiol derivative of a hydrocarbon. A self-assembled organic monolayer (SAM) particularly suitable for use on gold can be formed from alkyl chains with terminal thiol groups that bind to the gold surface. While SAMs are generally not as stable or robust as polymeric coatings, the solvo-phobic character of the alkyl chains can be manipulated by suitable selection of organic residues. The coated substrate sample supports have an advantage of also being solvo-phobic to many polar solvents, thus limiting or controlling the spread of a deposited drop.
[0012] Following the deposit of the micro-droplet on the selected sample support, the solvent can be evaporated from the micro-droplet under conditions that promote accumulation of the target analyte and the buffer or other compounds as spatially separated precipitates. It has been observed that deposits of biological polymers and oligomers including proteins, peptides, nucleotides, and other less soluble molecular analytes from a drop of liquid placed on a non-wetting substrate often accumulate in a circular ring formed during the evaporation process. This ring forming effect, sometimes referred to as the “coffee-ring” effect, localizes the deposited analyte and thus facilitates additional detection. Generally, the larger, less soluble components tend to precipitate near the edges of the deposit, while buffers and other more soluble compounds are distributed throughout the deposit region and more concentrated toward a central portion of the deposit. This analyte segregation method can also be used advantageously to segregate different analyte components in a mixture, such as compounds of different chemical composition and / or structure and thus facilitate the analysis of each separate component. The evaporation conditions required for optimal segregation can include temperature and other parameters that influence evaporation rate, such as the control of vapor phase convection of the solvent during the evaporation process. While the efficiency of this segregation process can in general depend on a number of variables, the process is generally applicable to biological compounds when using one of the previously identified substrates and evaporating in ambient or desiccated air at normal room temperature. This method can also be applied at other lower or higher temperatures under various atmospheric conditions. Potential advantages of various conditions include higher evaporation speed (such as at higher temperature) or improved segregation of differrent components (such as in higher solvent vapor pressure atmosphere). In some applications, high temperatures that might lead to degradation or denaturation of the biological compounds are to be avoided. This physical separation can be achieved by depositing a micro-droplet of solution, typically between 10 nl and 10 μl on a selected substrate. The total time required for deposition and solvent evaporation at normal room temperature is typically about 10 minutes for μl depositions and only about 1 minute for nl depositions, which is roughly comparable to the time required for normal Raman signal collection.
[0014] The spectral data can then analyzed using a variety of numerical techniques intended to enhance the ability to detect a given molecule of interest. One technique involves using a Savistky-Golay second derivative algorithm to supress both broadband background and pixel noise while retaining the desired Raman spectral features. Another technique involves normalizing the output of the second derivative algorithim in order to suppress intensity variations that can occur due to drifts in laser power or optical alignment, changes in the number of analyte molecules within the optical collection region, or other effects unrelated to analyte chemistry. Another technique involves classifying the previously processed spectra with a partial least square discriminant program to cluster specimens having common contents together. Yet another technique involves plotting the pseudo probabilities of various classified spectra belonging to a given group, which again clusters specimens having common characteristics together. Still another technique involves subtracting the normalized spectral outputs of two specimens to detect any spectral differences indicating differences in the specimen contents.
[0015] A key advantageous feature of the analyte segregation method of the present invention is that the method facilitates the concentration or agglomeration of analytes of interest in essentially pure solid form at surface densities compatible with normal Raman detection and IR spectroscopy without any interference from buffer or other compounds that may be originally present in a deposited micro-drop in a 100-fold or greater excess thus facilitating the measurement of normal Raman and other spectra. The entire deposition and spectral data collection process can be performed in only a few minutes. This method can also be used to very effectively remove fluorescence, buffer and other contaminant introduced interferences from normal Raman spectra. The procedure can be used to segregate and identify proteins and other organic polymers and oligomers dispersed at μM concentration levels in liquids that also contain inorganic or organic buffer compounds and other contaminants at mM concentration.

Problems solved by technology

However, since Raman scattering has a much lower cross-section than fluorescence, normal Raman spectral features can be easily obscured by even trace quantities of fluorescent impurities.
Furthermore, Raman scattering from solvents containing buffering agents can overwhelm the normal Raman scattering from biological compounds that are present at much lower concentrations.
Various methods have previously been used to combat fluorescence background interference, none of which are universally applicable.
A less sophisticated, but often quite effective, method for reducing fluorescence is photo-bleaching of the fluorescent compounds by prolonged exposure to the Raman excitation laser.
However, since efficient quenching requires direct contact with the conductive solid substrate, this method is only applicable to monolayer structures.
An additional limitation of RR is the optical damage induced by heating and / or photochemistry.
Key limitations of SERS include the generation of spurious background signals, optical damage susceptibility and often poor reproducibility, both in terms of absolute intensity and spectral shape.
However, accurate quantification remains a significant challenge and ambiguities can exist in the analysis of biological and organic analytes of different structure but equal mass.

Method used


Image

  • Process and apparatus for segregation and testing by spectral analysis of solid deposits derived from liquid mixtures
  • Process and apparatus for segregation and testing by spectral analysis of solid deposits derived from liquid mixtures
  • Process and apparatus for segregation and testing by spectral analysis of solid deposits derived from liquid mixtures

Examples


example set a

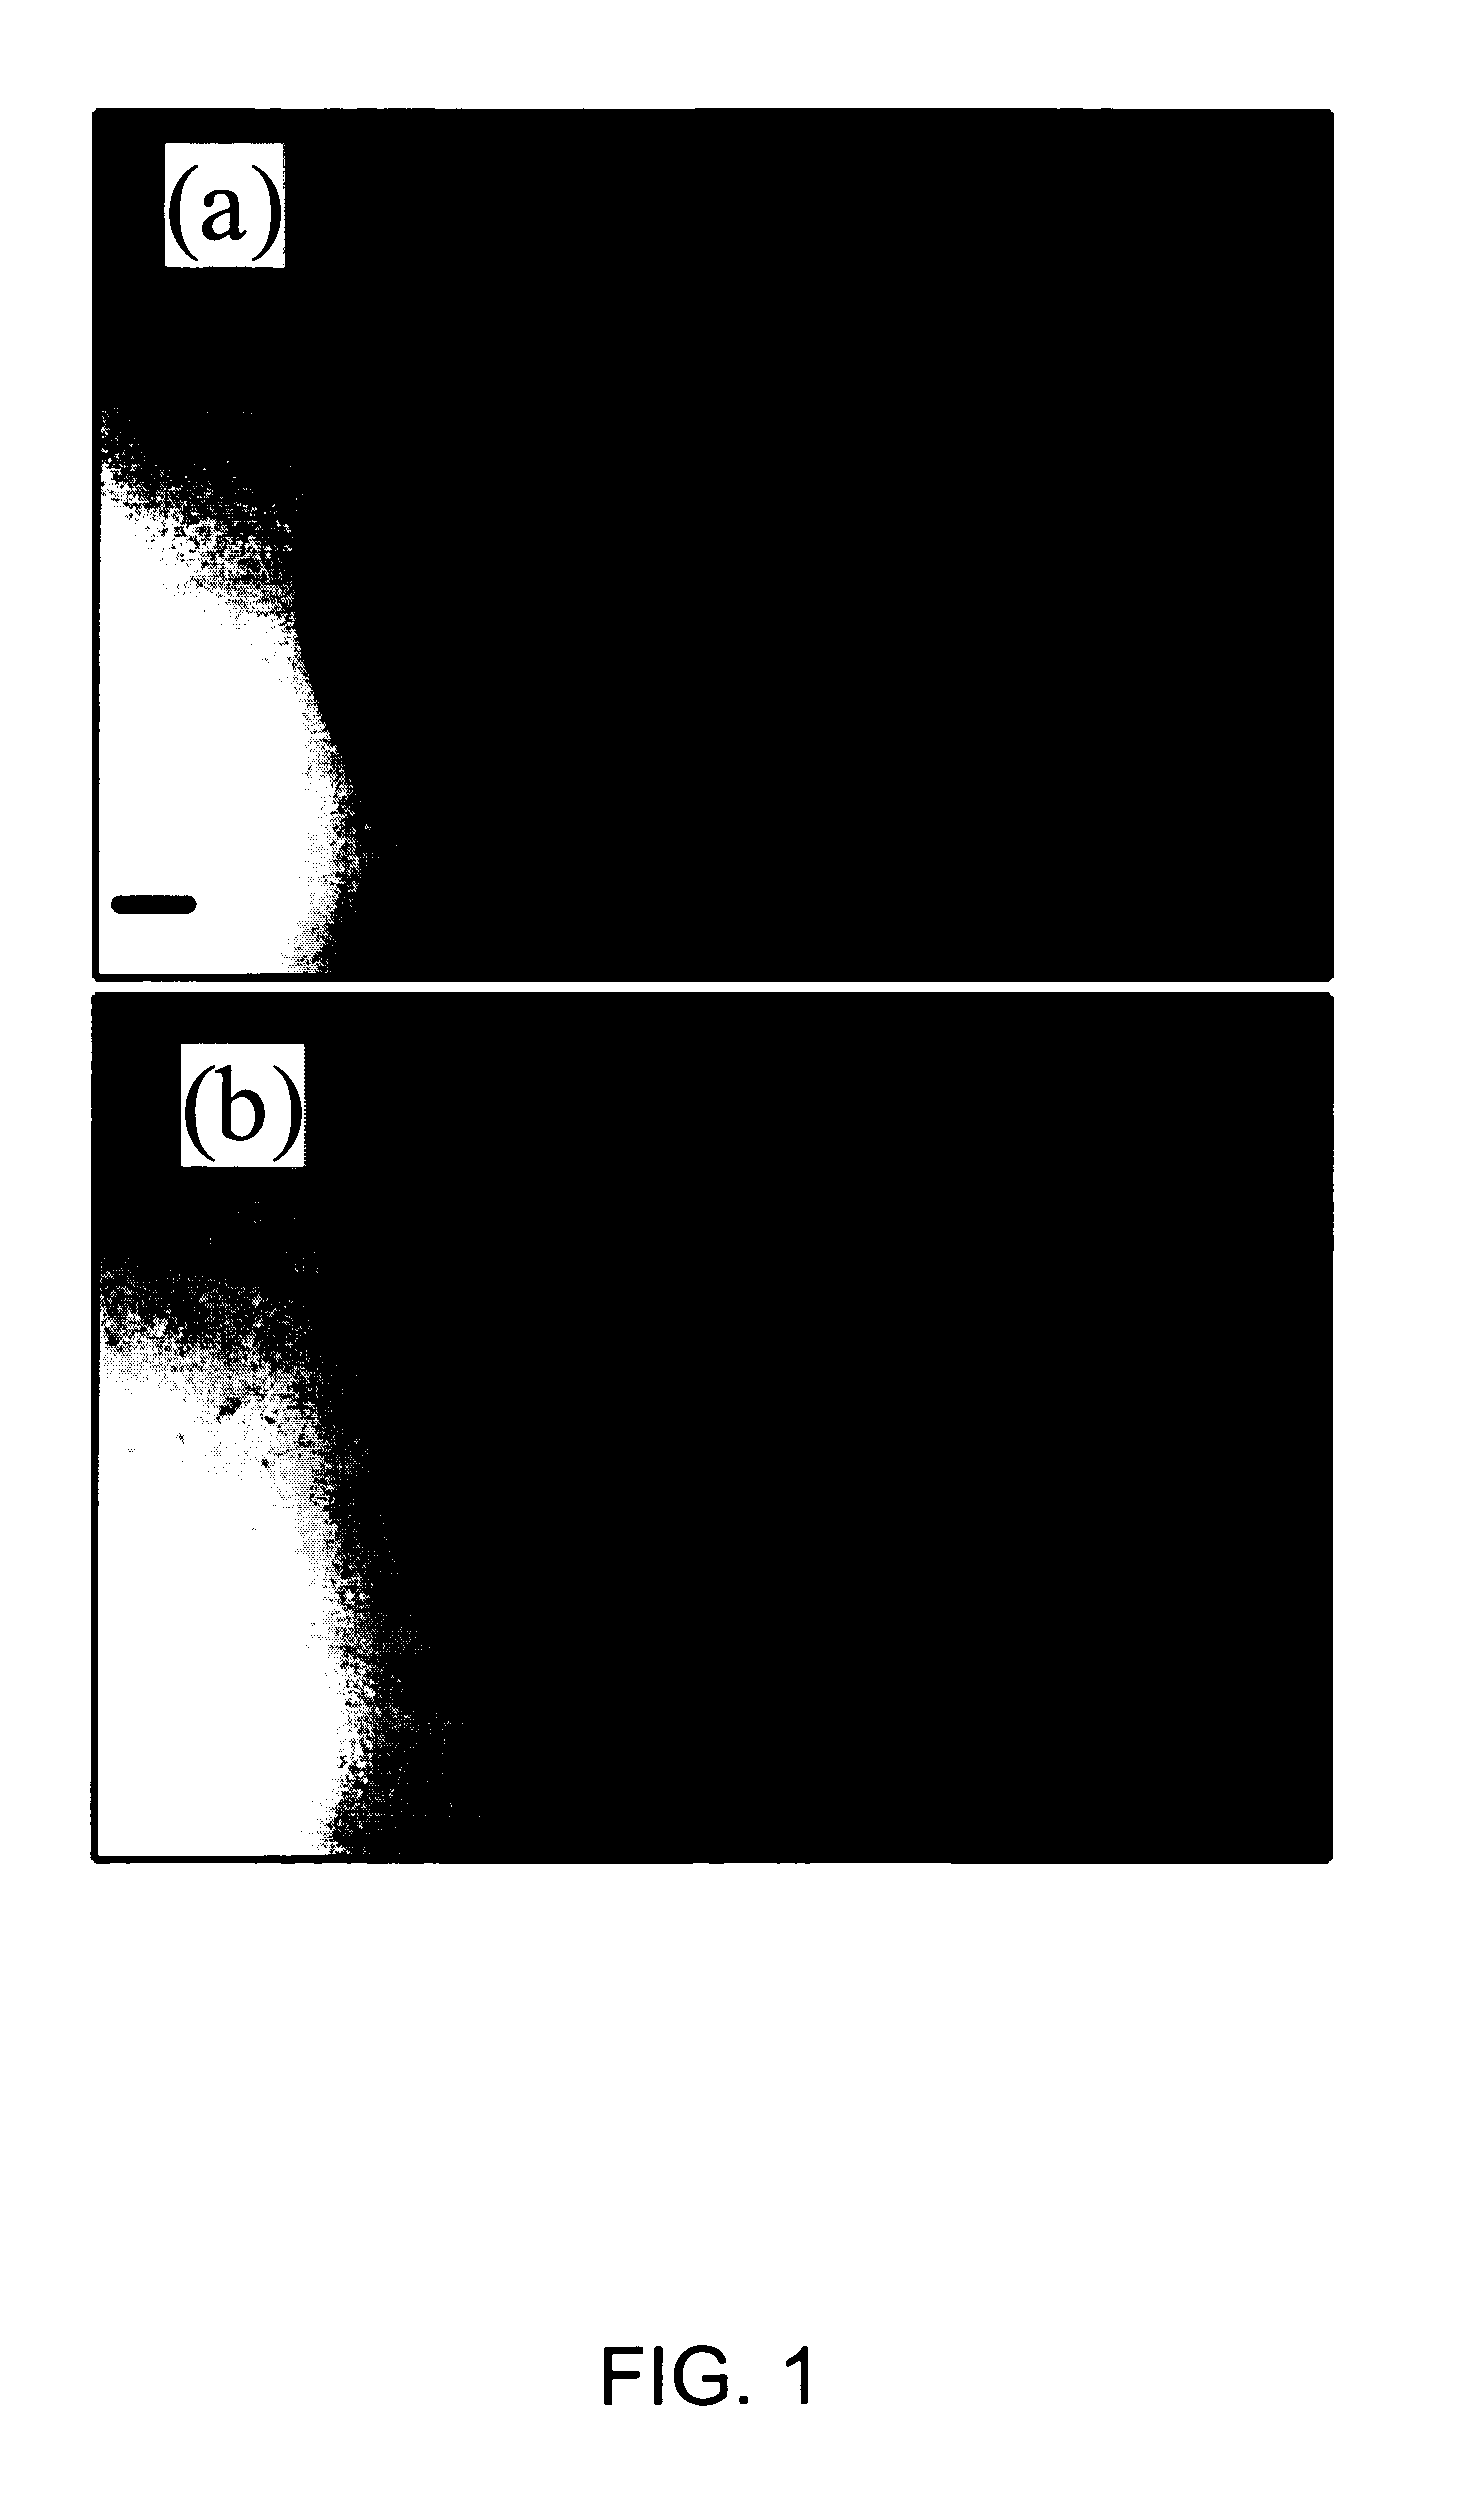
[0065] For the first example of the methods of the present invention that also demonstrates a significant reduction in undesirable fluorescence background, O-phospho-L-serine (Cat. No. P-0878, Lot 21K1389, Purity of 99%), myoglobin (Cat. No. M-0630, Lot 110K7034, Purity of 95-100%) and lysozyme (From chicken egg white) were obtained from Sigma. Synthetic human insulin (Humulin®) was provided by Eli Lilly & Co. High purity water (18.2 MΩcm−1) generated with MilliQ plus system (Millipore) was used to prepare a saturated O-phospho-L-serine (˜10 mM) and 60 μM myoglobin solution. 4 μL droplets of saturated O-phospho-L-serine and 60 μM myoglobin are deposited and dried on a substrate of polished stainless steel coated with 50 nm of PTFE. FIG. 1 shows the morphologies of the O-phospho-L-serine (a) and myoglobin (b) on the sample support after solvent evaporation. Both images are of the same size, the bar in image (a) represents 50 μm. Although the deposited volume is the same for both samp...

example set b

[0075] For this example demonstrating the high level of analyte discrimination that can be achieved using the methods of the present invention, four peptides were synthetically prepared that have the same amino acid sequence, and differ only in the site of phosphorylation. These four peptides have the same sequence found at the carbonyl terminus (residues 521-533) of the pp60c-src protein tyrosine kinase. When phosphorylated at Tyr-527, this fragment will suppress pp60c-src activity by binding, either inter- or intra-molecularly, to the SH2 domain of pp60c-src. The peptides used in this work were synthesized either in non-phosphorylated form, nP, or phosphorylated at one of three different residues, Ser-522, (sP), Thr-523, (tP), and Tyr-527, (yP), as described in Table 1, which also contains the abbreviated notations used in this example to designate each peptide.

TABLE 1Peptide sequence, phosphorylation site, and short-hand notation.Peptide sequenceNotationH2N-Thr-Ser-Thr-Glu-Pro-...

example set c

[0080] The present example set demonstrates that the present invention can be used to detect and quantify Tyr phosphorylation in tryptic digests of physiologically important proteins. While the peptides used in this example set are produced synthetically, three of them have the same sequence as peptides obtained by tryptic digest of p60c-src, with phosphorylation sites at Y-216, Y-419 and Y-530, respectively, as shown in the sequence in FIG. 11A. The fourth peptide is a shorter variant of the above Y-530 containing peptide. The peptides have varying lengths of between 11 and 32 residues and some contain both Tyr and Phe aromatic residues while others contain multiple Tyr residues. Although the four peptides have quite different Raman spectra, tyrosine phosphorylation induces similar spectral changes in all of the peptides. Furthermore, the present example shows that with the help of a partial least squares PLS multivariate calibration algorithm, the present invention can be used to ...


PUM

PropertyMeasurementUnit
thicknessaaaaaaaaaa
thicknessaaaaaaaaaa
volumeaaaaaaaaaa

Abstract

Micro-droplets of liquid confining organic molecules of interest are dried on selected planar solvo-phobic substrates under conditions facilitating segregated precipitation of the larger, less soluable analytes toward edge portions of the deposit. Micro-spectrometer imaging using white light and FTIR false color can identify points of interest, and the same optics generally directed perpendicularly to the substrates selectively captures normal Raman spectra from selected points in the deposit. The spectra are manipulated using various data techniques to extract reliable information concerning analytes present at pico-Molar levels. The selected spots can also be subjected to FTIR spectroscopy followed by MALDI mass spectroscopy to obtain a variety of information from the identical specimen.

Description

CROSS-REFERENCE TO RELATED APPLICATIONS [0001] This application is based on and claims benefit to U.S. provisional application 60 / 462,083 and 60 / 462,472, both filed on Apr. 11, 2003, 60 / 490,057 filed Jul. 25, 2003, 60 / 554,701 filed Mar. 4, 2004, and 60 / 551,311 filed Mar. 8, 2004.BACKGROUND [0002] This invention pertains to the combined use of solid substrates, micro-deposition techniques, spectral imaging methods, and data processing to facilitate the concentration and separate detection of biological polymers, oligomers, and monomers including proteins, peptides, polysaccharides, glycans, nucleotides, and other analytes including smaller molecules, impurities and buffers, in a liquid mixture, using spectral analysis such as normal Raman spectroscopy, infrared spectroscopy and matrix-assisted laser desorption / ionization (MALDI) time-of-flight mass spectrometry. The term “normal Raman” is specifically adopted to distinguish the spectral imaging methods that are preferred for use in t...

Claims


Application Information

Patent Timeline
Patent Type & Authority Applications(United States)
IPC IPC(8): G01N21/65
CPCB82Y30/00G01N21/3563G01N2021/3595G01N2001/4027G01N21/658
Inventor ZHANG, DONGMAOBEN-AMOTZ, DORXIE, YONGDAVISSON, VINCENTMROZEK, MELISSAORTIZ, CORASI
Owner PURDUE RES FOUND INC
Why Eureka
Try Eureka