[0013]With this invention, a labeling
reagent is used that has a distinct SERS or SERRS
spectral signature. Such labeling can be done in such a way as not to have any detectable differential effect on separation retention or the
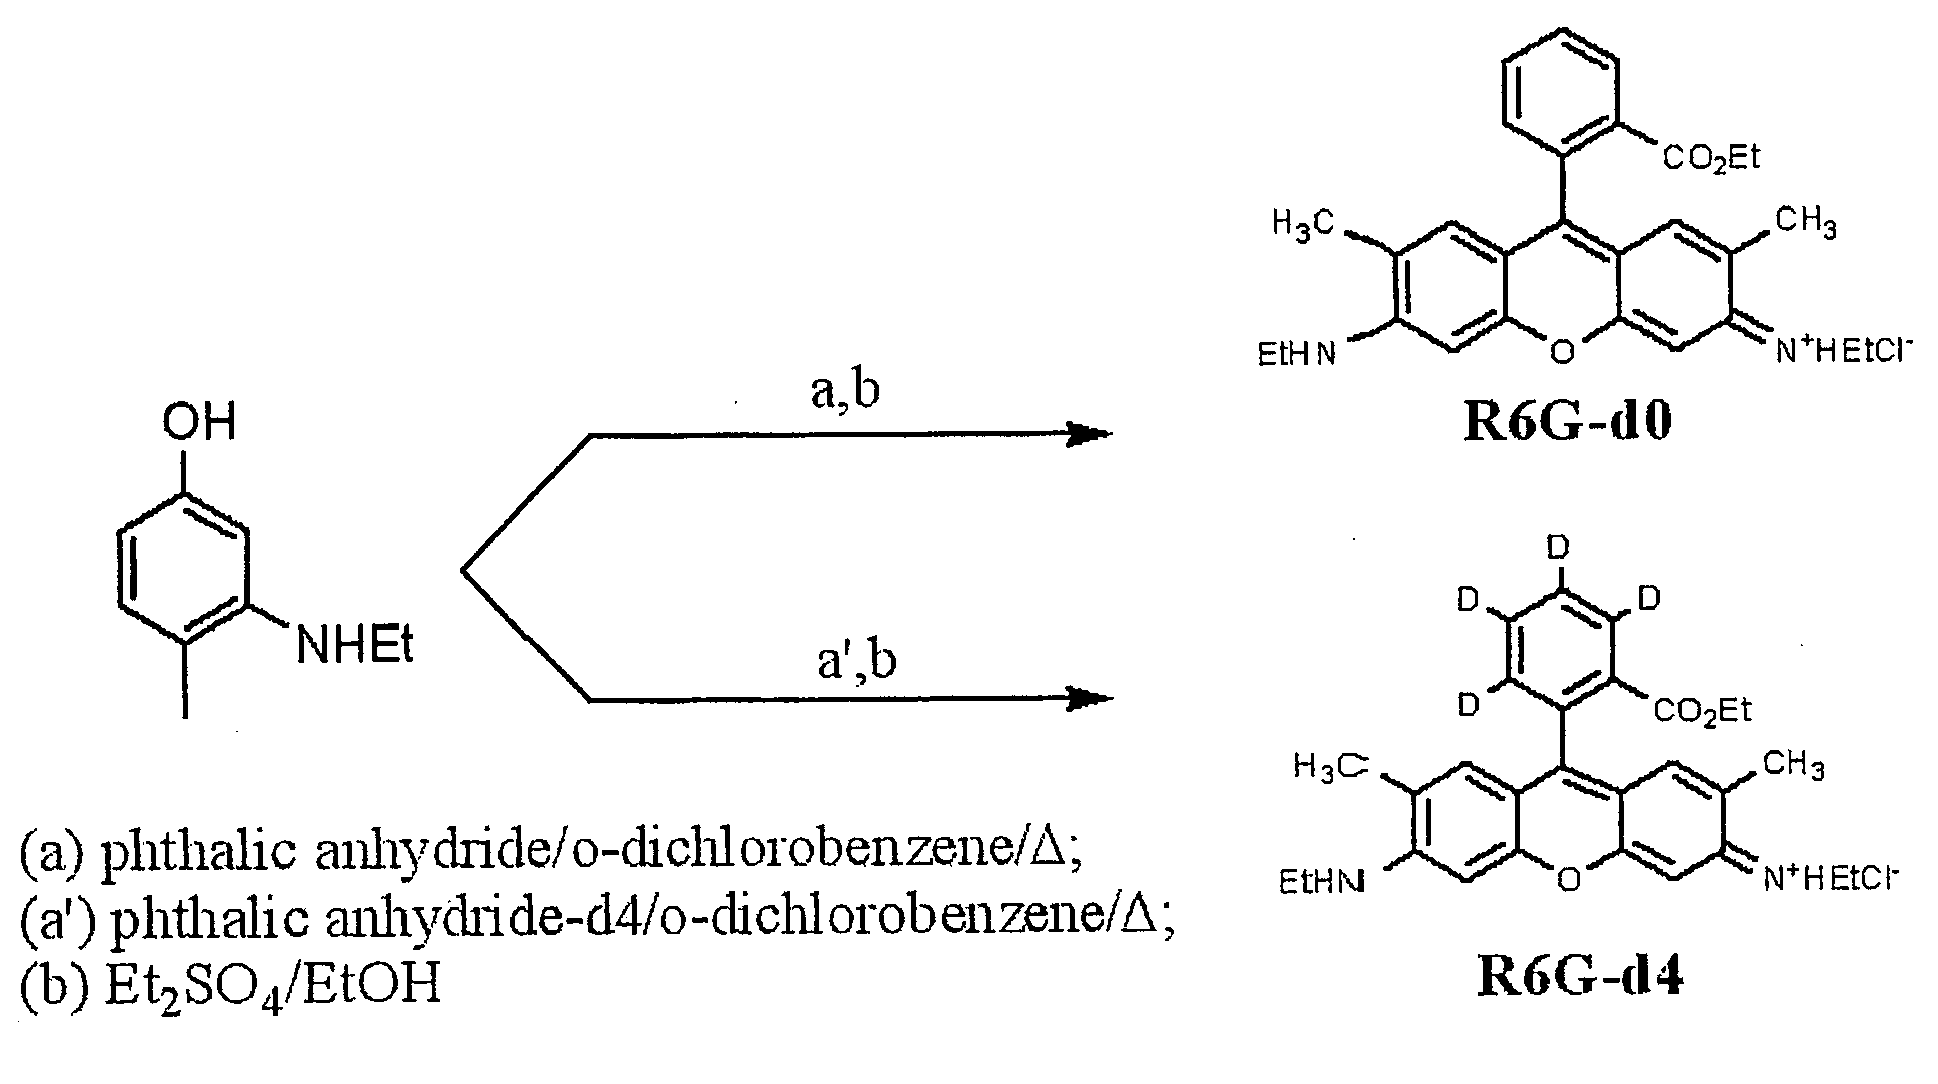
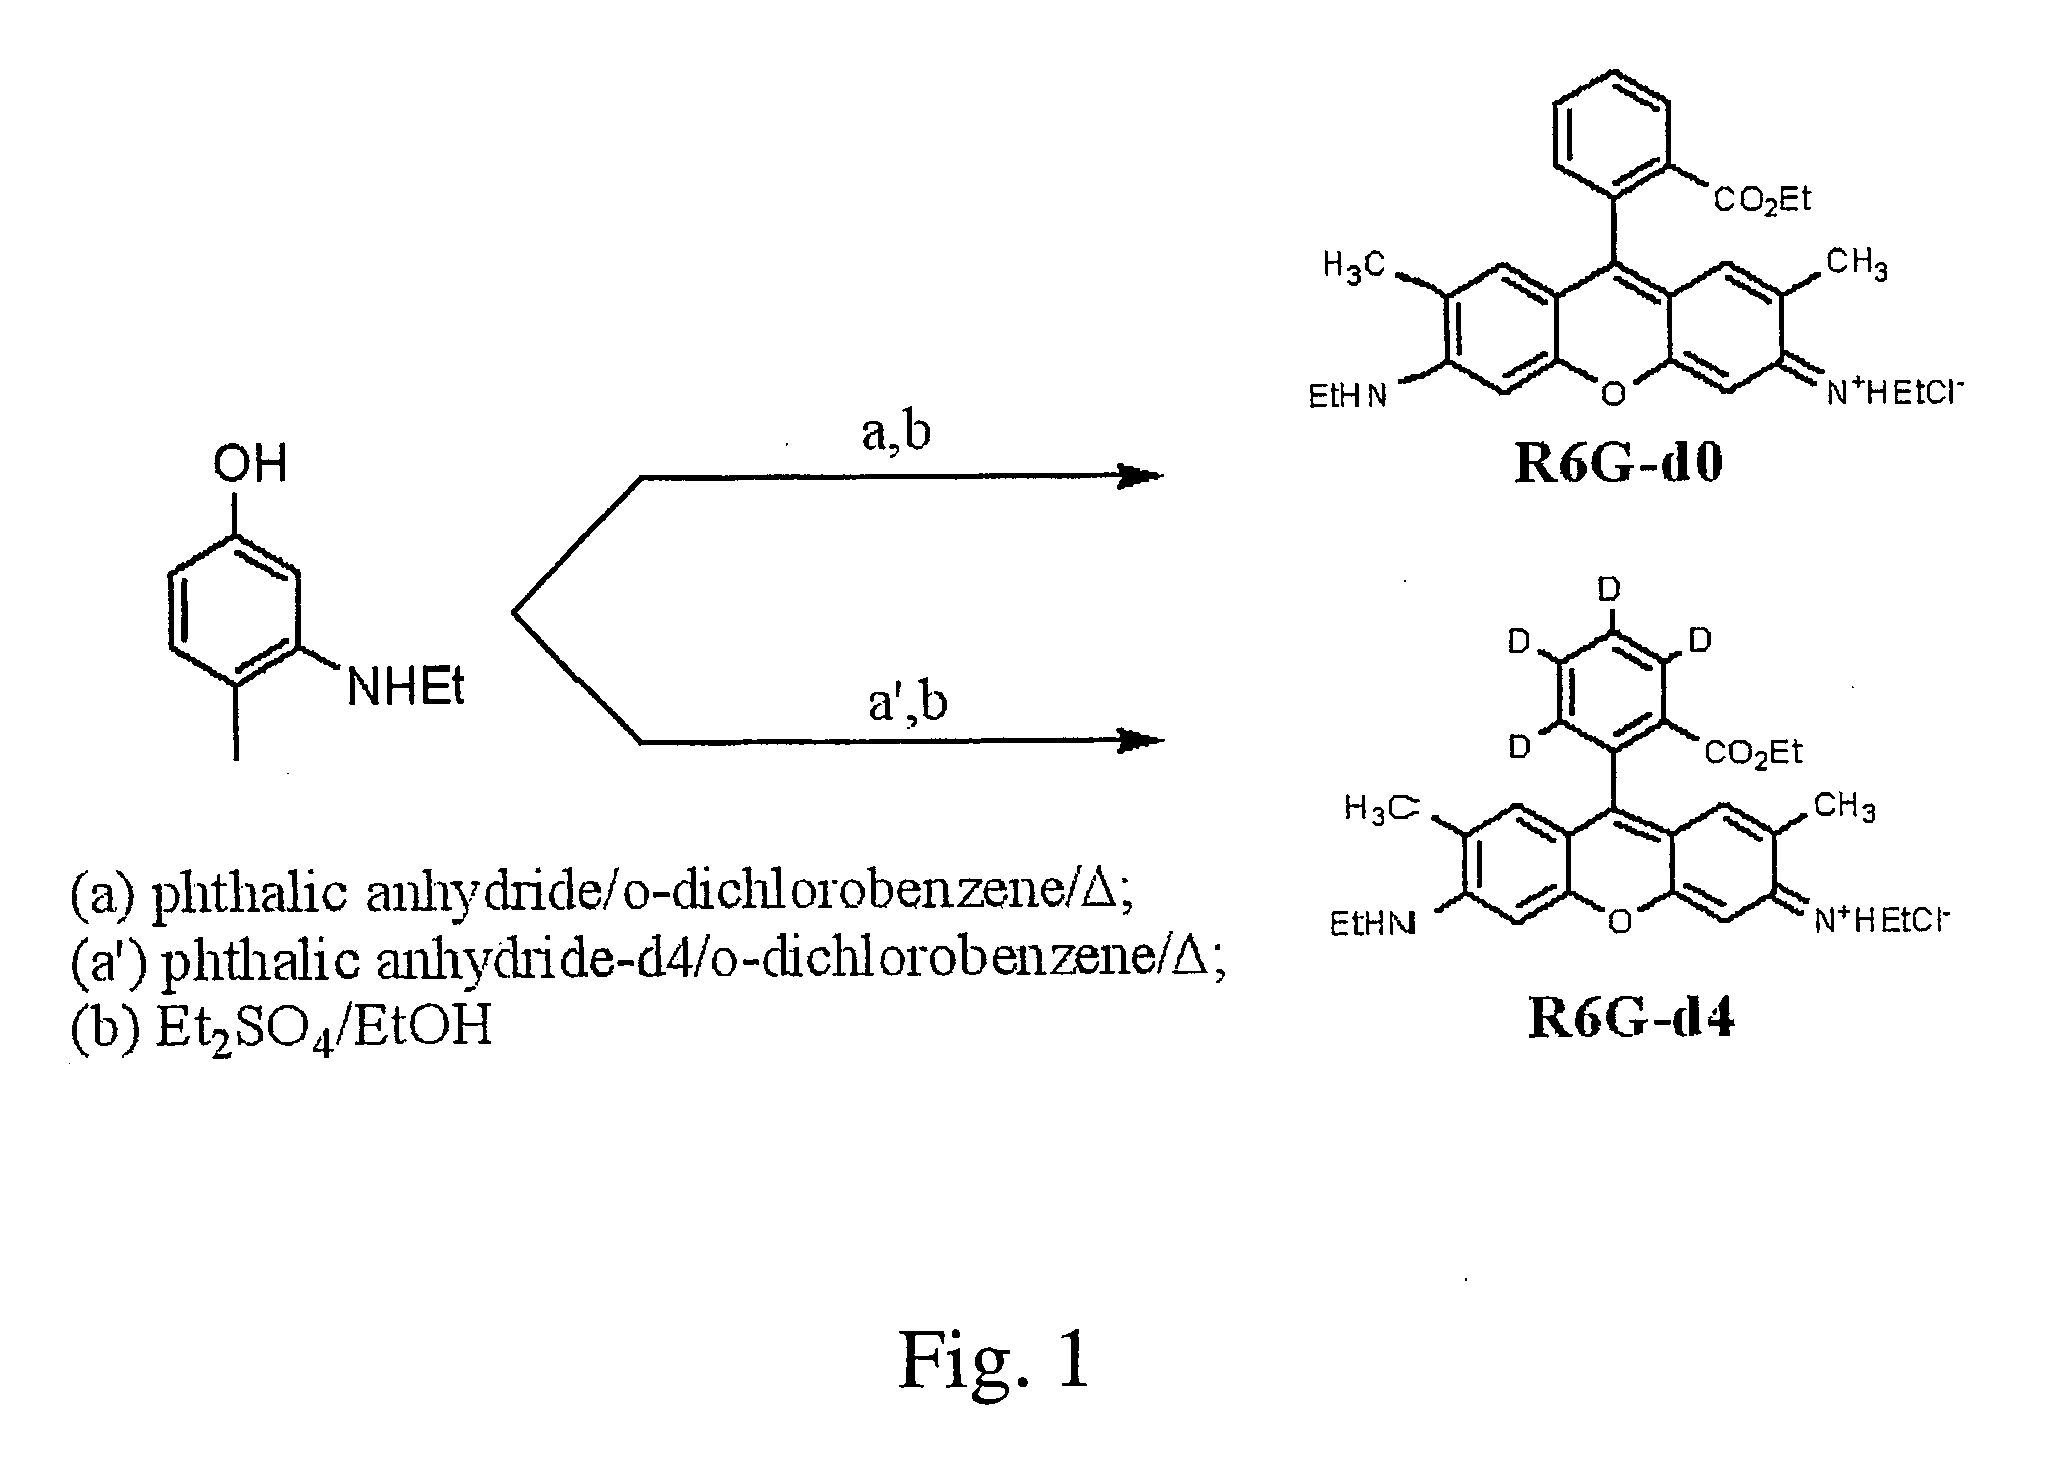
binding affinities of the analytes of interest. The labeling reagents used for this invention can be, for example, dyes with different isotopic substituents, such as the substitution of some
hydrogen atoms for
deuterium atoms. Other isotopic substitutions may achieve sufficiently distinctive SERS or SERRS spectra. The substitution can be employed in such SERS or SERRS active dyes such as
xanthene dyes like
Rhodamine and
Fluorescein, triarylmethane dyes like Cresyl Violet, azo dyes like
Benzotriazole azo, mercaptopyridine, and others. The isotopic variants of these and other dyes can be obtained through the use of isotopically substituted precursors that are then used during the dye-forming
condensation reaction. The isotopic variants may also be obtained by isotopic exchange of the labile aromatic protons of the
chromophore by heating the dye in a deuterated acidic media.
[0015]Some differences between the present invention and previous methods are (1) the type isotopic labels used, (2) the detection method used, (3) the special characteristics of the labeling dyes used, (4) the improved separation retention characteristics obtained, (5) the more efficient
data analysis scheme enabled, (6) and the
multiplexing capability permitting multiple samples to be analyzed. In one example, the
protein pairs refer to the same
protein from the control and analysis samples, and the analysis samples can be multiple as demonstrated in point (6). In addition to the capability of top-down analysis, the current approach enables bottom-up
proteomics approach in which proteins are analyzed without
digestion. In another example, the labeling reagents for genes from different samples differ only in isotopic substitutions. Thus the incorporation bias is minimized, which enables more accurate comparative quantification of genes from different samples.
[0016]These dye molecules may advantageously have an affinity to a SERS
active surface and thus have extremely high SERS or SERRS cross-section. In fact, the Raman
signal of the labeling reagents can be so strong that it dwarfs the spectral contribution from the proteins or peptides to which the labeling
reagent are bound. This fact can be advantageously be utilized for efficient data collection and analysis since the
signal of interest can be collected more rapidly with little or no interfering background signals. Furthermore, the Raman spectra can be obtained with directly coupled separation instruments. The relative quantities of the protein or
peptide pairs can be obtained by comparing the Raman signal from isotopic substitute labeling reagents present in the same
chromatographic separation fraction.
[0017]The chemical characteristics of the labeling reagents used for the present invention are generally the same, and so are their SERS or SERRS detection schemes and devices. The labeling reagents used for present invention can be dyes with strong
absorbance at visible wavelengths and high
quantum yield of fluorescence. The total concentration of the labeled dye molecules can be easily determined using standard UV-VIS absorption or fluorescence methods or with a SERS or SERRS signal. Thus, the relative quantification of the signals from different tags will be immune from most of the adverse factors mentioned with respect to other
label detection methods. Furthermore, since the complete SERS or SERRS spectra can be subjected to
data analysis, the interference from
background noise can be greatly reduced with advanced multivariate data analysis algorithms such as partial least square methods or neural networking methods. Thus, as demonstrated with the preliminary data, the quantification accuracy with this present invention is much higher than those obtained with previously employed methods.
[0018]For example, the SERS or SERRS signal derived from different labels can enable a determination of the relative ratio of proteins from control and experimental samples. Thus, with the current invention, the absolute quantity of proteins can be obtained once the stoichiometric relationship is known for the labeling reactions. Furthermore, with the current invention, the protein quantification can be done at the
protein level, thus the
relative mass difference is much smaller when the same absolute
mass difference is produced with
isotopic labeling, which in turn, will guarantee the
retention time difference be negligible for the protein pairs from the control and experimental sample.
[0019]In accordance with one aspect of the current invention, the detected signal from the separated protein pairs are from the isotopic substituted labeling reagent (ISLR) pairs, not from the proteins being labeled. Thus, once the analysis scheme is derived for one pair of the proteins, it is applicable universally for all the proteins samples labeled with same ISLRs. As a further example, the detected signal from the separated cDNA pairs are again from the ISLR pairs, not from the genes being labeled. Thus, once the analysis scheme is derived for one
gene expression, it is applicable universally for all the genes labeled with same ISLRs. With present invention, multiple samples can be analyzed by performing isotopic substitution at different positions or on functional groups with the same labeling reagents, and the different ISLRs of the same labeling reagents can be of the same mass or slightly different masses. Thus, with current invention, multiple samples can be analyzed without the concern of difference in the separation
retention time and the difficulties of the data analysis. This invention can be much more sensitive than the detection methods used in the prior art since the SERS or SERRS spectra of the dye can be easily obtained with concentration <10 pM with a
sample volume of <1 uL in the
solution phase. It also has greater
dynamic range since that high quality spectra have been obtained with concentration up to 10 uM as shown in the Description of Illustrative Examples.

