Frequency encoding of resonant mass sensors

a technology of resonant mass and frequency encoding, which is applied in the direction of vibration measurement in solids, instruments, and fluid analysis using sonic/ultrasonic/infrasonic waves, etc. it can solve the problems of prohibitive hardware cost, slow detection of the array, and all the technical challenges of cross-reactive sensor arrays described previously, etc., to achieve high q-value, high stability, and sufficient ring time

Inactive Publication Date: 2005-01-27
PALO ALTO SENSOR TECH INNOVATION
View PDF29 Cites 336 Cited by
  • Summary
  • Abstract
  • Description
  • Claims
  • Application Information

AI Technical Summary

Benefits of technology

A significant advantage of the invention is that the sensor elements of an encoded array may be combined into an array with a single excitation and detection channel. This is in contrast to most previous uses of resonant mass sensor elements as sensor arrays, where a typical configuration requires individual excitation and / or data acquisition channels for each sensor element, involving slow detection, expensive and complex detection hardware and software, and signal switching systems to focus excitation and / or data acquisition on a specific sensor element. In a typical sensor or sensor array of the invention where the elements have sufficient ring time and high stability, pulsed excitation of the array followed by acquisition of time-domain resonant signal from the array may be possible. This is analogous to common pulsed 1H FTNMR techniques in which a broad excitation pulse is applied, followed by acquisition of time-domain free induction decay signal of all resonant species in the sample. Typically, a single channel for excitation drives resonance of all sensor elements, and a single data acquisition channel carries the output data stream for all of the sensors. In some cases, the input and output channels are identical.
Due to the high Q-value and high stability of piezoelectric tuning forks such as quartz tuning forks, an attractive excitation / detection mode is the pulsed excitation of the entire frequency encoded array followed by acquisition of time domain data from the free oscillatory decay (i.e., the ringing) of the entire encoded array (See FIGS. 4-5). While many excitation waveforms can be used, a particularly preferred embodiment of the method is the application of a SWIFT (Stored Wave Inverse Fourier Transform) waveform. (Guan and Marshall, 1996) SWIFT excitation can offer significant advantages over other excitation methods, such as frequency sweep or chirp excitation. As shown in FIG. 3, a typical encoded tuning fork sensor array is formed by connecting N sensors in parallel. Such sensor configuration works well at low resonant frequency and for devices having low shunt capacitance, as in the case for tuning forks. In this case, high-q or well-localized mechanical equivalent circuit dominates the electronic behavior and little cross-talk results.
In a typical sensor or sensor array of the invention where the pulsed excitation / detection method is difficult to realize because of short free oscillation decay times or because short and high amplitude excitation pulses are required, a rapid scan Fourier transform method in a direct or heterodyne configuration is generally more appropriate. FIG. 15A-15C show three options for connecting various sensor elements of an encoded TSM sensor array. The rapid scan approach retains simplicity of hardware with a common detection channel, while preserving near simultaneous detection of each sensor element. For higher frequency devices, including SAW and TSM arrays, matching networks are typically required to reduce shunt capacitance. The excitation source is connected to one end of the sensor array and the other end is connected to the electrical ground through a resistor and to the acquisition preamplifier. In an ideal situation, the output impedance of the excitation amplifier should be infinitely small and the input impedance of the preamplifier should be infinitely large.
A typical TSM device resonates at several to tens of megahertz (MHz) (say, 10 MHz) and a typical frequency shift due to situated absorption of chemical vapors on a 2-micron polymer film is about ten kilohertz (kHz). For a 10-sensor element array, the detection frequency range is on the order of hundreds of kHz (say 200 kHz). With the limited bandwidth of the array resonance, it is not necessary to provide high-frequency data acquisition hardware that can digitize data in a direct mode at above twice of the resonant frequency of the sensor with the highest resonant frequency in the array, in this example requiring greater than about 20 MHz sampling rate. Rather, one can digitize data in a heterodyne mode with a reference frequency close to the resonant frequencies of the array sensor elements. This mode requires simpler and less expensive data acquisition hardware, with a maximum sampling or digitizing rate only twice that of the detection frequency range (i.e., 400 kHz). A block diagram of an analog circuit to enable this heterodyne detection system for a frequency encoded TSM sensor array is shown in FIG. 14. For example, a local oscillator based on a 9.9 MHz TSM device is used, prepared from a virgin 10.000 MHz device by the frequency encoding method described above. The local oscillation signal runs through a bandpass filter to clean up higher harmonics and low frequency noises before being split into two equal level sources. One source is fed into a double balanced modulator whose modulation source is the excitation signal generated by a computer DAQ system. Ideally, a single-side band (SSB) I&Q modulator should be used for frequency mixing. The modulated signal is amplified before being fed to one port of the sensor array lumped as a two-port device. The other port is connected to a demodulator together with the other reference source. The demodulated signal is subjected to a low pass filter and is then digitized.
Precise characterization and impedance matching of a TSM resonator is an involved engineering task. A review in the field can be found in (Gerber, 1985). For the purpose of sensor array applications, generally the most important quantity to be measured is the resonant peak position (and hence the frequency shift due to analyte interaction) of each sensor element. For a low frequency tuning fork based sensor array, a large number of sensors can be connected in parallel to form a two-port equivalent device as shown in FIG. 15A This can be done since resonant frequencies for a typical tuning fork is quite low (i.e., around 20-40 kHz) and admittance by the shunt capacitance (C0 in the equivalent circuit in FIG. 16) is quite small (Y0=iωC0). Due to the device element's small size, the shunt capacitance itself is also small. Signal shortage for both excitation and detection by the n parallel-connected shunt capacitance can be neglected. This effect cannot be neglected in the case of a TSM sensor array. First, the shunt capacitance for a typical TSM sensor is quite large due to its large electrode area. Its frequency is about three orders of magnitude higher. Therefore the direct parallel connection as shown in FIG. 15A may no longer practical. For a sensor array with a limited number of elements, a serial connect shown in FIG. 15B can be used. To more evenly distribute excitation power to each element, a capacitive ladder can be used (FIG. 15C).
After polymer coating, a typical quality factor of the frequency encoded TSM sensor element is about 10,000 in air. At a resonant frequency of 10 MHz, the free oscillation decay can only last a few milliseconds. It is possible to excite the mechanical oscillation and detect its free-excitation decay or free oscillation decay (FOD) before it decays into the noise level. However, this requires a short excitation period and therefore high excitation amplitude. The higher level excitation electronics will produce higher noise leakage into detection channel. A more economical and efficient method is application of longer (but still quite short compared to conventional frequency scanning) excitation waveform while detecting the signal simultaneously. The method is called rapid scan Fourier transform or correlation spectroscopy.

Problems solved by technology

As an emerging area, all of these types of cross-reactive sensor arrays suffer from significant technical challenges.
However, the resonant sensor arrays described previously suffer from prohibitive hardware cost associated with multichannel excitation and detection, and / or performance issues associated with frequency scanning and slow, non-simultaneous signal acquisition.
All of the previously described methods and devices for acquiring signal from resonant sensor arrays generally require either (1) complex hardware with independent data acquisition channels for each sensor in the array, or (2) suffer from slow detection of the array, often with serial detection of each element of the array, using a single data acquisition channel and signal switching systems, requiring long measurement times and lacking simultaneous detection of each array element.
As a result, many potential applications of such sensor arrays cannot be realized because of prohibitive cost, deficient performance, or both.
However, no general methods have been described that allow for rapid, inexpensive, high-quality data acquisition from arrays of resonant or acoustic sensors, particularly for large arrays used for applications such as “electronic nose” sensors, combinatorial chemistry applications, or industrial process control.

Method used


Image

  • Frequency encoding of resonant mass sensors
  • Frequency encoding of resonant mass sensors
  • Frequency encoding of resonant mass sensors

Examples


example 1

Fabrication of a Two-element Frequency Encoded Tuning Fork Sensor Array

Resonant frequencies of two commercial tuning forks were measured in air without coatings by the method described below. One device was coated with paraffing wax by dipping a tuning fork in a 5% wax solution in acetone, without frequency trimming. The tines of the other device were shortened by grinding on a diamond cutting wheel to increase the resonant frequency. After its resonant frequency was measured, the device was coated with PDMS by dipping into an approximately 5% PDMS solution in toluene. The PDMS solution was prepared by mixing 10:1 silicone elastomer base:curing agent in weight, and then adding 95% weight of toluene. The sensors were allowed to dry in air overnight.

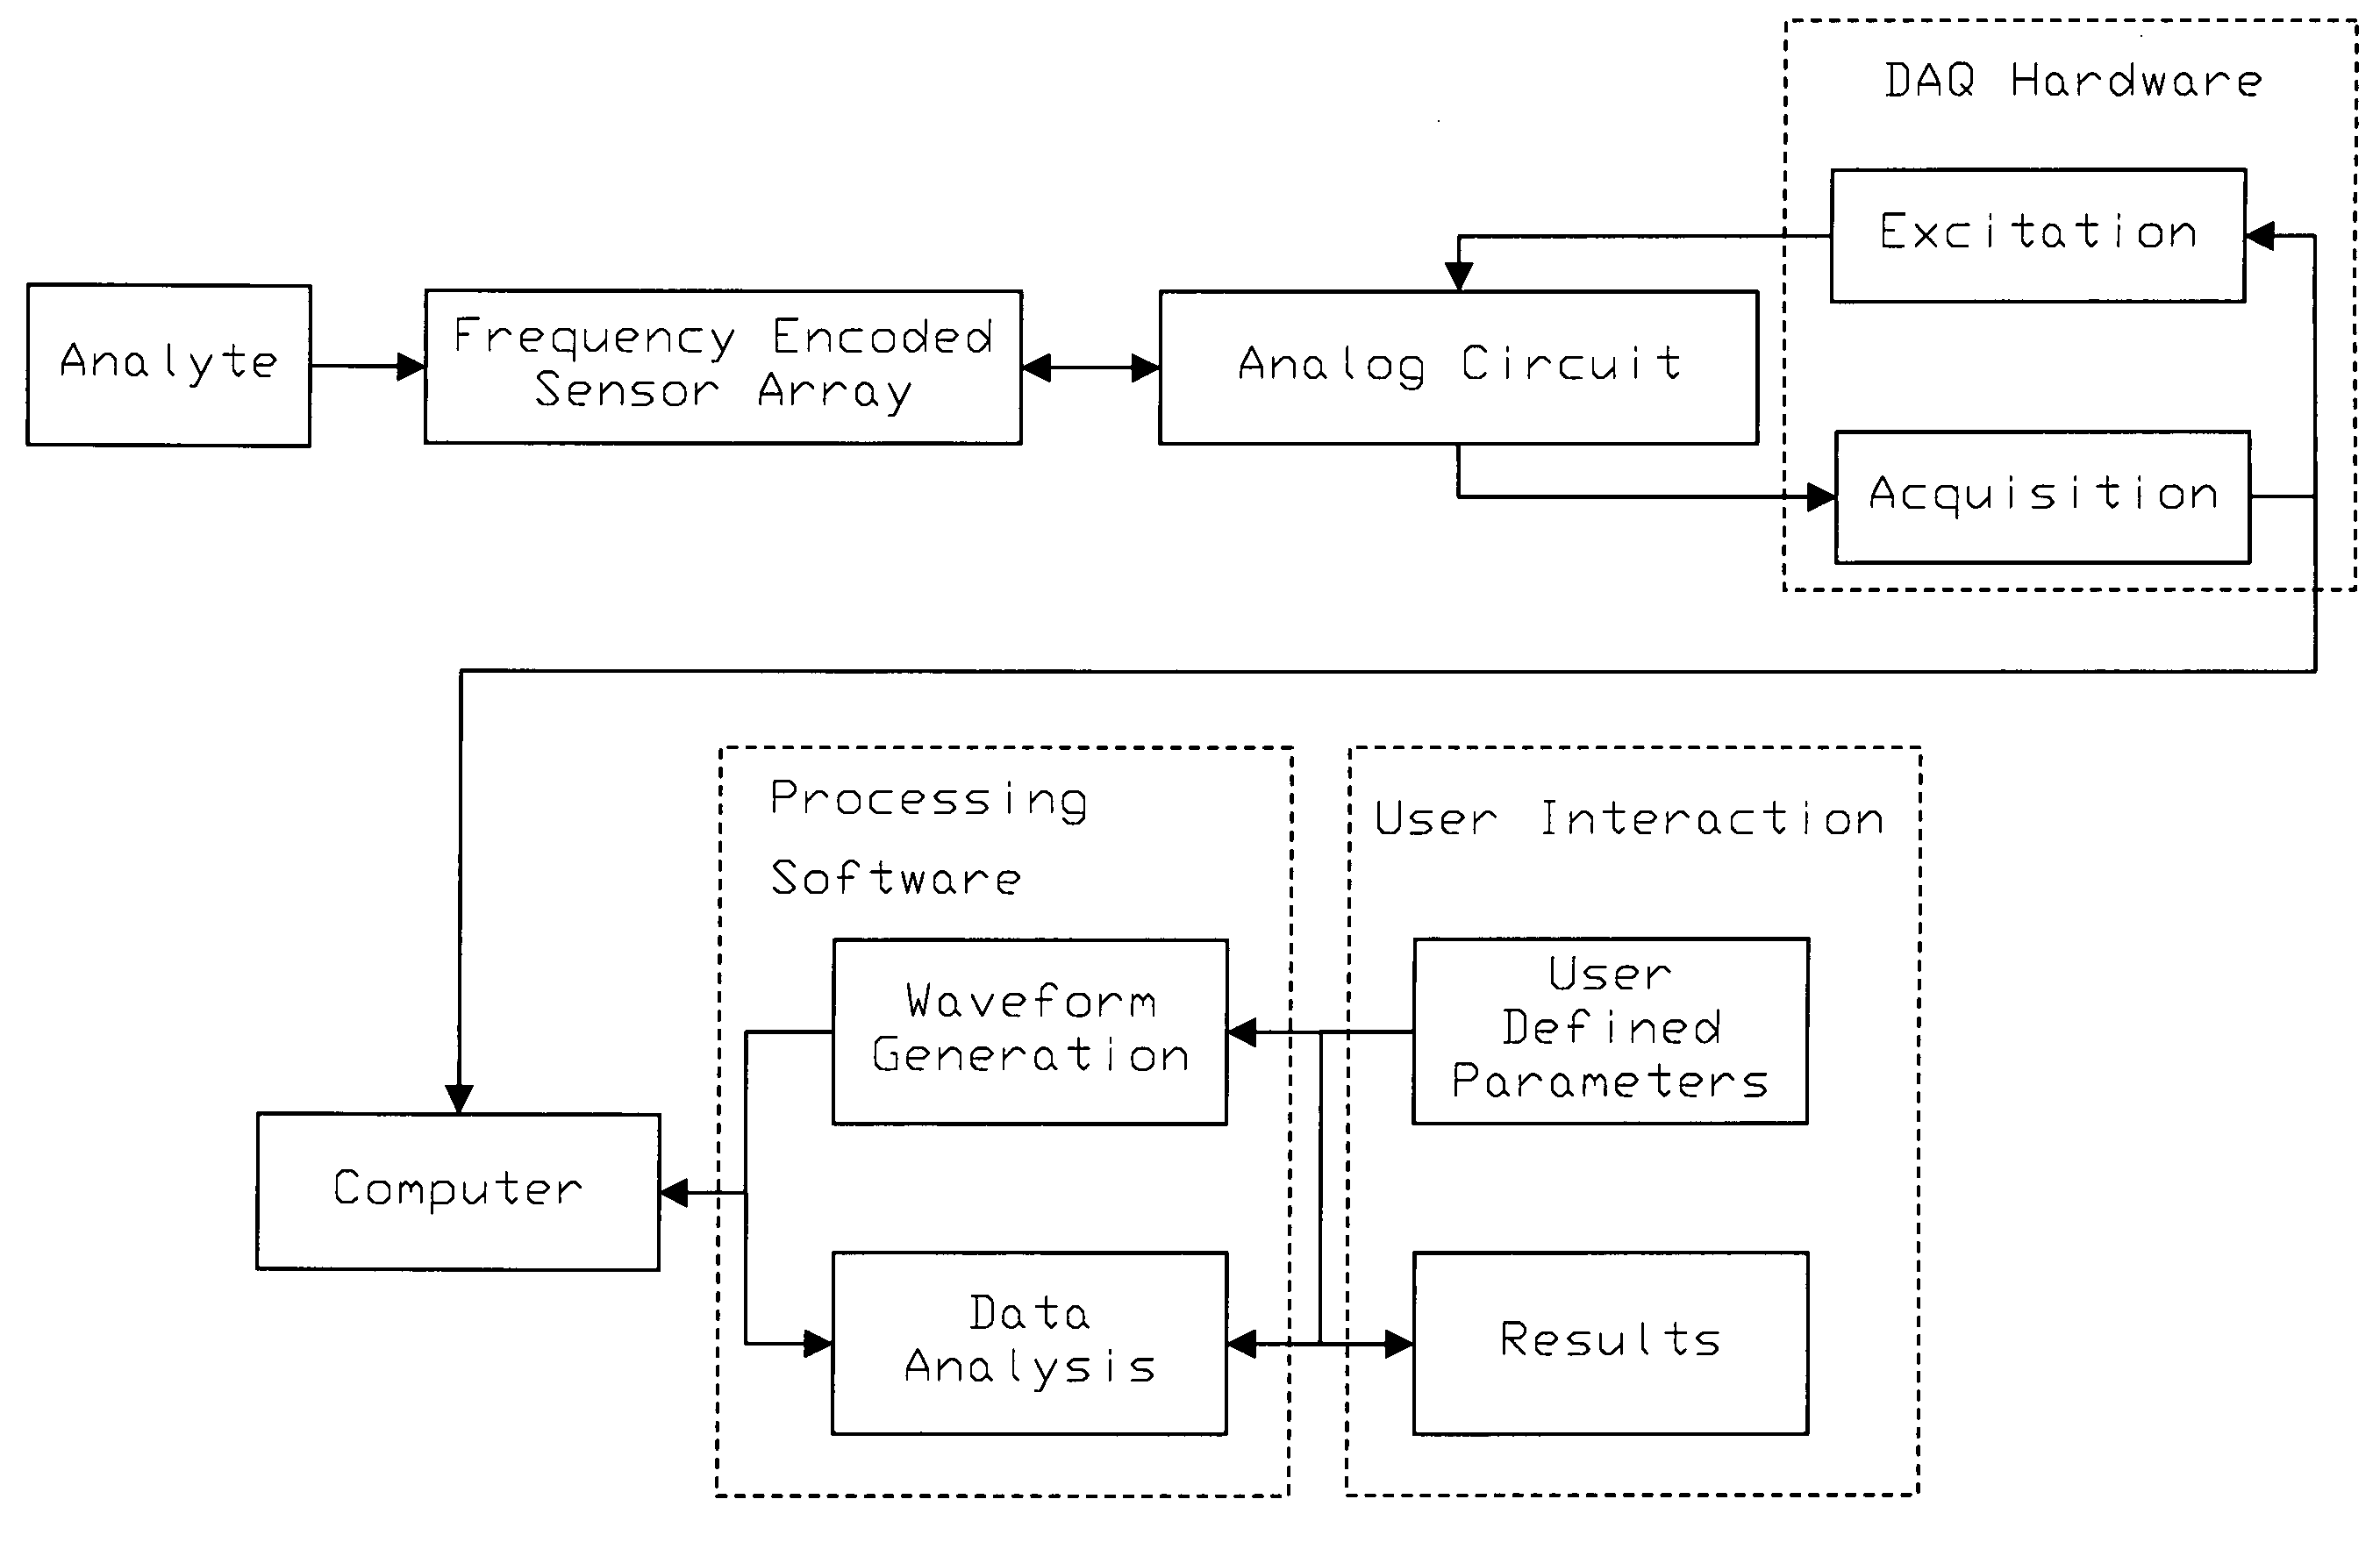
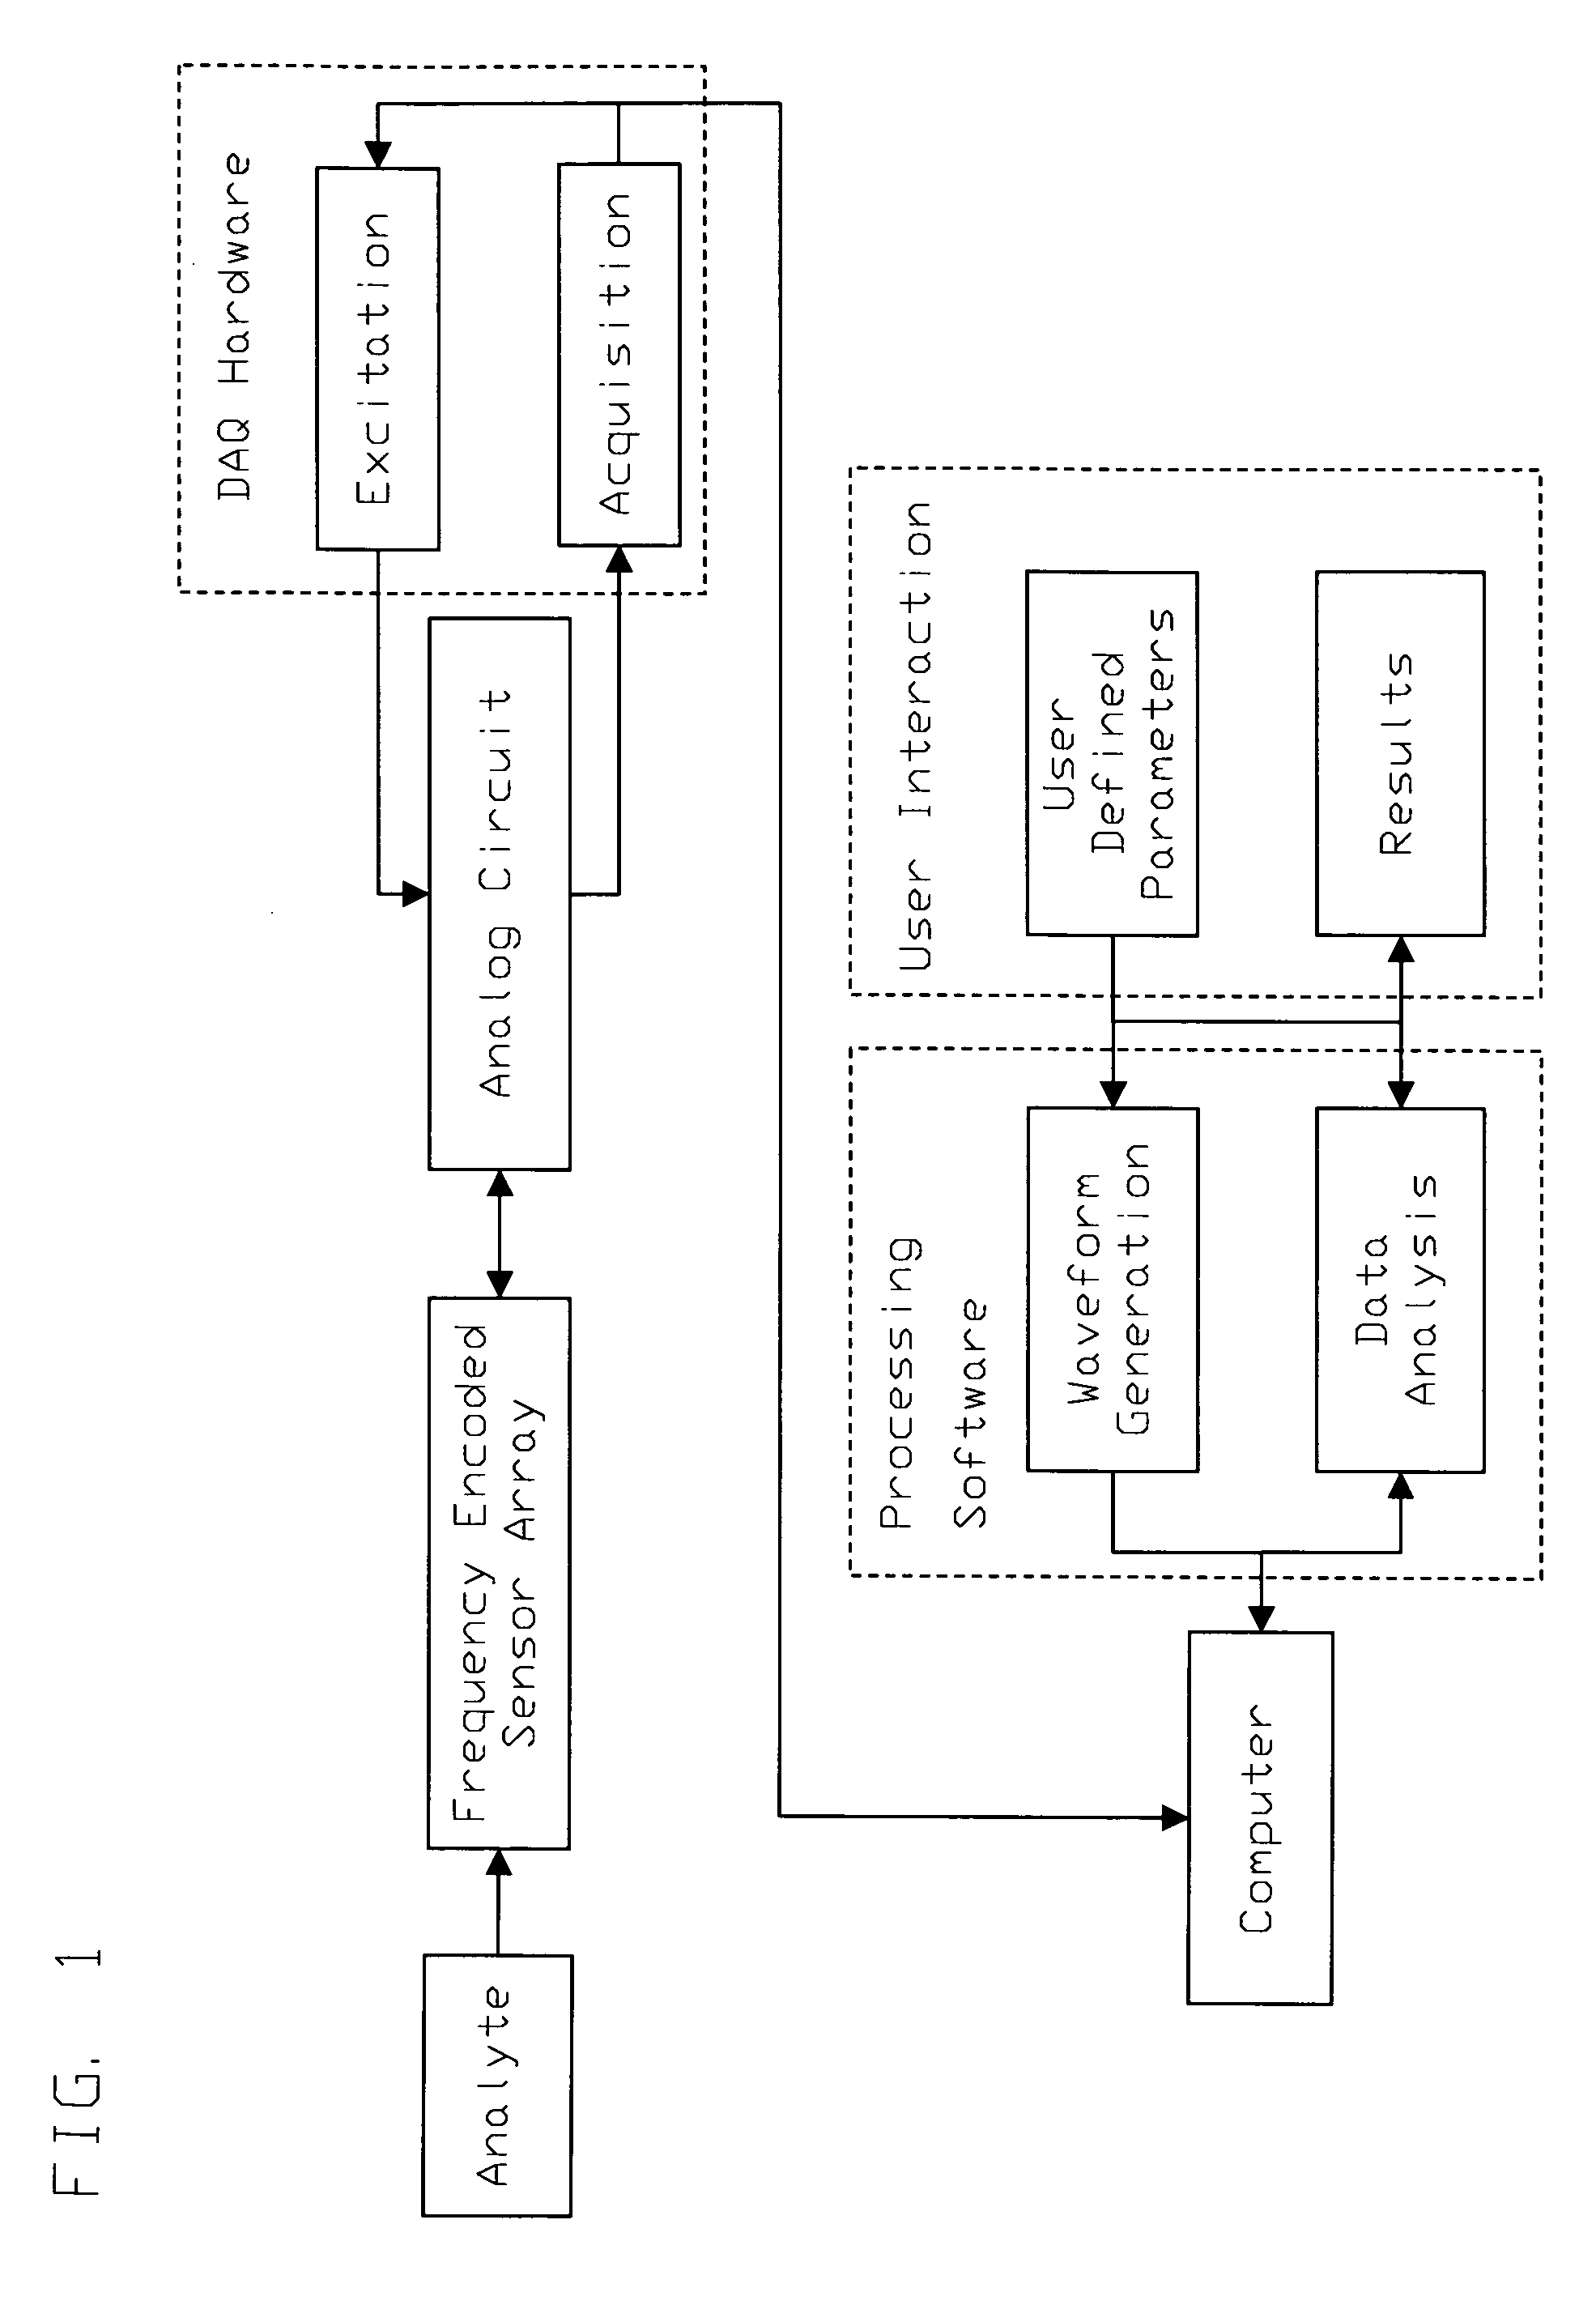
The two sensors were connected in parallel and a 4.7 kΩ resistor was then connected in series before connection to a data acquisition card (NI6062, National Instrument, Austin, Tex.), interfaced to a laptop computer through a PCMCIA sl...

example 2

Vapor Component Detection Using a Two-element Tuning Fork Sensor Array

The vapor sensing was conducted using the sensor and data acquisition protocol described in Example 1, at 70° F. (21.1° C.). At this temperature, literature reported equilibrium vapor pressures for the solvents are: 2-propanol at 33.5 torr, toluene at 22.3 torr, and acetone at 170.1 torr. A small amount of one solvent was added to a 20 mL vial, sufficient to saturate the vapor, and the vial was allowed to equilibrate for 10 minutes. The sensor was brought into contact with the vapor in the vial and sensor data was acquired. The analyte-dependent response of the sensor was sufficiently fast and there was no observable change in resonance peak positions for the sensor elements in subsequent acquisitions after the initial measurement of the vapor environment. When the sensor was removed from the vapor, the sensor element frequencies returned to the initial values within 2-3 seconds. In this way, the response of the...

example 3

Fabrication and Vapor Sensing of a 9-element Tuning Fork Sensor Array

Using commercially available quartz tuning fork devices, as described in Example 1, a 9-element sensor array was prepared. Polymers used to fabricate the 9-sensor array were dissolved in THF at a concentration of 2-2.5%, and the forks were dip-coated in these solutions. Pulsed excitation followed by acquisition of the FOD signal was carried out as in Example 1. Peak locations for each sensor element in the 9-sensor array were calculated by a centroid procedure.

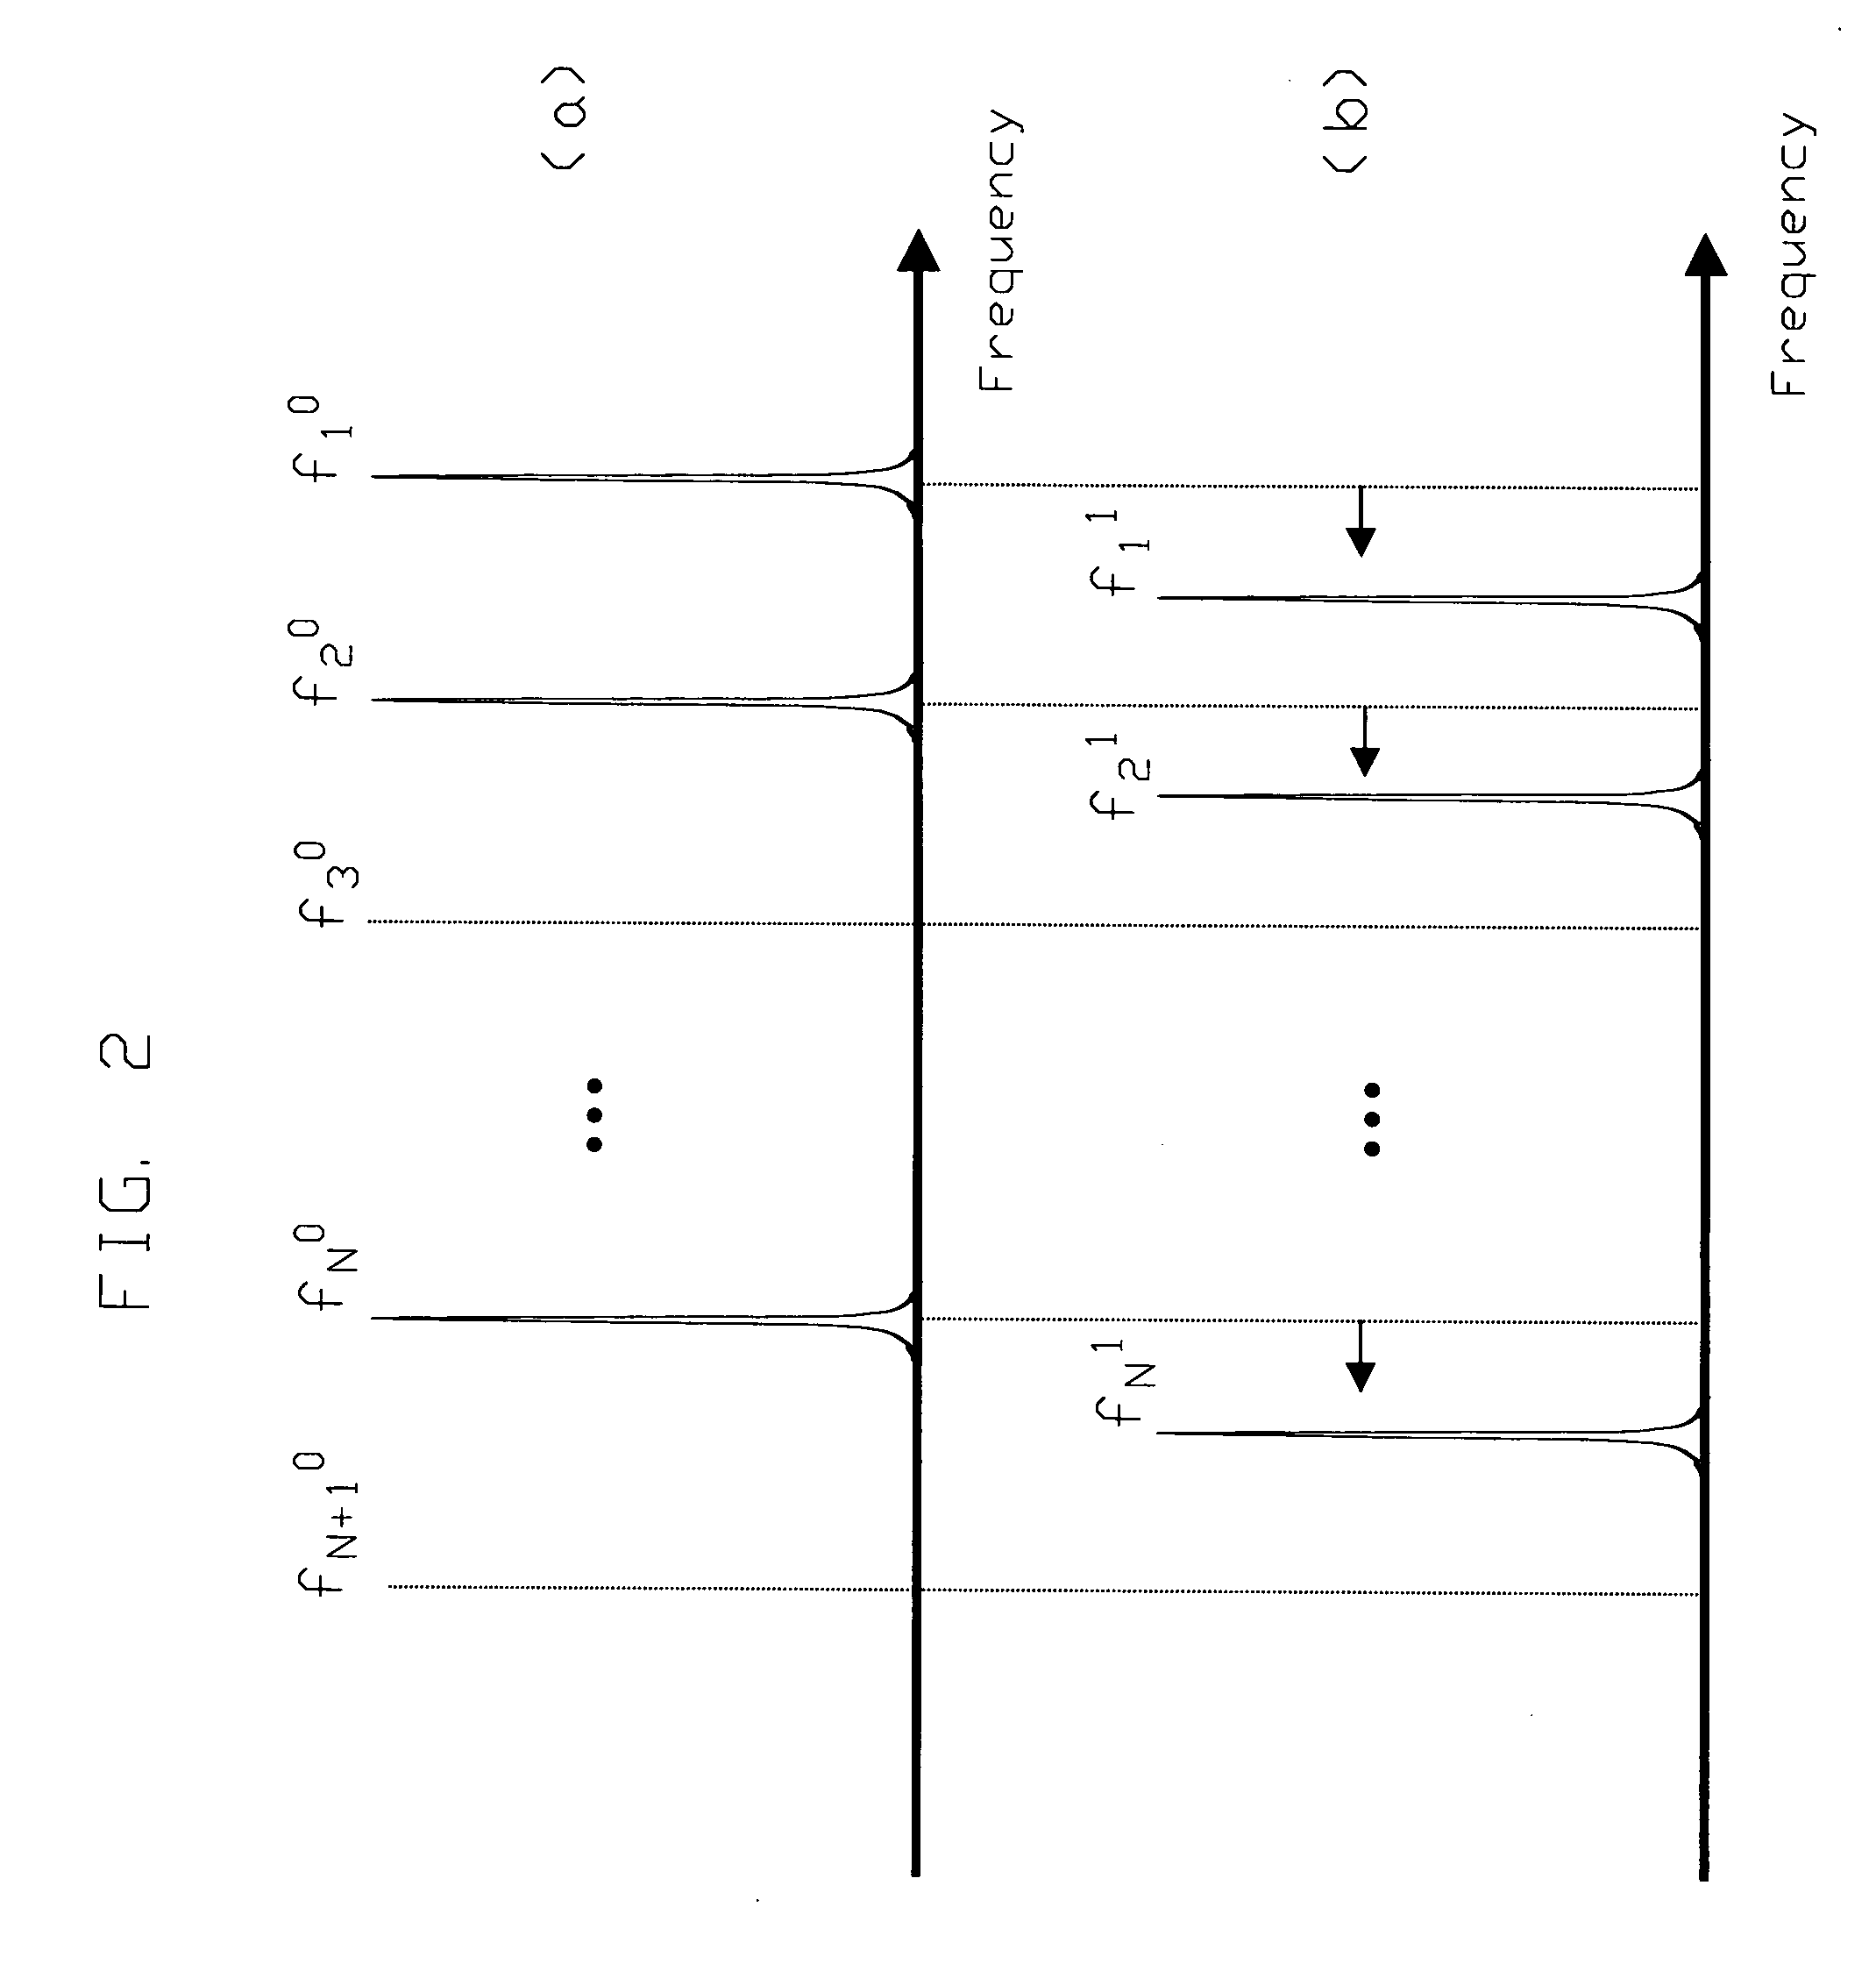
As shown in FIG. 9A, the frequency encoded 9-device array before polymer coating occupies a frequency range of 3 kHz (32.5-35.5 kHz). The uncoated sensors are roughly evenly distributed in the frequency range and have a similar q-value (peak width). Sensor #9 (numbered sequentially from low to high frequency) has low signal intensity, and possibly was damaged by the frequency shifting process. Polymer coating also causes a decrease in the q-values for man...


PUM

PropertyMeasurementUnit
frequencyaaaaaaaaaa
resonant frequenciesaaaaaaaaaa
thicknessaaaaaaaaaa

Abstract

A method for the detection of analytes using resonant mass sensors or sensor arrays comprises frequency encoding each sensor element, acquiring a time-domain resonance signal from the sensor or sensor array as it is exposed to analyte, detecting change in the frequency or resonant properties of each sensor element using a Fourier transform or other spectral analysis method, and classifying, identifying, and/or quantifying analyte using an appropriate data analysis procedure. Frequency encoded sensors or sensor arrays comprise sensor elements with frequency domain resonance signals that can be uniquely identified under a defined range of operating conditions. Frequency encoding can be realized either by fabricating individual sensor elements with unique resonant frequencies or by tuning or modifying identical resonant devices to unique frequencies by adding or removing mass from individual sensor elements. The array of sensor elements comprises multiple resonant structures that may have identical or unique sensing layers. The sensing layers influence the sensor elements' response to analyte. Time-domain signal is acquired, typically in a single data acquisition channel, and typically using either (1) a pulsed excitation followed by acquisition of the free oscillatory decay of the entire array or (2) a rapid scan acquisition of signal from the entire array in a direct or heterodyne configuration. Spectrum analysis of the time domain data is typically accomplished with Fourier transform analysis. The methods and sensor arrays of the invention enable rapid and sensitive analyte detection, classification and/or identification of complex mixtures and unknown compounds, and quantification of known analytes, using sensor element design and signal detection hardware that are robust, simple and low cost.

Description

REFERENCES CITED References CitedU.S. PATENT DOCUMENTS4,065,95903 Jan-78Richardson73 / 54.134,484,46827 Nov-84Gau, et al73 / 54.354,741,20003 May-88Hammerle73 / 54.254,761,54502 Aug-88Marshall, et al.250 / 2914,783,98715 Nov-88Hager et al.73 / 32.4,920,78701 May-90Dual, et al.73 / 54.414,945,23431 Jul-90Goodman, et al.250 / 2915,013,91207 May-91Guan250 / 2825,151,11009 Sep-92Bein, et al.95 / 1405,198,71630 Mar-93Godshall et al.310 / 349.5,201,21513 Apr-93Granstaff et al.73 / 54.5,211,05418 May-93Muramatsu, et al73 / 64.425,224,97206 Jul-93Frye, et al.95 / 95,325,70405 Jul-94Mariani, et al.73 / 24.065,365,77822 Nov-94Sheen et al.73 / 54.5,416,44816 May-95Wessendorf331 / 116.5,469,36921 Nov-95Rose-Pehrsson, et al.702 / 275,488,86606 Feb-96Ravel, et al.73 / 5795,503,00302 Apr-96Brookfield73 / 54.5,526,28711 Jun-96French364 / 550.5,541,85530 Jul-96Enzler et al.364 / 552.5,589,39631 Dec-96Frye, et al.436 / 735,661,22626 Aug-97Bowers, et al.73 / 24.015,731,51024 Mar-98Jones, et al.73 / 23.315,734,09831 Mar-98Kraus et al.73 / 61.5,741,961...

Claims


Application Information

Patent Timeline
Patent Type & Authority Applications(United States)
IPC IPC(8): G01N27/00G01N29/00G01N29/02G01N29/036G01N29/04
CPCG01N29/022G01N29/036G01N2291/0256G01N2291/0422G01N2291/106G01N2291/0426G01N2291/0427G01N2291/0428G01N2291/0423
Inventor GUAN, SHENHENGNIELSEN, RALPH B.
Owner PALO ALTO SENSOR TECH INNOVATION
Why Eureka
Try Eureka