Spectral bio-imaging data for cell classification using internal reference

a spectral bioimaging and cell technology, applied in the field of spectral bioimaging data, can solve the problems of large size and configuration of remote sensing spectral imaging systems, limited use of air and satellite-born applications, and inability to choose, prior to making the measurement, and a desired region

Inactive Publication Date: 2004-02-10
APPLIED SPECTRAL IMAGING
View PDF10 Cites 76 Cited by
  • Summary
  • Abstract
  • Description
  • Claims
  • Application Information

AI Technical Summary

Problems solved by technology
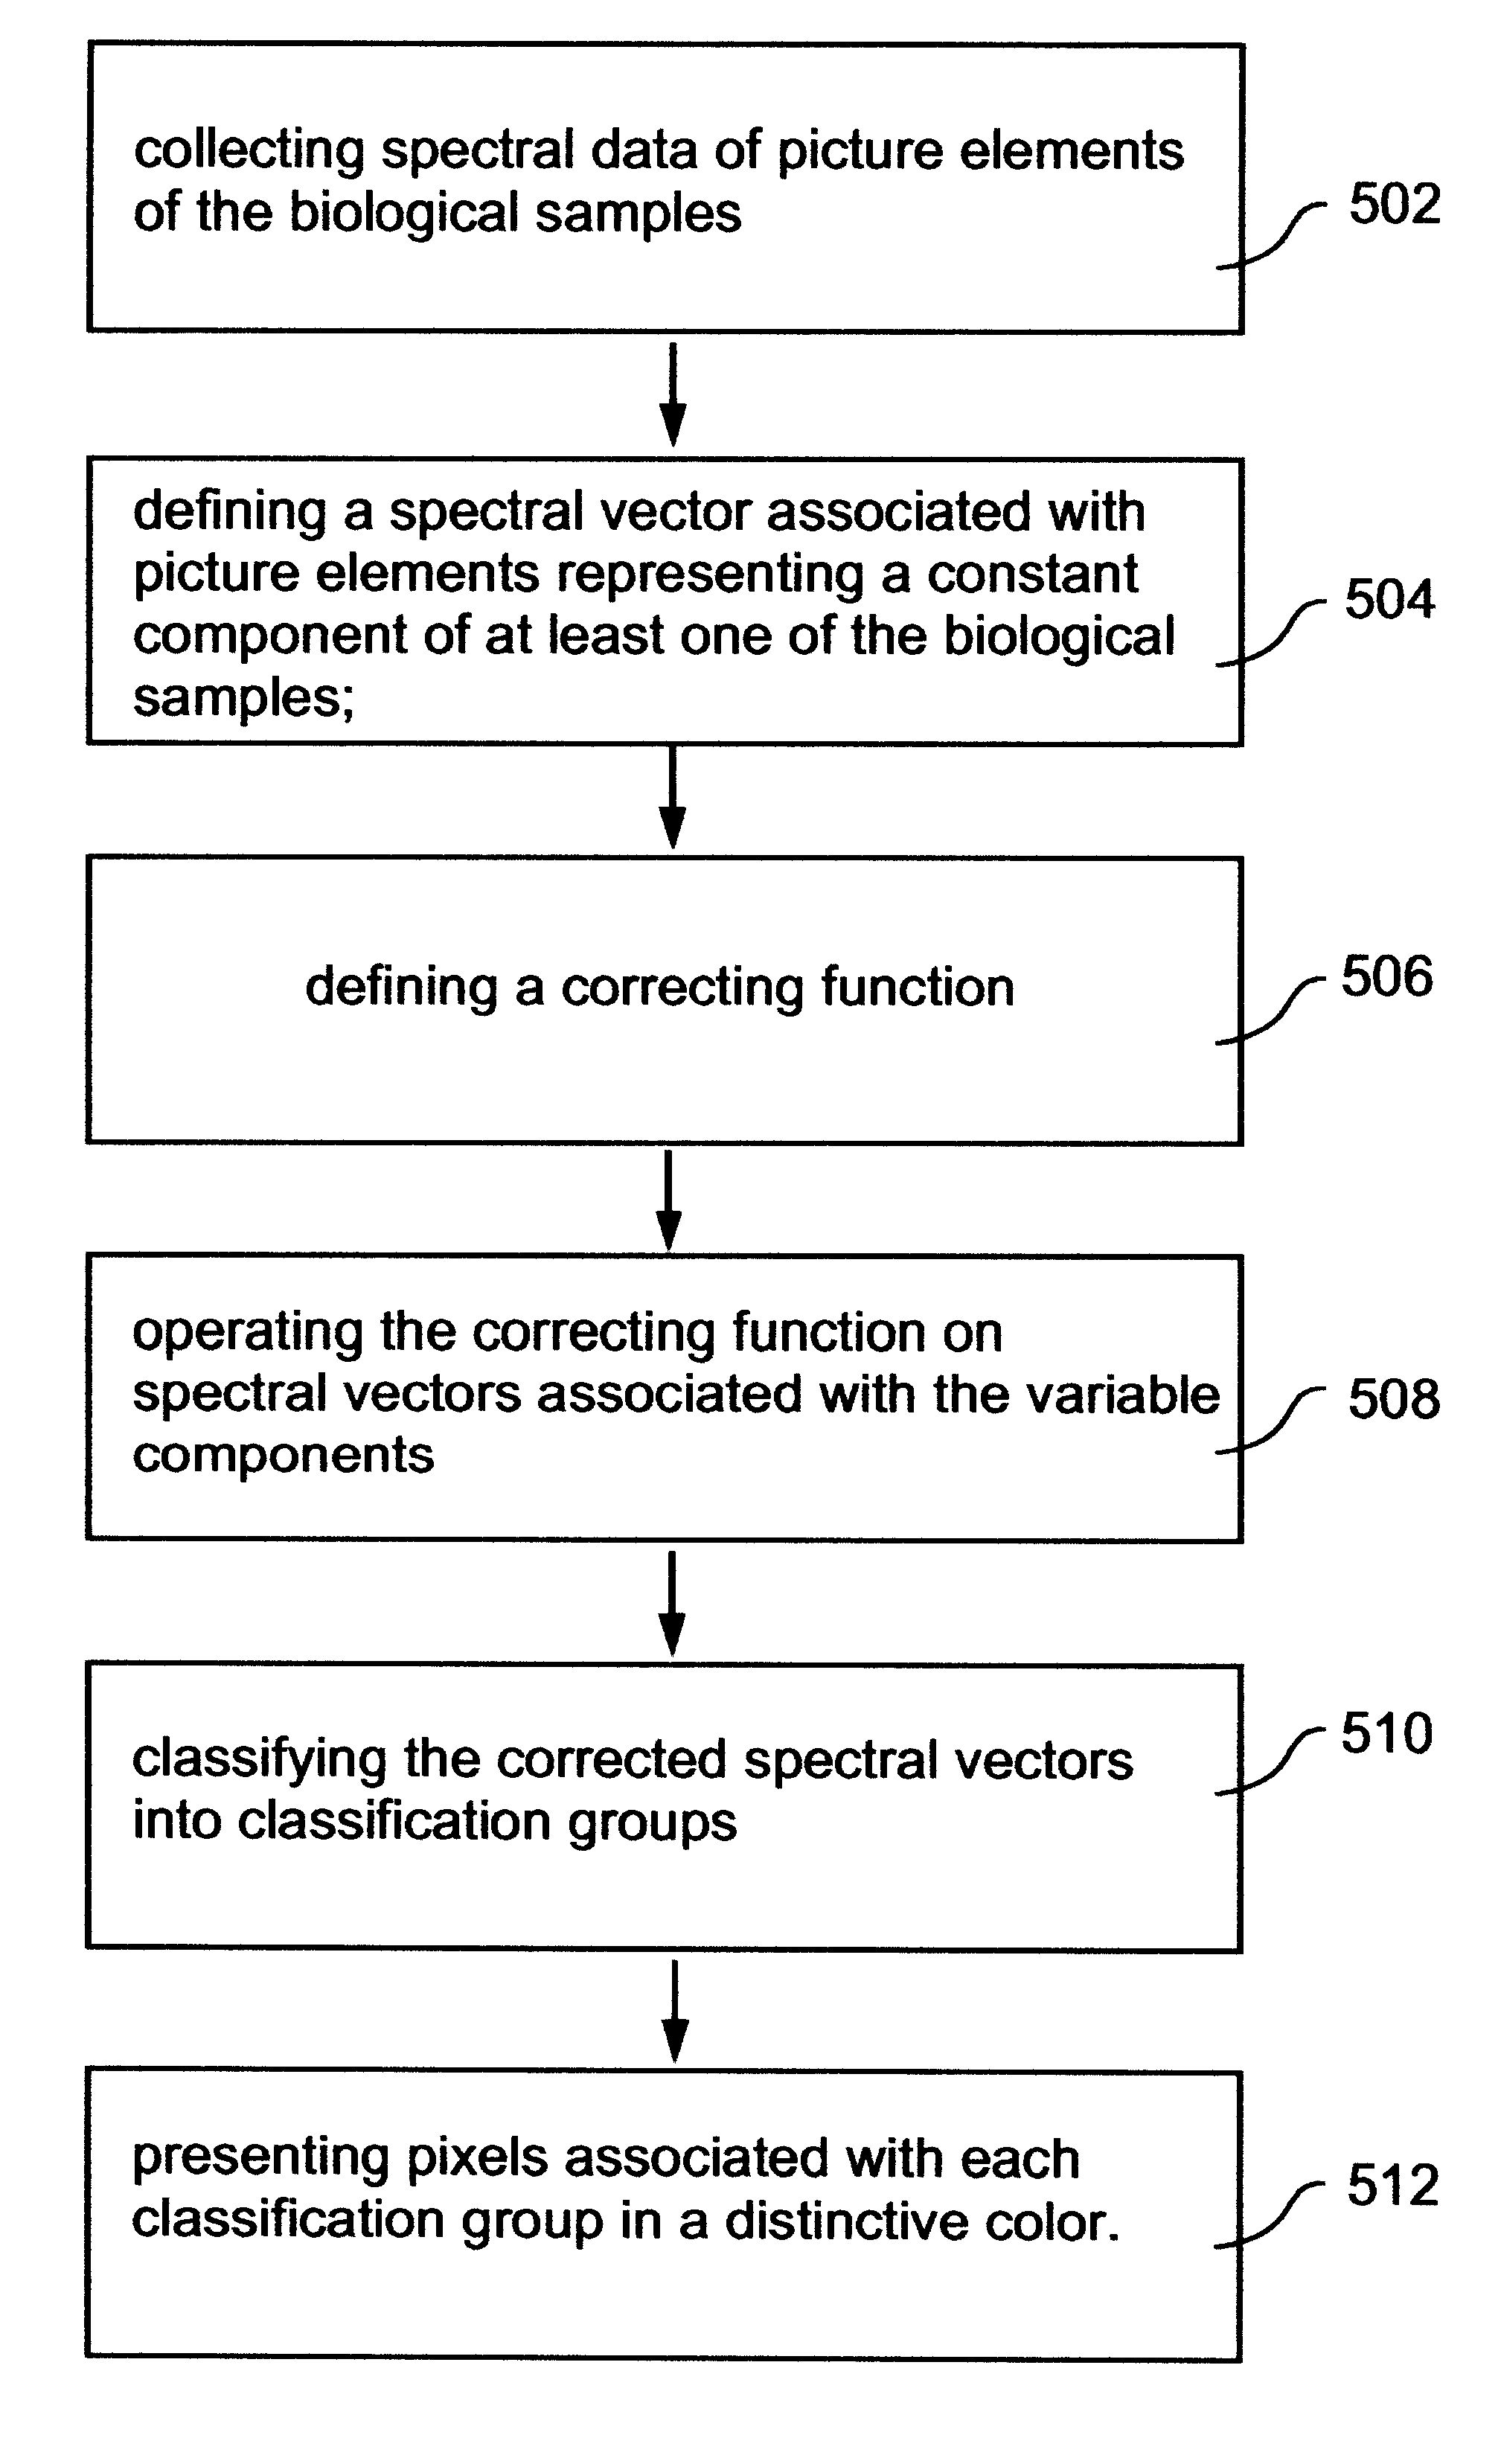
However, the high cost, size and configuration of remote sensing spectral imaging systems (e.g., Landsat, AVIRIS) has limited their use to air and satellite-born applications [See, Maymon and Neeck (1988) Proceedings of SPIE--Recent Advances in Sensors, Radiometry and Data Processing for Remote Sensing, 924, pp.
The inability to visualize the two-dimensional image before the whole measurement is completed, makes it impossible to choose, prior to making the measurement, a desired region of interest from within the field of view and/or to optimize the system focus, exposure time, etc.
It should be further noted that slit-type imaging spectrometers have a major disadvantage since most of the pixels of one frame are not measured at any given time, even though the fore-optics of the instrument actually collects incident light from all of them simultaneously.
Furthermore, slit-type spectral imagers require line scanning to collect the necessary information for the whole scene, which may introduce inaccuracies to the results thus obtained.
However, AOTFs and LCTFs have the disadvantages of (i) limited spectral range (typically, .lambda..sub.max =2.lambda..sub.min) while all other radiation that falls outside of this spectral range must be blocked, (ii) temperature sensitivity, (iii) poor transmission, (iv) polarization sensitivity, and (v) in the case of AOTFs an effect of shifting the image during wavelength scann...

Method used


Image

  • Spectral bio-imaging data for cell classification using internal reference
  • Spectral bio-imaging data for cell classification using internal reference
  • Spectral bio-imaging data for cell classification using internal reference

Examples


Embodiment Construction

Reference in now made to the following examples, which together with the above descriptions, illustrate the invention.

Materials and Methods

May Grunwald Giemsa (MGG) Staining of Peripheral Blood Specimens

Peripheral blood was obtained from normal healthy individuals and from patients with typical acute lymphocytic leukemia (ALL), chronic lymphocytic leukemia (CLL), infectious mononucleosis (IM), plasma cell lymphoma (PCL), prolymphocytic leukemia (PLL) and Sezary syndrome (SEZARY), which were diagnosed according to established criteria. The patients did not receive chemotherapy for at least 3 months before obtaining the samples.

Fourier-Transform Multipixel Spectrometry System for Microscopy

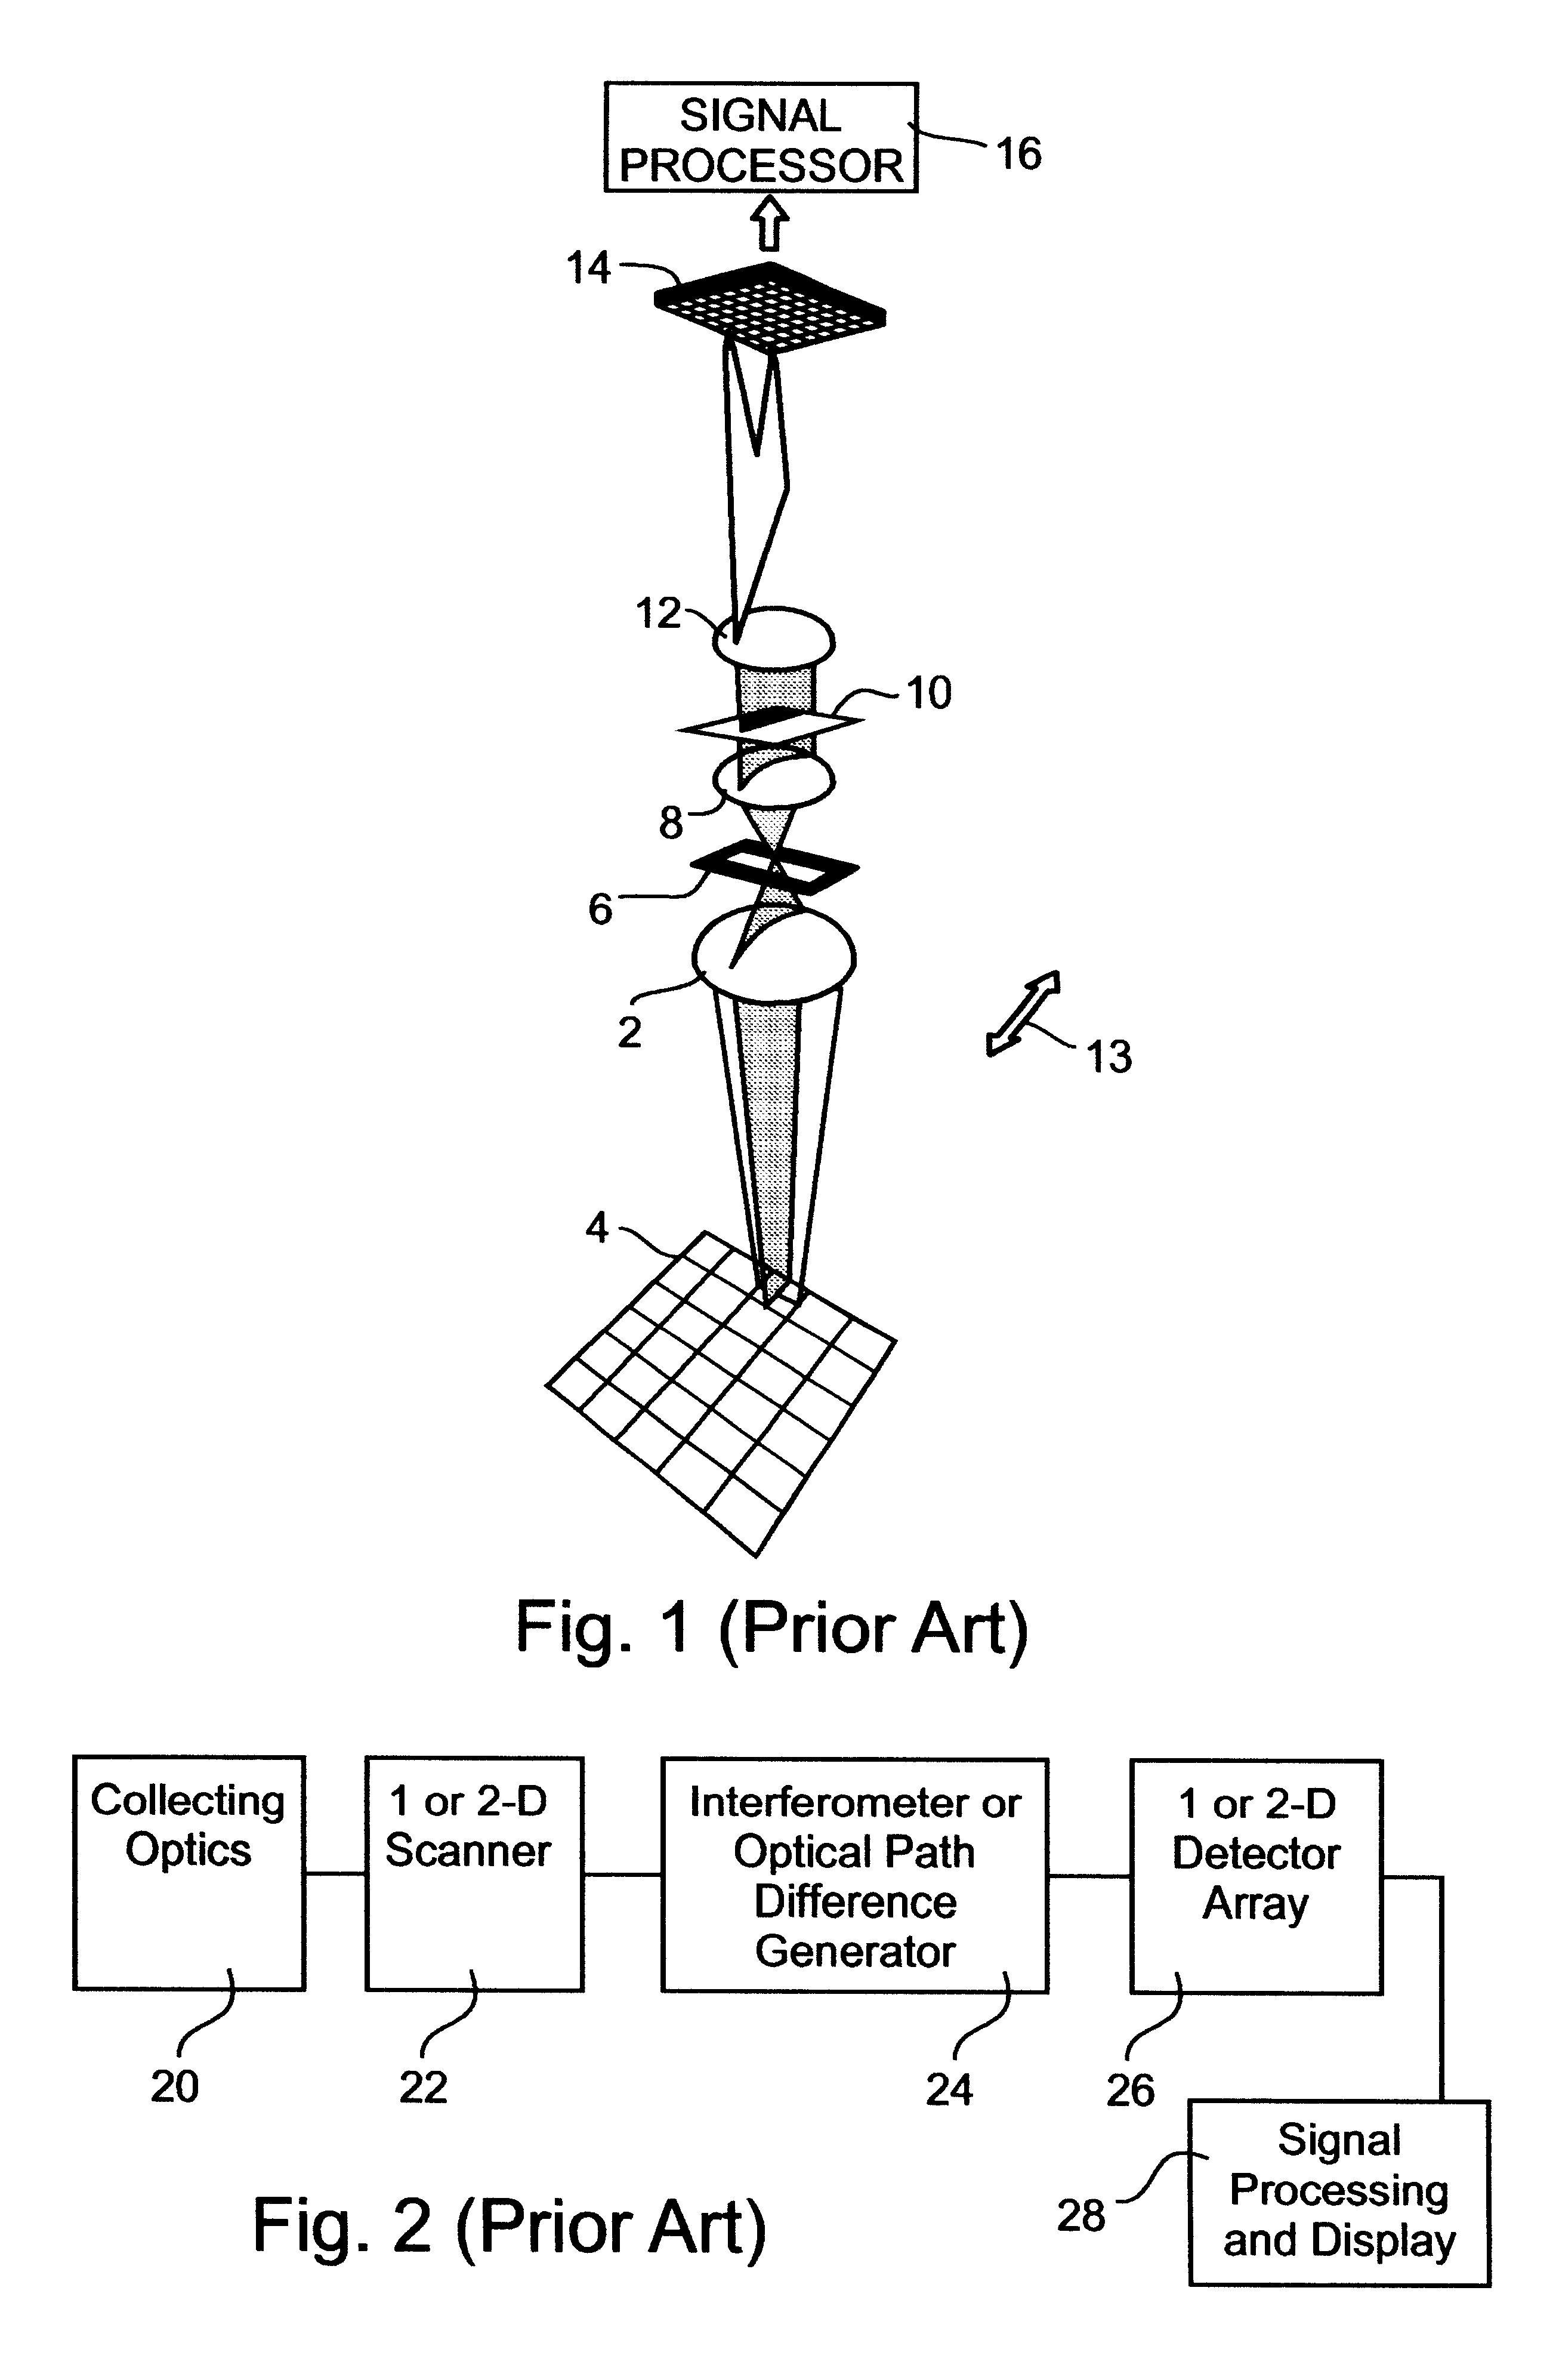
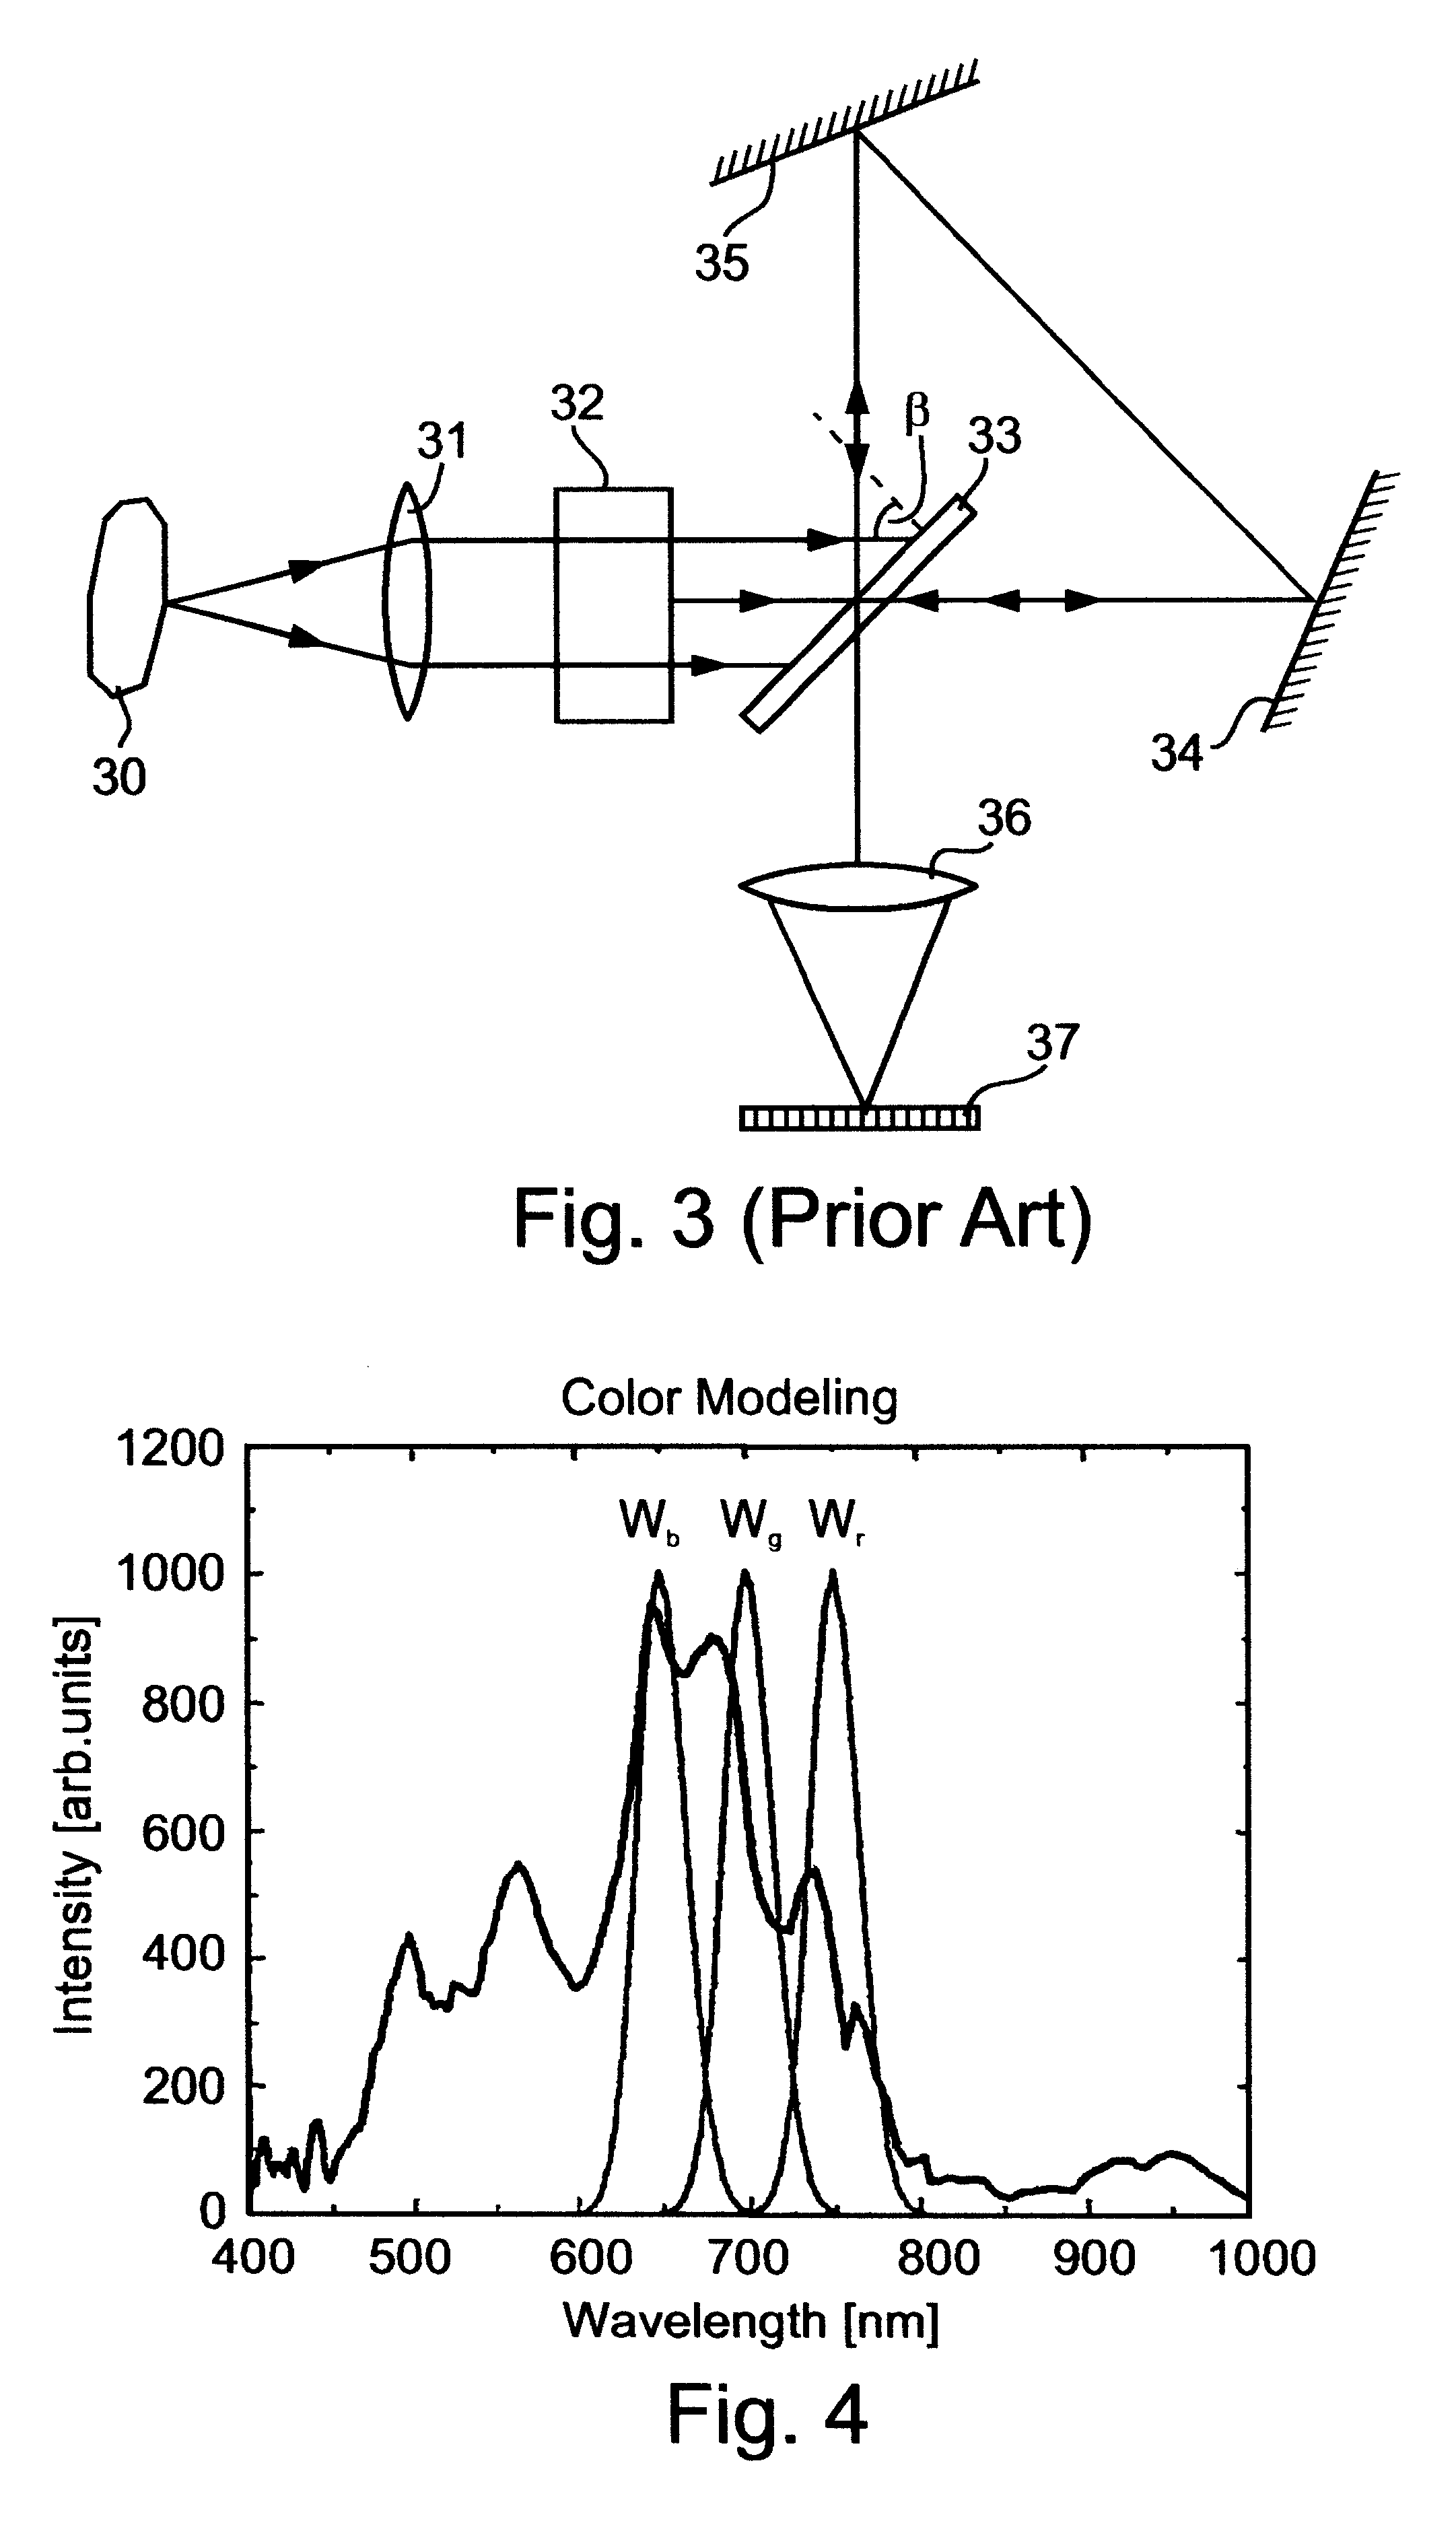
The SPECTRACUBE.TM. system (Applied Spectral Imaging (ASI) Ltd., Industrial Park, Migdal Haemek, Israel) was used for spectral imaging of the samples. The SPECTRACUBE.TM. system employed includes a Sagnac interferometer which is a particular type of triangular interferometer (see FIG. 3 above) and h...


PUM

PropertyMeasurementUnit
Lengthaaaaaaaaaa
Lengthaaaaaaaaaa
Lengthaaaaaaaaaa

Abstract

A method of spectral-morphometric analysis of biological samples, the biological samples including substantially constant components and suspected variable components, the method is effected by following the steps of (a) using a spectral data collection device for collecting spectral data of picture elements of the biological samples; (b) defining a spectral vector associated with picture elements representing a constant component of at least one of the biological samples; (c) using the spectral vector for defining a correcting function being selected such that when operated on spectral vectors associated with picture elements representing other constant components, spectral vectors of the other constant components are modified to substantially resemble the spectral vector; (d) operating the correcting function on spectral vectors associated with at least the variable components for obtaining corrected spectral vectors thereof; and (e) classifying the corrected spectral vectors into classification groups.

Description

FIELD AND BACKGROUND OF THE INVENTIONThe present invention relates to spectral methods in general and, more particularly, to spectral imaging methods for cell classification, biological research, medical diagnostics and therapy, which methods are referred to hereinbelow as spectral bio-imaging methods. The spectral bio-imaging methods of the present invention can be used to provide automatic and / or semiautomatic spectrally resolved morphometric classification (e.g., detection, grading) of neoplasm, by standardizing the measured spectra of biological material present in biological samples in general, but more specifically when these samples are stained for microscopy imaging, and as a result enabling the building of libraries of spectral signatures for these biological objects, and therefore allowing automatic and semiautomatic analysis of such samples. Also, cytological or tissue section specimen which are generally stained with chromogenic dyes, simultaneously with, or without, spe...

Claims


Application Information

Patent Timeline
IPC IPC(8): C12Q1/68G01B11/06G01N33/569G01N33/50G01J3/28G01N21/64G01J5/10G01N33/58G01J3/26G01J3/45G01J3/44G01J3/453G01J3/12G06K9/74G06K9/76G06K9/00G01J3/00G01J3/02G01N1/30G01N15/14G06V10/88
CPCG01B11/0675G01J3/12G01J3/1256G01J3/26G01J3/2823G01J3/4406G01J3/453G01J5/10G01N1/30G01N15/1475G01N21/6428G01N21/6458G01N33/5005G01N33/56966G01N33/582G06K9/00127G06K9/76G01J3/02G01J2003/2866G01N2021/6417G06V20/69G06V10/88
Inventor CABIB, DARIOBUCKWALD, ROBERT A.BEN-YOSEF, NISSIM
Owner APPLIED SPECTRAL IMAGING
Why Eureka
Try Eureka