However, without the use of equipment for
processing the appropriate
spectral resolution the qualitative or quantitative detection of these chromogens is difficult due to the fact that their absorption coefficients spectrally overlap.
Aside from the
mechanics of making such measurements, which will be discussed, a number of issues are related to the peculiarities of IHC which potentially affect how the measurements should be made.
The result is that the amount of
antigen cannot be directly calculated from the intensity of the immunohistochemical
staining.
It has been suggested that the
biotin-
avidin method of
staining may be less suitable for this purpose than the
peroxidase-antiperoxidase method, because the former suffers from high sensitivity for low concentrations of
antigen and poor
dynamic range, due to steric hindrance at higher
antigen concentrations.
This cannot be achieved according to any of the methods known in the prior art.
This
system, however, has an inherent limitation.
Such
standardization has been difficult to achieve in another technically related area,
flow cytometry, although there has been progress [Muirhead KA.
Mitotic counts are generally regarded as a poor and unreliable measure of proliferation; yet they require no special preparative methods.
Although the TLI provides an accurate assessment of S-phase activity and permits histologic correlation, the method is cumbersome and not easily adapted to the clinical laboratory.
This method suffers from a number of serious technical limitations, however.
First, it may be difficult to obtain single
cell suspensions from
solid tumors, and variable numbers of
tumor cells may be lost during preparation.
Second, the
tumor cells are variably diluted by benign normal and inflammatory cells, which can lead to underestimation of the S-
phase fraction, particularly for DNA diploid tumors.
Third, the complexity of the DNA content analysis ("ploidy"), which consists of a series of overlapping curves, may preclude the accurate use of curve-fitting algorithms to measure the S-phase portion of the
histogram.
Multicenter studies have shown poor reproducibility for flow-cytometric S-
phase fraction, making the practical clinical usefulness of the measurement somewhat doubtful.
Another problem associated with
cell kinetic measurement by
flow cytometry is that only the S-
phase fraction is typically determined, whereas a significant proportion of the tumor
cell population may reside in the G.sub.1 phase of the
cell cycle, comprised of cells committed to entering the cycle but not yet synthesizing DNA.
Unfortunately, both the staining procedures and prior art instruments have well-known limitations such that the final measurement is not representative of the
absolute amount of DNA actually present in a
nucleus.
While
stoichiometry can easily be verified by routine controls, the specificity is not accessible because there is no alternative method for the cytometric measurement of DNA content at the individual cell level.
As far as
image cytometry of Feulgen-stained nuclei is concerned, the Beer and Lambert laws do not perfectly apply since (i) the
linearity of stain to
optical density (OD) is progressively lost as OD runs over 1 unit, which is often the case for heavily stained heterochromatin; (ii) the distribution of the dye is not spatially homogeneous and thus introduces a distributional error that increases as the pixel size increases over from the resolution power of the
optics; (iii) the absorption coefficient of a dye varies with the
wavelength of light so that the densitometric calculation only applies for monochromatic light.
Therefore, all the pixel ODs calculated are slightly erroneous.
The above limitations all contribute to negative errors that have been extensively investigated.
It is thus obvious that the true cell DNA content is not accessible to cytometric measurements.
It is therefore astounding that some commercially available
image cytometry systems provide measurements expressed in picograms DNA per
nucleus, thus adding to the general
confusion and, in addition, deliberately misleading the clinicians using such systems.
If
hydrolysis is topped in the very steep phases (i) or (iv), even minimal variations of
processing time lead to considerable variations in staining.
These additives, however, do not play an important role for practical purposes.
Frequently, HCl stored in the refrigerator at 4.degree. C. is used immediately without waiting for the acid to warm up; this leads to retardation of the hydrolic reaction, which is often stopped before the
plateau phase is reached.
The staining procedure itself is uncritical.
The Einarson GCA staining protocol prescribes staining times of up to 48 hours at elevated temperature which makes it impossible to use for routine
cytology.
The disadvantages are: (i) not specific for DNA; (ii) background staining (due to
RNA); and (iii) short shelf-life of the staining solution (about 6 weeks).
However, they give completely different results when the texture of nuclear
chromatin is measured at high
optical resolution:
acid hydrolysis changes the
chromatin structure dramatically, and the
chromatin texture of Feulgen-stained cell nuclei is absolutely different from the texture of GCA-stained material.
The clinical usefulness of Ki-67
antibody had been somewhat limited by the fact that the antigen is preserved in
frozen tissue and is lost on standard fixation.
However, the staining in
tissue sections varies depending on the method of
tissue preparation and fixation as well as the clone of
antibody used, and the degree of antigen detection appears to be sensitive to the duration of fixation, with long fixation times resulting in antigen loss.
The additional time needed to perform such manual analysis makes routine clinical use unlikely, given the time constraints of a busy
pathology practice.
Such measurements are more easily made on cytological preparations than on
tissue sections, where distinguishing individual nuclei, which are frequently touching or overlapping, may be difficult or impossible.
This
system is however highly limited in spectral resolution and therefore has limited applications.
However, this average measurement may not be necessarily the most biologically relevant.
However, in any case,
image analysis while providing excellent spatial resolution is very limited in spectral resolution, which limitation is addressed by the present invention.
However, a number of technical problems with the biochemical
assay limit its usefulness.
First, the widespread use of
mammography has resulted in an increasing proportion of resected tumors too small for biochemical analysis, which requires 300 to 500 mg of tissue, and fine-needle aspiration samples similarly cannot be evaluated by conventional methods.
Second, the lack of morphologic correlation can cause considerable error in the biochemical
assay, as intermixed benign breast structures may lead to false-positive results, and excessive tumor
dilution by normal and inflammatory cells can lead to false-negative results.
Sampling error can be difficult to detect unless frozen sections are performed on the tissue prior to
processing, a step not usually performed in most laboratories.
Third, the DCC method is very labor-intensive.
A serious technical limitation in the use of immunohistochemical ER termination has been the difficulty of objectively analyzing and quantitating the staining reaction.
Semiquantitative methods, such as the HSCORE do not provide the reproducibility required among laboratories, and standards for measuring and reporting the staining reaction have not yet been established.
The use of
image analysis does offer an opportunity to provide such a standard of practice for quantitation of
hormone receptors in
breast cancer, and the
nuclear staining pattern is easily adapted for QIHC, as described above for Ki-67 antigen, however, since it is highly limited in spectral resolution it is not applicable for a
multiple markers / counter stains study.
However, intensity of staining is difficult to standardize and is subject to daily variation in the laboratory.
Again, based on imaging per se, this method is limited in spectral resolution, and is therefore not applicable in the detection of multiple immunohistochemical marker stains / histological stains / DNA ploidy stains.
Discrepancies were observed, however, with regard to PR expression, and so although sampling may not be an important issue for ER, the same may not be true for PR.
Again, however,
imaging analysis cannot provide detection of
multiple markers simultaneously, although it is clear that such an ability would render QIHC more suitable for clinical applications.
Nevertheless, as was recently published following an NIH workshop which evaluated the reliability of histopathological diagnosis by the best pathologists in the field of
cancer diagnostics, there is a discordance among expert pathologists in the diagnosis of
neoplasm.
Unfortunately, histological classification of breast carcinomas is subjected to low reproducibility and attempts to classify morphological subtypes of lobular carcinomas with different prognoses, therefore seem futile [Ladekarl M, Sorensen FB: Prognostic, quantitative histopathologic variables in lobular
carcinoma of the breast.
The majority of normal lymphocytes and the dominant cellular
population of CLL both consist of small cells with dense, clumped nuclear chromatin, which makes the distinction between these lymphocytic populations difficult by conventional light
microscopy.
Third, so far it was not attempted or suggested to use a plurality of specific immunohistochemical stains combined with several histological stains and DNA ploidy stains to
label cells and thereafter extract
pathological data therefrom because, while systems providing the adequate spatial resolution (imaging systems) are widely used, systems providing the adequate spatial resolution combined with an adequate spectral resolution are much less abundant.
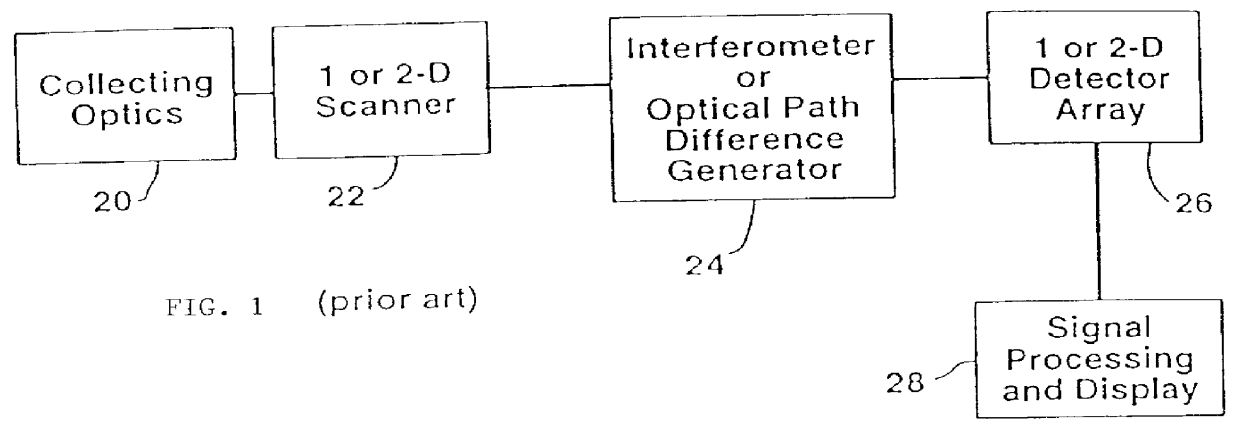
The inability to visualize the two-dimensional image before the whole measurement is completed, makes it impossible to choose, prior to making the measurement, a desired
region of interest from within the
field of view and / or to optimize the
system focus,
exposure time, etc.
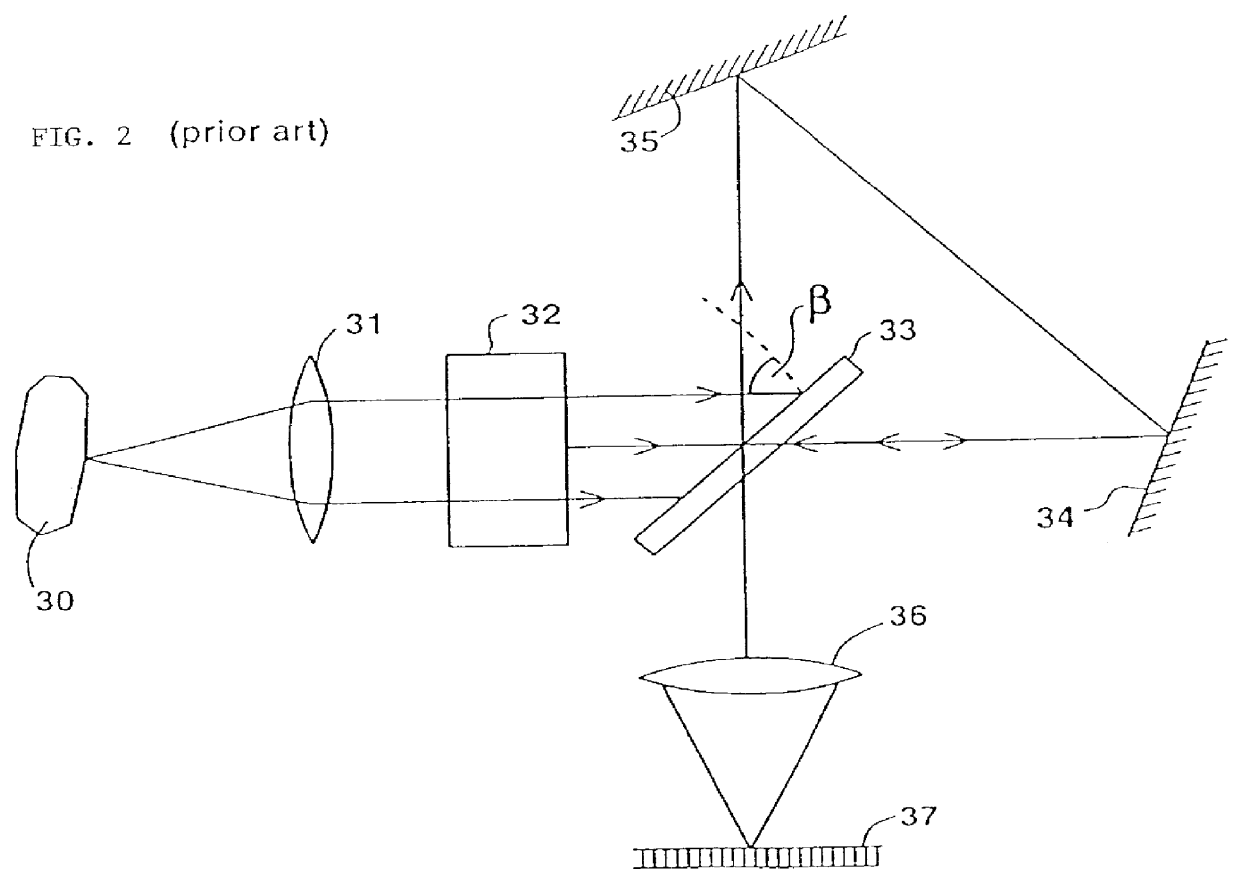
It should be further noted that slit-type imaging spectrometers have a major
disadvantage since most of the pixels of one frame are not measured at any given time, even though the fore-
optics of the instrument actually collects incident light from all of them simultaneously.
Furthermore, slit-type spectral imagers require
line scanning to collect the necessary information for the whole scene, which may introduce inaccuracies to the results thus obtained.
However, AOTFs and LCTFs have the disadvantages of (i) limited spectral range (typically, .
lambda..sub.max =2.
lambda..sub.min) while all other
radiation that falls outside of this spectral range must be blocked, (ii)
temperature sensitivity, (iii) poor transmission, (iv) polarization sensitivity, and (v) in the case of AOTFs an effect of shifting the image during
wavelength scanning, demanding careful and complicated registration procedures thereafter.
All these types of filter and tunable filter based systems have not been used successfully and extensively over the years in
spectral imaging for any application, because of their limitations in spectral resolution, low sensitivity, and lack of easy-to-use and sophisticated
software algorithms for interpretation and display of the data.
Unfortunately, current
cytochemistry and histochemistry offer a very limited number of such dyes with nonoverlapping spectra.
First it enables simultaneous detection of a plurality of stains and therefore it is effort and cost-effective.
Second, it enables the simultaneous detection of a plurality of stains on the same cells or tissue, while according to the prior art, these is not applicable for more than two or three stains.

